XRP Price Prediction: Is a Breakout to $15 Imminent? XRP Breakout Targets $15 — Analyst Says 'This Is Just The Start': Is XRP Set to Explode?
The cryptocurrency world is once again turning its attention to XRP, the token developed by Ripple Labs, as bullish analysts predict an imminent and explosive rally. After a strong run-up earlier in 2025, XRP has pulled back slightly and is now approaching a critical support zone. Some analysts are now calling for a $15 breakout target, even as the token hovers near $2.80, a level many see as a pivotal point for the next leg of the bull market.
Let's dive into the latest developments, technical analysis, and market sentiment surrounding XRP — and why some believe "this is just the start."
XRP Price Overview: Current Positioning
As of early August 2025, XRP is trading around the $2.85 mark, down from its recent high near $3.70. While this pullback may concern short-term traders, technical analysts argue that this retracement is healthy and necessary for the formation of a higher low, a common pattern in bullish market structures.
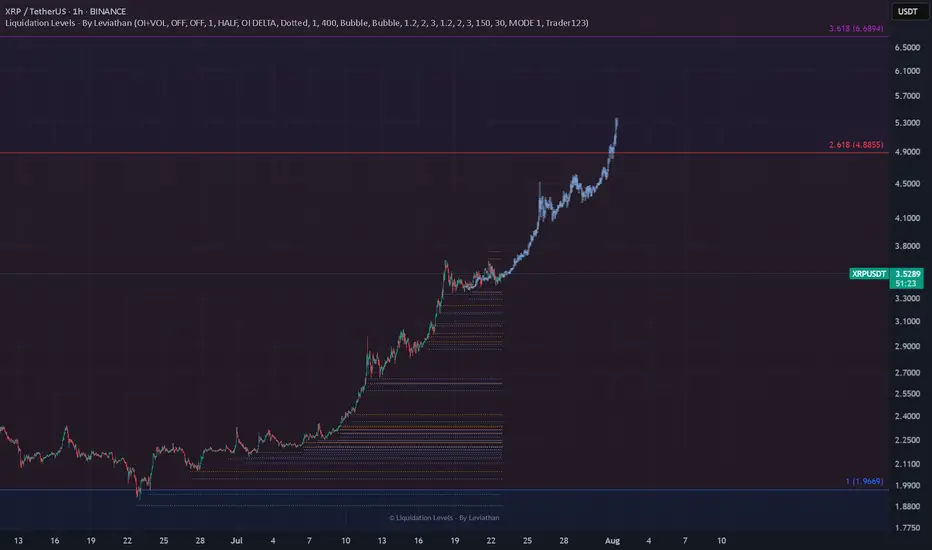
The key price levels to watch include a support zone between $2.80 and $2.95, resistance at $3.70, downside risk to $2.20 if $2.80 fails, and upside targets of $5 in the short term and $15 in the mid-term.
Why $2.80 Is So Important
The $2.80 support level is emerging as a make-or-break price zone. It aligns with multiple technical indicators including the 0.618 Fibonacci retracement from the previous rally, the Value Area High (VAH) from recent price accumulation zones, and Higher Time Frame (HTF) structure showing consistent support around this level in recent months.
If XRP manages to hold this level and establish a higher low, it could kick off a new bullish wave, potentially targeting $5 in the short term and beyond in the medium term.
Analysts Call for $15 XRP — Is It Possible?
Several key factors support the bull case. Institutional interest continues to grow as Ripple's partnerships with banks and financial institutions support long-term utility. Legal clarity has improved significantly after years of regulatory uncertainty, with the SEC lawsuit largely resolved, removing a major overhang. Technical indicators including bullish divergence on the RSI, MACD bullish crossover, and increasing volume all support upward momentum. Additionally, as Bitcoin stabilizes, funds are flowing into major altcoins, including XRP, as part of the typical altcoin rotation cycle.
August Rally Incoming? Bullish Divergence Signals 20% Upside
Technical analysts have identified a bullish divergence forming on the daily and 4-hour charts — a classic signal that often precedes a strong move upward. This divergence appears as the price makes lower lows while the RSI makes higher lows, suggesting momentum is shifting in favor of the bulls.
If confirmed, this divergence could catalyze a 20% rally in August, potentially pushing XRP back above $3.40 and testing the critical $3.70 resistance. A clean break above this level would likely open the floodgates for further gains.
$3.70: The Gatekeeper to Higher Highs
While there's excitement around the potential for XRP to hit $5 or even $15, the path forward must first go through $3.70. This resistance level has stalled price action multiple times in 2025 and will likely serve as a psychological and technical barrier.
Two scenarios are possible: a break above $3.70 would open the door to $5 and $7 targets quickly, while a rejection at $3.70 could lead to a pullback toward $2.20, especially if $2.80 fails.
Traders Hedge With New XRP Rival: Remittix
As XRP consolidates, some traders are diversifying their holdings into Remittix (RTX), a new cross-border payments token that promises enhanced scalability and compliance tools. RTX has gained traction recently, especially among DeFi-native traders seeking alternatives to XRP's centralized development model.
Remittix highlights include strong tokenomics with a deflationary model and staking rewards, a real-world use case targeting remittance markets in Asia and Africa, and a PayFi Wallet with beta slated for launch in Q3 2025, offering seamless integration with fiat on/off ramps.
While Remittix is gaining momentum, XRP's brand recognition, liquidity, and institutional partnerships still give it a significant edge in the payments space.
XRP Price Forecast: Short-Term and Long-Term Outlook
In the short term over the next 30 days, the bullish scenario involves holding $2.80 support, breaking $3.70, and rallying to $5. The bearish scenario would see XRP lose $2.80, drop to $2.20, and consolidate.
For the mid-term outlook in Q4 2025, if the bullish trend continues and macro conditions remain favorable, XRP could target $7 to $10 by the end of the year. In a full altseason scenario, $15 is not out of reach, according to some analysts.
Key Catalysts That Could Drive XRP Higher
Several catalysts could propel XRP higher. Institutional adoption continues to expand as Ripple's partnerships, especially in the Middle East and Asia-Pacific, lay the groundwork for long-term utility. CBDC integration presents another opportunity as Ripple works with multiple central banks on developing Central Bank Digital Currencies. Any progress here could significantly boost XRP's real-world use.
ETP listings could bring new inflows as XRP may benefit from exchange-traded products in Europe and Asia, especially if more crypto-based ETFs gain traction globally. The macro environment also favors growth, with a dovish Fed, weakening USD, and rising crypto adoption all creating a fertile environment for altcoins like XRP to thrive.
Community Sentiment: Is the XRP Army Ready?
The XRP community, also known as the XRP Army, remains one of the most passionate and active in the crypto space. Social media sentiment has turned increasingly bullish, with hashtags like #XRPToTheMoon and #XRP15 trending on X (formerly Twitter).
However, analysts caution against overexuberance, noting that market cycles can be volatile and unpredictable.
Risks to Watch
While the bullish case is compelling, it's important to consider the risks. Macro-economic shocks from a sudden shift in interest rates or recession fears could impact crypto markets broadly. Regulatory setbacks remain possible — although Ripple has gained legal clarity in the U.S., future regulations in Europe or Asia could cause volatility.
Network risks from any technical issues or security breaches could erode trust and trigger selloffs. Competition from new projects like Remittix, Stellar (XLM), and other payment-focused tokens could eat into XRP's market share.
Final Thoughts: Is XRP Set to Explode?
With XRP hovering near a critical support zone at $2.80, all eyes are on whether bulls can defend this level and push the token back into an uptrend. If successful, the next moves could be explosive, with analysts forecasting $5 in the short term and potentially $15 or higher before the end of 2025.
While risks remain, the technical setup, improving fundamentals, and renewed community optimism all point toward a bullish continuation — if key levels hold.
As always, investors should stay informed, manage risk, and avoid emotional decisions in this fast-moving market.
Summary
XRP currently trades around $2.85 with key support at $2.80 and major resistance at $3.70. Short-term targets point to $5 while mid-term projections suggest $10 to $15 is possible. Downside risk exists to $2.20 if support fails. Bullish catalysts include legal clarity, growing utility, and increasing adoption, while bearish risks encompass macro shocks, competition, and potential regulation.
Disclaimer
This article is for informational purposes only and is not financial advice. Cryptocurrency investments are highly volatile and involve significant risk. Always do your own research (DYOR) and consult with a financial advisor before making investment decisions.
XRPUSDT.P trade ideas
Sell setup if the sell trigger gets activated.Due to a weak trend and a rejection from the all-time high, we’ve seen a strong rejection, suggesting that the price may drop further. If the sell trigger gets activated, it could be a good opportunity to open a sell position.

XRP 4H – Critical Retest Zone + Golden Pocket BelowXRP is sitting right on its prior breakout zone after a clean rally and trendline break. This zone is acting as critical support — the same area that triggered the last explosive move. Bulls want to see a bounce here with momentum building again (Stoch RSI is curling from oversold).
If this level fails, price could retrace deeper into the Fibonacci golden pocket (2.57–2.78), where stronger demand is likely waiting. That confluence of fib levels and past consolidation makes it a high-interest area for potential long setups.
For now, this is a pivotal moment. Either we bounce here — or things get a lot more interesting below.
#XRP #CryptoAnalysis #FibonacciRetracement #GoldenPocket #BreakoutRetest #Altcoins #TechnicalAnalysis #QuantTradingPro

Ripple (XRP): Looking For Breakout and Smaller 10% PumpRipple coin has established some kind of local support zone, where we had a potential MSB to form but failed to break the area near $3.25.
Now price has cooled down and most likely will head again for another attempt to form the market structure break, so we are looking for a 10% gain right here.
Swallow Academy

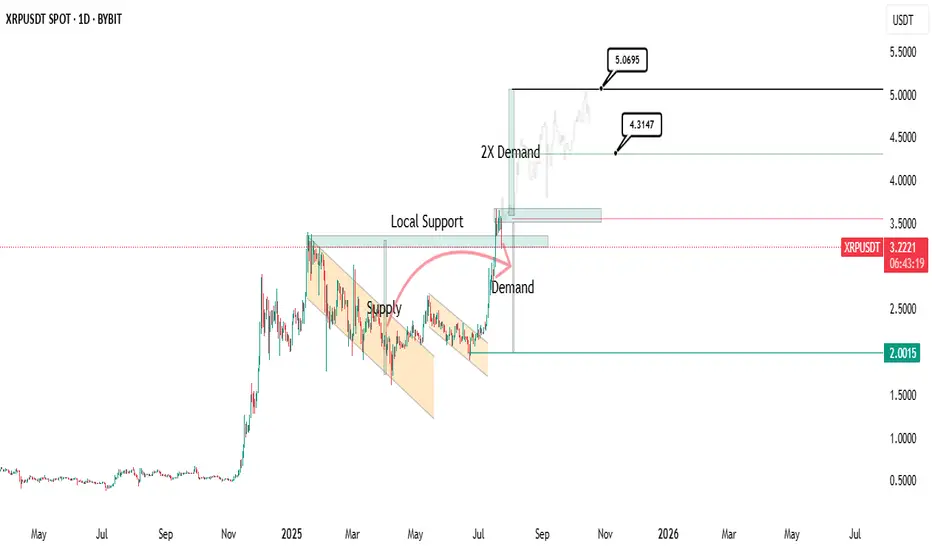
Reversal started?
it can easily 2x its demand and potentially reach $5.5 to $6 within a few weeks.
Read more at: www.cointrust.com
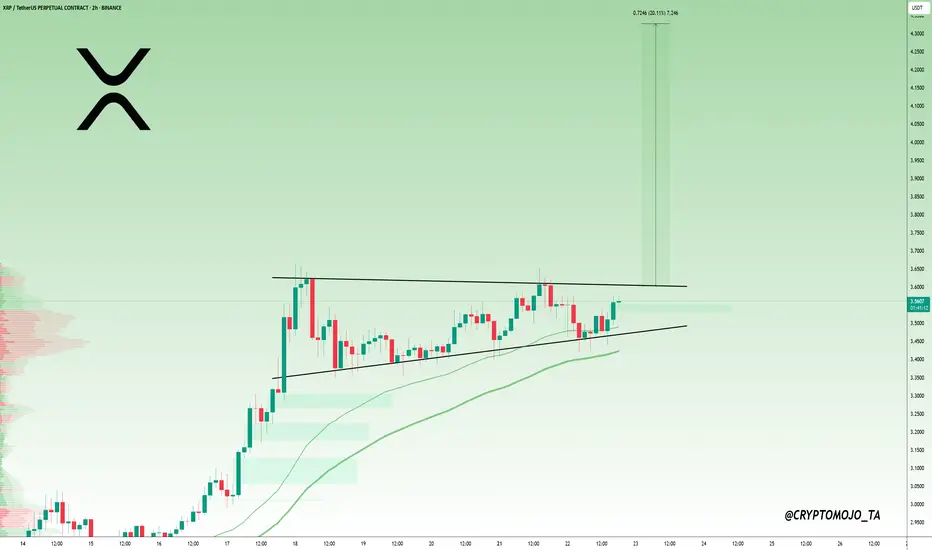
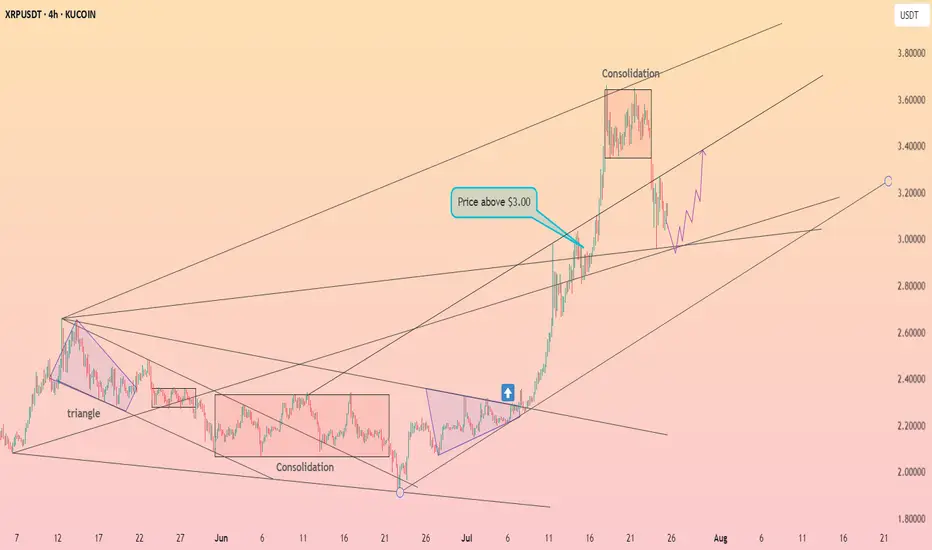
$XRP Breakout Loading, Watch That Triangle! XRP is forming a bullish ascending triangle
The price is holding higher lows while facing resistance around $3.60. This is a typical sign of buyers stepping in. If XRP breaks above this resistance with strong volume, a sharp move toward $4.30–$4.40 could follow. Until then, it’s building pressure inside the triangle. Breakout confirmation is key for the next leg up.
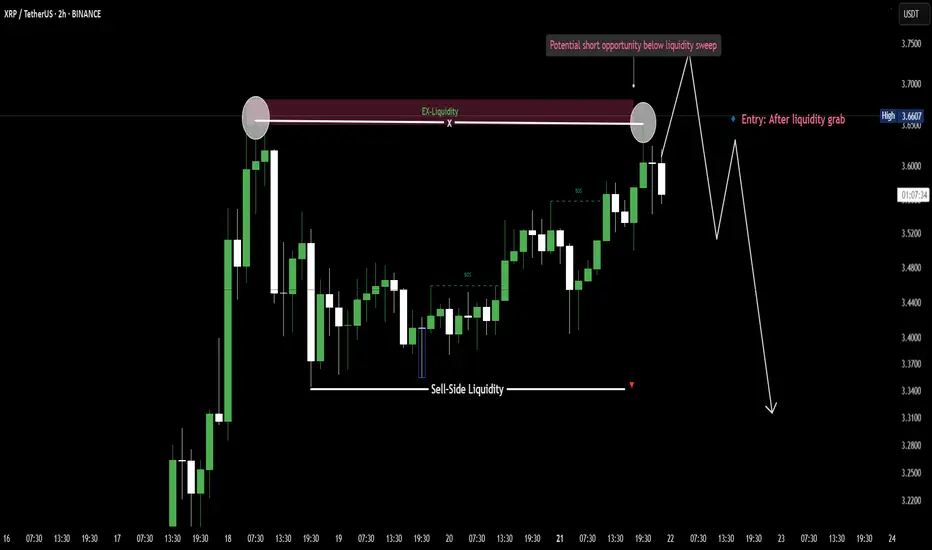
Double Top = liquidity trap?XRP formed a clear double top, tapping into external liquidity.
Price swept the highs, triggering stop hunts above resistance.
A Break of Structure (BOS) confirms bearish intent.
Expecting a sell-off toward the $$ liquidity zone below. 📉
Bullish XRP Setup: $7, $9, and $13 Main Price TargetsHello✌
Let’s analyze Ripple’s upcoming price potential 📈.
BINANCE:XRPUSDT , I expect a long-term upward bullish trend.
There are three main targets in this analysis: $7, $9, and a final target of $13, which could be reached within 2 to 6 years.
The price may form parallel channels at times, which are shown on the chart. I also expect the current bullish channel to remain valid and continue upward. Additionally, there is a strong trendline guiding the movement.
✨We put love into every post!
Your support inspires us 💛 Drop a comment we’d love to hear from you! Thanks , Mad Whale🐋
🐋Many of the points and levels shown on the chart are based on personal experience, feeling, and over 7 years of research and daily study of crypto charts.
Some of the lines, channels, and price zones are drawn to make the chart easier to understand and to help imagine possible future price movements.
I’ve also included one very big drop in price even bigger than the others because in the crypto market, it’s common for prices to suddenly fall hard and push out small investors and traders with positions.
The targets on the chart are not guaranteed; they might be reached, or they might not.📚
📜Please make sure to do your own research before investing, and review the disclaimer provided at the end of each post.

DeGRAM | XRPUSD rolls back to support📊 Technical Analysis
● After spiking to 3.56 (red dot) price slipped into a shallow bull-flag that is holding on the grey inner trend-line and the broken purple 2-year cap, converting 2.86-3.00 into firm support.
● Volatility compression inside the flag sits midway of the rising channel; a 16 h close back above 3.22 activates a 1:1 continuation toward the median-line cluster at 3.80, with the outer rail still pointing to 4.00.
💡 Fundamental Analysis
● CME’s launch of micro-XRP futures and fresh US exchange relistings lifted open-interest 18 % w/w, while Coinglass shows $12 M shorts liquidated since Monday—evidence of renewed upside pressure.
✨ Summary
Buy 3.05-3.22; breakout over 3.22 aims 3.80 → 4.00. Invalidate on a 16 h close below 2.86.
-------------------
Share your opinion in the comments and support the idea with a like. Thanks for your support!

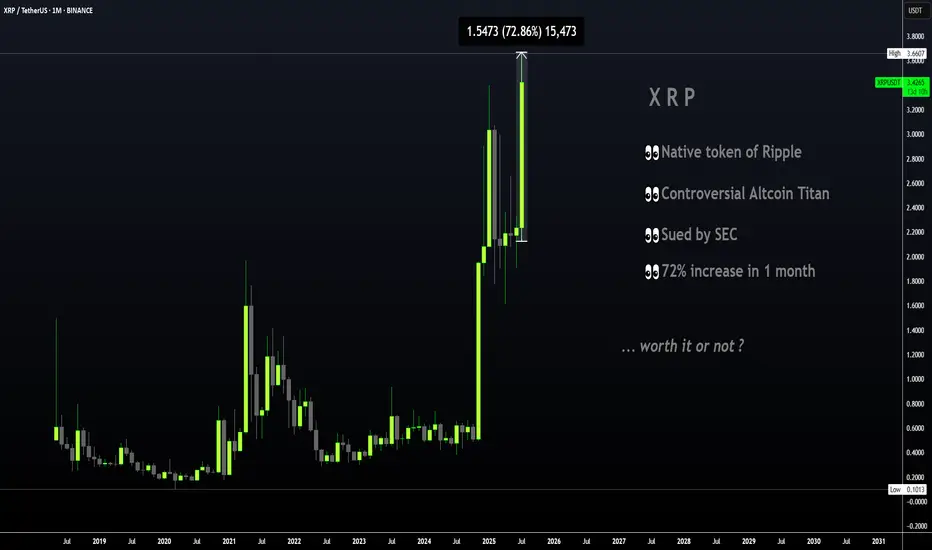
XRP | Great TP Zone is HERE for HODLERSXRP has seen a 62% increase since breaking out above the moving averages in the daily timeframe.
The previous time XRP broke out above the moving averages in the daily, the price increased around 440%:
However, with XRP being the ultimate pumper and dumper, I'll take my chances at 62%! Because this bull run has been anything but ordinary and it's best to avoid being too greedy. The price of XRP falls extremely quick, just as quick as it rises.. ( Maybe not overnight but you know, it has happened before ).
If you're one of few who bought around $1, or heck even later at $2, this is a solid increase and it should not be taken for granted. XRP has gone LONG periods without increases and often stayed behind making new ATH's when other cycles have come and gone (twice), as other alts make new ATH's. Over the years, I've made extensive posts on XRP; documented its use case, followed the SEC case closely and yet, XRP still remains one of the strangest and most unpredictable alts I have ever tried to analyze. Long term followers will remember that a I was bullish in 2018/2019 and then slowly became uninterested up until the point of negative towards XRP for probably the past 3-4 years.
This is not only because of the lagging price compared to other older alts that soared like ETH and even Litecoin. Sure we did not see the growth and the taco stand ( who remembers ) just kept dumping on the market... But the entire "scandal" of the actors marketing/pimping, the dumping behind the scenes by executives to fund Ripple in early days, the lawsuit etc. was just such a colossal mess that I even wonder how XRP is still alive and kicking today.
All I'm saying is that this is truly a spectacular moment - it's hard to even imagine cripple crossed $3 after years and years of waiting on XRP when other alts x1000% and beyond. Point being - Don't miss it! Trading only works when you take profits.
________________________
BINANCE:XRPUSDT
#XRP Update #3 – July 18, 2025#XRP Update #3 – July 18, 2025
XRP has surged roughly 28% in its latest impulsive move. Naturally, we now expect a correction phase. Potential retracement levels are:
Level 1: $3.30
Level 2: $3.20
Level 3: $3.10
Pullbacks to any of these levels should not be alarming — they are typical and healthy corrections.
I plan to go Long if XRP bounces from the first correction zone. However, at the moment, I’m just observing, as the current signals are not strong enough to justify entry.
It’s also important to note that there are heavy whale sell orders between XRP’s current price and the $4.00 zone. Breaking through this resistance will likely require strong buy-side volume from large players. Caution is advised.

XRP ~ Is this a best trade to take?XRP ~ This beauty is best to be buys at the red nd aim for the greeens!
The More You Believe You Know The More You LoseThe moment you see your first green position something changes Suddenly your brain convinces you you’ve got this But the market doesn’t punish bad traders it punishes the ones who think they’re too good to lose
You don’t lose because you’re unskilled
You lose because you believe you’ve mastered the game
Hello✌️
Spend 3 minutes ⏰ reading this educational material.
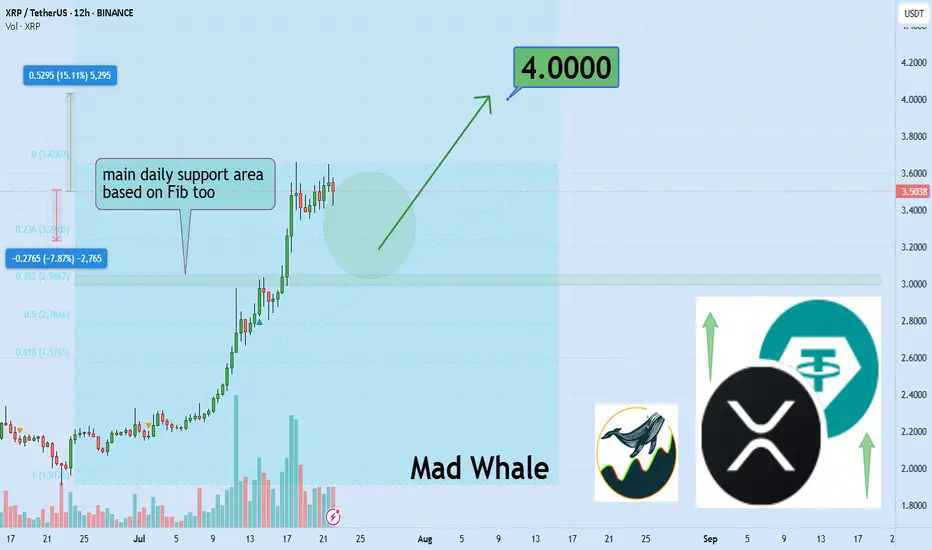
🎯 Analytical Insight on Ripple:
BINANCE:XRPUSDT remains undervalued at current levels, showing strong volume near a key daily support zone that aligns closely with a major Fibonacci retracement. This confluence suggests a potential shift in momentum. If buyers hold this level, a move toward the $4 area is on the table, representing an estimated 15% upside. 📈 Watch for confirmation through sustained volume and price reaction at support. ⚡
Now , let's dive into the educational section,
🎯 The Confidence Trap
One of the most dangerous mental states for a trader is early victory That moment after a couple of green trades when you start feeling like you’ve figured the market out That’s when the market does to you what you used to do to clueless beginners
From that point forward your decisions aren’t based on analysis they’re based on this thought
I already know how this works.
🧠 How Your Mind Tricks You
You win once Your brain says “Told you you’re good”
You win again It says “Go heavier now”
You lose It says “Fix it now You’ve done it before”
This cycle leads to overtrading and emotional revenge You’re no longer trading the market you’re defending the version of yourself you believe you’ve become
🔄 The Market Doesn’t Send Signals It Sends Lessons
When the market moves against you it’s doing the right thing It’s breaking down your ego so you can finally start seeing the chart for what it is not what your confidence wants it to be
🧱 Experience Can Kill Learning
Many failed traders are not beginners they’re the ones with years of bias built up At some point they stop learning Every chart starts looking the same That’s when their final trade shows up
🕳 The Ego Pitfall
If your mind tells you “I know this” it’s time to be extra cautious That means you’re trading with a rigid mindset And in crypto markets the rigid get destroyed
📉 High Leverage = High Confidence = High Risk
Nobody gets reckless on 2x leverage But once you start feeling pro you go 20x 50x or more And when the market flips the same ego that won you your first big gain is the one that wipes out your entire account.
📊 How TradingView Tools Can Save You
In this mental trap three tools from TradingView can seriously help
Replay Bar Tool
Go back in time and relive previous market conditions This tool shows you exactly where your bias failed and where your overconfidence blinded you It helps kill that false feeling of mastery
OBV (On Balance Volume)
A simple yet powerful volume indicator If price rises but OBV is falling the uptrend is fake If price drops but OBV is climbing sellers are weak and a reversal might be near This gives volume context beyond candles
Volume Spike
Watch out for sudden surges in volume If volume explodes but price barely moves someone big is moving in silence It’s often the prelude to fakeouts traps or major directional shifts These spikes scream pay attention
Risk-to-Reward Tool
Don’t let your “confidence” make you forget basic math This tool gives you the true ratio of what you’re risking versus what you’re chasing It doesn’t care how good you feel it shows you if the trade makes sense
🧊 Humility Is the Only Edge That Lasts
Humility means accepting you might always be wrong It means checking yourself with objective tools It means saying “maybe” instead of “definitely”
It means lasting longer than the rest
🔚 Final Words
If you’re sure you’ve mastered the market pause The best traders second-guess themselves often not because they’re weak but because they know confidence fades but risk never does
✨ Need a little love!
We pour love into every post your support keeps us inspired! 💛 Don’t be shy, we’d love to hear from you on comments. Big thanks , Mad Whale 🐋
📜Please make sure to do your own research before investing, and review the disclaimer provided at the end of each post.
Ripple (XRP/USDT) Analysis – 4H🚀 Ripple (XRP/USDT) Analysis – 4H
Hello everyone,
Today I want to analyze Ripple (XRP). I hope you find this analysis useful and share your thoughts in the comments.
The following analysis is based on MWC (4H).
📢 Quick Overview of Key Ripple News:
• $759M transfer by XRP whales, indicating heavy behind-the-scenes activity that could signal a major price move.
• This large transfer could be a sign of Accumulation or preparation for high volatility.
Our main focus to maintain the bullish scenario should be on btc.d and usdt.d charts.
♦️ Btc.d ♦️
After the heavy drop in the past week, Bitcoin dominance started correcting yesterday.
The levels I expect reactions from are:
61.31 (already broken),
Next levels 61.74 and 62.17 (currently testing).
A breakout and stabilization above these levels will put altcoins under strong selling pressure.
However, a rejection at these levels will bring attention to altcoins close to breaking their zones.
♦️ Usdt.d ♦️
This chart also shows signs of forming a bullish structure.
We need to watch for a reaction to the next important zone 4.44 – 4.36.
But for altcoins to continue their uptrend, 4.14 must break downward.
♦️ Others.d / Total / Total2 / Total3 ♦️
These charts are naturally bearish.
Before their support levels matter, we should focus on the potential reversal of btc.d and usdt.d.
These give earlier signals of correction continuation or completion.
We can use Total, Total2, Total3, and Others.d for confirmation.
Important levels:
Total: 3.91
Total2: 1.55
Total3: 1.08
Others.d: 8.05 (for now), but if the correction ends and a bullish move starts, we may see a lower high forming.
♦️ XRP ♦️
Currently, a breakout above 3.65 is the entry trigger.
The more likely bullish scenario: create a new high → minor correction → breakout = entry signal.
This will happen if Bitcoin dominance drops.
According to our strategy, both the market and XRP are in a bullish structure.
I will not consider short positions, even if XRP falls to 2.66.
Considering the strong seller activity at 3.65, I expect the breakout to be sharp and whale-driven.
Thus, there are two ways to enter:
1. After forming a new high and low, enter upon candle close and confirmation around 3.33.
2. If we miss the move, enter with a STOP BUY at 3.6.
In both cases, if the scenario is activated, Stop-Loss = 2.92.
🔥 If you found this analysis useful, hit the 🚀 and follow me for more updates!

XRPEarly Pullback Potential:
Given the overbought RSI (76.45-89.52) and recent 3% price swings, a slight pullback early in the day is plausible, especially during lower-volume pre-market hours before the New York open (8:00 AM EDT). Key support levels to watch are $3.05 (immediate support) and $2.95 (20-day EMA). A drop to $2.90-$2.95 is possible if profit-taking intensifies, as suggested by declining volume and bearish MACD signals.
Pump on New York Open : The New York market open often brings increased liquidity and institutional activity, which could trigger a price pump. XRP’s recent correlation with bullish market sentiment (Fear & Greed Index at 74, Greed) and high futures open interest ($9.25B) supports potential upside. A breakout above $3.25 could target $3.30-$3.50

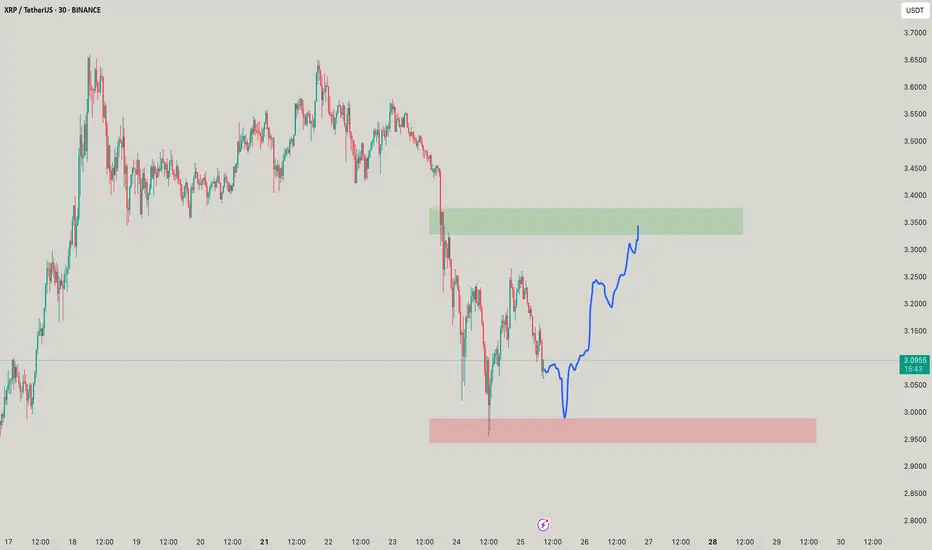
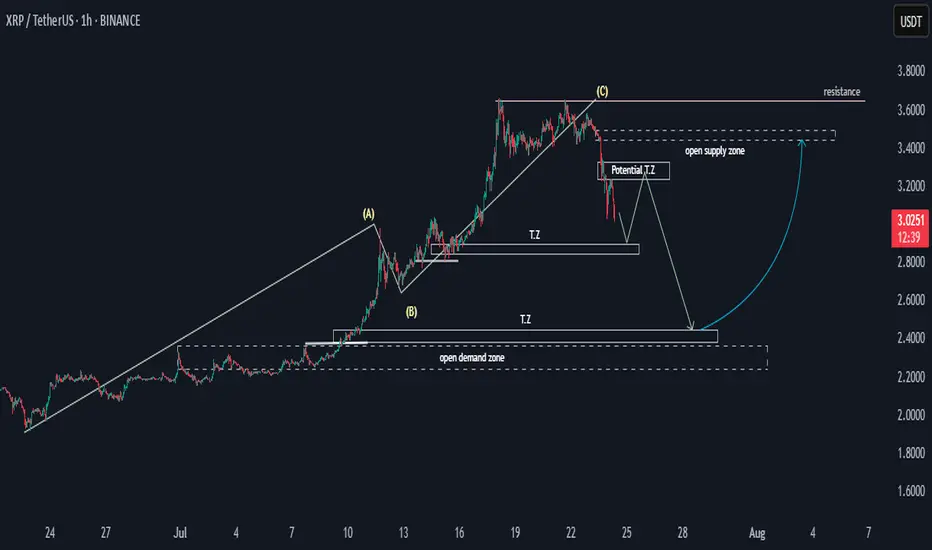
XRP Potential SND Flow MapHello,
This is a general overview of the XRPUSDT flow map, outlining potential price movements.
The price may experience a decline, followed by a pulse upwards before a final drop. Target zones have been identified, and following this, there is a possibility for the price to rally toward the 3.4 supply zone. This would establish the 2.4 to 2.2 range as a key potential bullish zone.
Happy Trading,
Khiwe.
Not trading advice
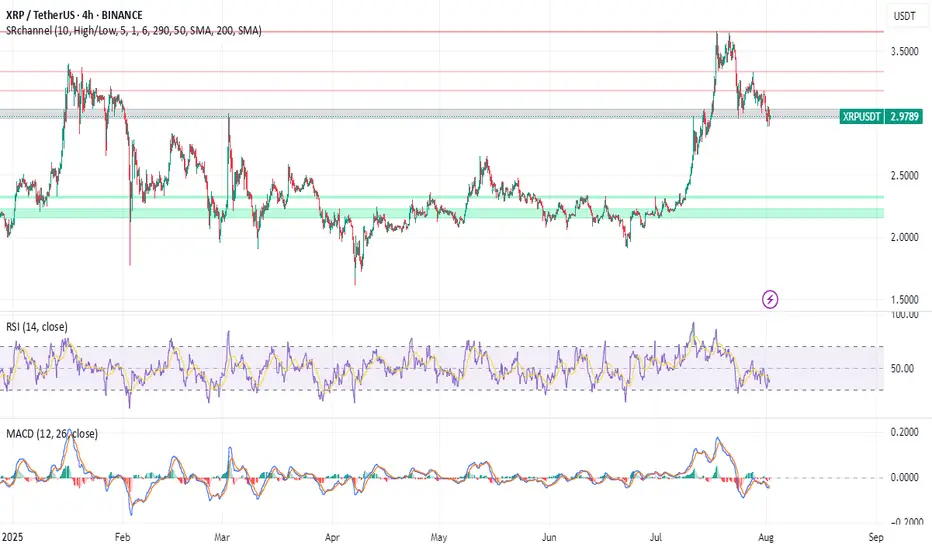
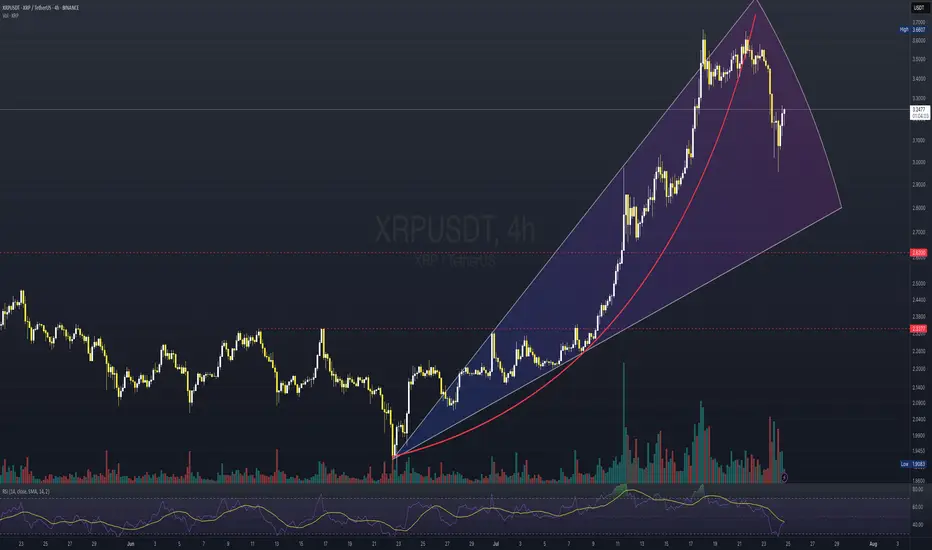
XRP - in the future is room for pastThe chart of XRP/USDT on the 4-hour timeframe reveals a classic example of a parabolic rise within a well-defined ascending channel, which has recently been broken to the downside. The price rallied strongly, forming higher highs and higher lows, supported consistently by the curved trajectory of a long-term trendline and multiple short-term moving averages. However, the steepness of the ascent, culminating in a local high around 3.66, appears to have exhausted momentum.
Following the peak, a sharp correction has taken place, breaching both the dynamic support and the lower boundary of the rising wedge structure. This breakdown signals a potential shift in market sentiment. The recent rebound seems more like a temporary relief or dead-cat bounce rather than a decisive reversal.
From a broader perspective, this move appears to be part of a larger cyclical retracement—where price may revisit and test previous high levels (now flipped into potential support) around the 2.62 and 2.33 zones. These levels are historically significant and could serve as key areas for demand reaccumulation in a longer-term bullish continuation, assuming macro conditions remain favorable.
In essence, while the immediate trend shows weakness, the larger structure still supports a healthy market correction. A return to prior resistance-turned-support would not only be expected but potentially constructive for sustainable future growth.
Comprehensive Analysis: SHORT Signal on XRPUSDT1. News Analysis (Market Sentiment)
The news actually reflects a strongly positive sentiment for XRP’s long-term fundamentals:
"Brazil's VERT Debuts Tokenized Credit Platform on XRP Ledger With $130M Issuance" : This is a very bullish piece of news. It highlights real-world adoption of the XRP Ledger (XRPL) for high-value transactions.
"VERT Launches Blockchain Platform on XRPL for $130M Deal" : This is the same news reported by a different source, confirming the significance of this adoption.
Bridging the Analysis:
Here lies the crucial difference between investors and traders. As long-term investors, this kind of news would motivate us to buy and hold XRP. But as day traders, we understand the common market behavior of “Buy the Rumor, Sell the News.”
The massive price rally before this announcement might indicate the market already anticipated this news. Now that the news is official, early buyers may begin taking profits, triggering selling pressure.
Sentiment Conclusion:
While the news is fundamentally positive, it could strengthen the case for a SHORT position in the short term. This “sell on good news” reaction is a common phenomenon in trading.
2. Technical Analysis (Chart Structure)
The daily chart of XRPUSDT supports a SHORT position even more convincingly:
Climactic Top Rejection : A sharp price rally ends with a long upper wick candle around the $3.60 area. This is a classic sign of buyer exhaustion and aggressive seller entry.
Short-Term Bearish Structure : A large red candle formed after the top, signaling that sellers have taken control. The current price is trading well below that top, confirming the rejection was valid.
Room for Correction : Below the current price, there’s a clear “gap” or market inefficiency. The first logical target for a correction is around $2.80 - $2.90, where the 50 EMA meets the upper edge of the Fair Value Gap (green box). This gives us a clean profit target.
Combined Conclusion:
Yes, based on a combination of “Sell the News” sentiment and clear bearish technical structure, the argument for a SHORT position on XRPUSDT is very valid. We are going against the positive headlines, but following price action signals.
Trading Plan: SHORT Operation on XRPUSDT
Position: SHORT
Asset: XRPUSDT (Perpetual Contract)
Current Status: ENTRY
Entry Reason:
We’re entering based on short-term bearish momentum after a strong rejection from the supply zone, expecting the price to fill the inefficiency below.
Entry Type: Market Order
Why: The bearish move is in progress. We want to catch it now before the price drops further and skips our limit order. We'll execute at the current market price (~$3.01).
Stop Loss (SL): $3.62
Why: Placed slightly above the previous swing high. If price breaks this level, our SHORT thesis is invalid, and we exit to prevent further losses.
Take Profit (TP) Targets & Risk/Reward:
We'll scale out profits in phases to lock in gains.
TP1: $2.85
Why: Confluence of 50 EMA and top of Fair Value Gap
Risk/Reward: ~1:2.8 (Risking $0.61 to gain $1.75 — very healthy ratio)
TP2: $2.55
Why: Mid-point of the Fair Value Gap — a common magnet for price
TP3: $2.25
Why: Full gap fill + retest of prior support/resistance area
TP4: $1.85
Why: Ambitious target — filling the second, deeper Fair Value Gap. Possible in a panic-driven selloff.
Position Management:
Once TP1 is hit:
Move SL to Entry ($3.01) to secure a risk-free trade on the remaining position.
We’ll continue to monitor the price and adjust the trailing stop loss as each TP level is reached.

XRP stays above $3 ┆ HolderStatBYBIT:XRPUSDT is printing higher lows into the $3.44 resistance. Breakout could activate $3.60 target. Watch $3.30–$3.28 for possible pullbacks. Bullish pressure mounting.
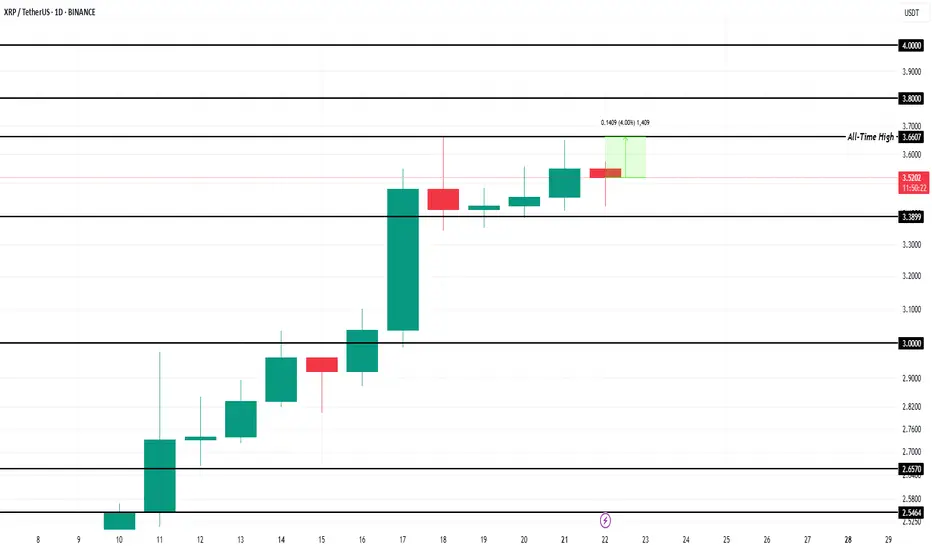
XRP Price Reversal Likely After $2.81 Billion Selling In 7 DaysBINANCE:XRPUSDT is currently trading at $3.48, only 4% away from its all-time high . Over the past week, exchange wallets saw an influx of nearly 450 million XRP, valued at more than $2.81 billion . This spike in supply indicates that holders are moving their assets to sell, usually a bearish indicator in market cycles.
Despite the proximity, BINANCE:XRPUSDT price is showing signs of weakness and is clinging to the $3.38 support level . Without renewed buying interest, this support may not hold much longer.
If investor selling continues, BINANCE:XRPUSDT could fall through $3.38 and test the $3.00 support . A drop to this level would erase the recent gains and confirm a near-term bearish reversal. The loss of $3.00 could signal a longer consolidation phase or deeper correction.
However, if market participants absorb the sold supply and restore demand, BINANCE:XRPUSDT could rebound quickly . In this scenario, the altcoin might surpass $3.66, breach $3.80, and aim for $4.00 . Such a move would invalidate the bearish outlook and set a new all-time high.
Is this a Bull Flag forming on the XRP daily timeframe?Although sentiment for XRP is strong and recent trend has been sharply upwards. I'm wondering if this is a bear flag forming on the daily?
Given the sharp rise it could be and may not be a negative signal as it could give the opportunity for a healthy pull back before rising again to new all time highs.
Let's watch how it progresses over the next few days. I will not be jumping into a trade until it confirms.

XRP is heading toward $4 ┆ HolderStatBYBIT:XRPUSDT is testing $3.40 for the third time. A breakout targets $3.60, but rejection risks $3.10 fallback.

XRP TRENDXRP is following the same pattern.
Following Trend as well.
Final Target 6-8 USD maybe 10-12 USD