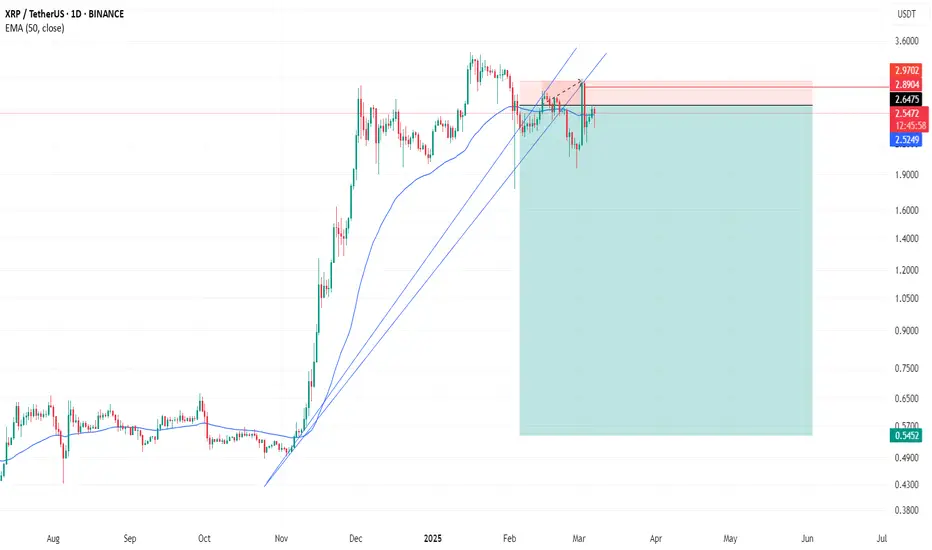
XRP - Do NOT Fear The Dip - This Is Where To BUY MartyBoots here , I have been trading for 17 years and sharing my thoughts on BINANCE:XRPUSDT here.
BINANCE:XRPUSDT is looking beautiful , very interesting chart for more upside and dips into support are buys
Do not miss out on BINANCE:XRPUSDT as this is a great opportunity
DO NOT FEAR THE DIP
Watch video for more details
XRPUSDT.P trade ideas

XRP Holds Strong—Will It Break Out or Break Down?The crypto market is feeling the pressure from institutional dominance, and WHITEBIT:XRPUSDT is no exception. However, despite the uncertainty, XRP has managed to hold a key support level. With rising speculation around XRP as a potential U.S. reserve asset, will we see a bullish reversal, or is a deeper correction ahead?
🔹 XRP Demand on the Rise – The approval of a Bitcoin strategic reserve has fueled speculation about XRP following suit. This narrative could be supporting the price above the key $2 level.
Head & Shoulders Pattern—Bearish Breakdown Ahead? ⚠️
📉 XRP has reached the neckline of a head & shoulders pattern, a classic bearish setup. If this plays out, a breakdown could see prices dropping to $1.5.
📊 Supertrend Indicator is flashing bearish, signaling growing downside risks.
📌 RSI Shows Bullish Divergence – While still below the descending trendline, a breakout could flip the momentum.
Key Levels to Watch
✅ Support: $2.00 – A break below could accelerate losses to $1.50.
🚀 Resistance: $2.50 – A breakout could send XRP toward $2.80 and beyond.
Despite short-term uncertainty, XRP remains a strong player, having surged 336% since Trump’s victory. Will the bulls step in, or are we in for more downside? The next move could be crucial!

Bullish Flag Formation on XRP – A Rally to $4 in Sight?
BINANCE:XRPUSDT BITSTAMP:XRPUSD has been in a corrective phase after reaching its recent highs, forming what appears to be a bullish flag pattern. This structure suggests that the asset is consolidating before its next potential leg upward. The price has been repeatedly rejecting the support zone between $1.70 and $2.00, strengthening the case for this area acting as a key accumulation zone.
An optimal entry could be around the $1.70 level, as it aligns with the lower boundary of the support range and the pattern’s validation zone. If XRP manages to break out of the flag structure, the projected move based on the flagpole extension suggests a target of $4.00, offering a compelling risk-to-reward setup.
To confirm the trade before entering, traders could look for a structural shift in lower timeframes, such as a break in the current downtrend or strong bullish volume. If the pattern plays out as expected, this could set the stage for the next explosive move in XRP.
👨🏻💻💭 Will this bullish flag deliver? Time will tell, but the setup looks promising!
__
The information and publications within the 3Commas TradingView account are not meant to be and do not constitute financial, investment, trading, or other types of advice or recommendations supplied or endorsed by 3Commas and any of the parties acting on behalf of 3Commas, including its employees, contractors, ambassadors, etc.

XRPUSDT soon can dump below 2$ As we can see on daily chart we the head and shoulders is forming and if the support of this head and shoulders break which is 1.95$ support zone then heavy dump will lead and we are looking for at least -50% dump from here and targets like 1.5$ and lower and maybe after that if the support hold then 5$ is also expected.
DISCLAIMER: ((trade based on your own decision))
<<press like👍 if you enjoy💚

Lingrid | XRPUSDT Head and Shoulders Pattern: Bearish Signal?BINANCE:XRPUSDT is currently making lower lows and lower closes. The market took liquidity above the 2.80 level before pulling back to the support level at 2.00. This movement essentially created a false breakout, suggesting that buyers are hesitant to enter the market at those price levels. Taking a broader view, we can observe that the price action is forming a head-and-shoulders pattern, which is typically indicative of a reversal. Given that the previous weekly candle was a significant bearish candle, it suggests that the price may retest the 1.50 level. Therefore, I anticipate XRP to retest the resistance followed by moving lower. My goal is support zone around 1.63
Traders, if you liked this idea or if you have your own opinion about it, write in the comments. I will be glad 👩💻

Will Ripple break the trendline or face another 24% drop?Hello and greetings to all the crypto enthusiasts, ✌
In several of my previous analyses, I have accurately identified and hit all of the gain targets. In this analysis, I aim to provide you with a comprehensive overview of the future price potential for Ripple , 📚💡
There is a potential for upward candles to form as part of the final phase of the current bearish trend, but a further decline from this point remains a significant possibility for Ripple. I anticipate an additional drop of at least 24% in the market, with the primary target price at $2. The bearish cycle continues to unfold, with the price losing critical support levels along the way. If Ripple fails to break through the strong daily trendline, the downward momentum is likely to persist, bringing the price to the projected target.📚🙌
🧨 Our team's main opinion is: 🧨
Ripple might see a brief upward movement, but I expect at least a 24% drop, with a target of $2, unless it breaks the key daily trendline, as the bearish trend continues.
Give me some energy !!
✨We invest countless hours researching opportunities and crafting valuable ideas. Your support means the world to us! If you have any questions, feel free to drop them in the comment box.
Cheers, Mad Whale. 🐋

Ripple (XRP): Looking For 17% Pump - Then 35% DUMP!As always, we are looking for a selling position on the XRP coin, where, first of all, we need to see some proper upward momentum to normalize the price; after that, our target is going to be the 200 EMA on a 1D timeframe!
More in-depth info is in the video—enjoy!
Swallow Team

Ripple (XRP): Looking at Daily 200EMA / Might Fall MoreRipple coin had a nice dip but it's not quite what we want to see. We are expecting to see a further movement here to lower zones towards the daily timeframes 200EMA!
More in-depth info is in the video—enjoy!
Swallow Team

Ripple (XRP): Looking For Fill of Bearish CMERipple caught our attention with an unfilled bearish CME gap where we have recently filled the bullish one.
Now we are looking for either a breakout of 200EMA, which would send the price to upper zones and then we will be looking for a bearish movement from there.
Or we just fall and break down from 100EMA and instantly fill the CME gap!
Swallow Team

XRP Ripple Will Dump More, But Then We Have a ChanceHello, Skyrexians!
Yesterday morning we did a big warning that altcoins will drop again. We expected the dump on Monday, but it has been started the next hour after our post. BINANCE:XRPUSDT is not an exception and dumped with the entire market, but for this coin correction is not likely to be over.
Let's take a look at the daily chart. We can see the clear 5 Elliott wave structure inside the previous wave of growth. The bearish divergence signaled that trend is over and now it's time to fasten your seatbelt. Correction has the shape on zigzag, wave A was impulsive, wave B was ugly and now price is printing wave C, which has to consists of 5 waves as well. The target is $1.5. There we have to see the green dot on the Bullish/Bearish Reversal Bar Indicator for the potential uptrend continuation.
Best regards,
Skyrexio Team
___________________________________________________________
Please, boost this article and subscribe our page if you like analysis!

XRPUSDT 1DXRP ~ 1D Analysis
#XRP Need to maintain this level of support, Break Down from this support level will re -test the support of $1,48

XRPUSDT XRPUSDT has the possibility of long trading from the price of 1.3854 to a stop loss of 0.9947, and if it reaches this price range, it is worth a good trade.
The risk in trading is your choice.

XRP under 0.45$After a great pump seeing a deep fall for XRP.
I think taking short position is reliable.

Uptrend My last chart about XRP was failed due to wrong trendline losing chart.
Uptrend is going on.
XRP heading to around $10 in the coming 7 monthsAfter breaking the previous ath from early 2018, XRP has been consolidating in a tight range. On Feb 15th it also hit its first PI cycle top. Price will be consolidating further until the breakout in Sep 2025 and reach an ath of $10.68 which will be the second PI cycle top before the bear market starts. XRP is mimicking the run of 2017 where it had 2 PI cycle top's. From now until Sep the price will continue to fluctuate between just below $2 and just above $3. They will probably try to shake you out, instead long the bottom of the range and short the top of the range.
Inshallah.

XRP Continues To Move Within Bullish Zone (Entertainment)What one does, the rest follows. XRP continues moving within the bullish zone with a strong price. The 28-Feb low remains unchallenged and we are seeing some sideways action, a small retrace, after the last jump.
The chart is perfect. Everything is clear to me. One resistance level remains and that's $3. If you read the long-term analysis, XRPUSDT, you know this is the last barrier before the continuation of the bullish wave. I say continuation because we are bullish, the rise started in late 2024 and after this rise, XRP has been sideways. Sideways is the pause, in this pause the low has been established and we have local higher lows.
A perfectly sideways trading range. This is good. We are looking at an accumulation zone, a great price to buy for anybody that is bullish on XRP and want to see it grow. It will grow in a matter of days. Cannot say that it will grow within months, not anymore. Months is too long and more than 3 months XRPUSDT is sideways, since early December 2024. This is good, there can be more but not much more. The next rise is a long one, a strong one a big one, so it will start slow...
Let me show you the long-term analysis, it is still valid today:
The only doubt that remains valid is the All-Time High price in late 2025 or early 2026. We don't know if XRP will peak at $14, $37 or $77, what's your guess?
We know the market will grow many times more than any standard projection we make, but that's the tricky part. Since it will be something out of the ordinary, it makes it very hard to predict. If you have any tools, insider information or fundamentals related developments that can be of help share them with me, please.
Right now, we are looking at a great entry zone, great price and timing. This is a great chart setup for those trading and looking to go LONG. You know we can trade based on the long-term but also the short-term works. It will be a surprise. Today the market is quiet, tomorrow everything grows. The change can happen in a few hours or a few days, but the conclusion will always be the same; we are going up.
Time is running out. The first wave will lead to $6-$7, that is between now and May. The second wave will produce the amazing numbers and that's the one we can't predict what the final prices will be. But it will be big.
Spot: Buy and hold. Be patient, trust me.
Leverage: Do your thing. I am writing for your entertainment, I know you already know this game.
It is ok to chat for a while, but we end up winners at the end.
Let XRP grow.
We support Bitcoin, the Altcoins and everything Cryptocurrency has in store for us.
Namaste.

xrpdaily chart and 4hr chart are bullish . expecting the trend to keep going up mage your risk accordingly

Ripple (XRP)Xrp usdt Daily analysis
Time frame daily
Risk rewards ratio >1.5
Short position ↘️↘️
Bad news for Ripple investors
Head and shoulders pattern is created
So I think , maybe xrp fall down to 1.7$

XRP SHORT XRP Is making a Head&Shoulder pattern if neckline breaks as mention on chart then it will confirm a downtrend started so trade plan is mention clearly on chart .DYOR

Is a Retest of $2 Inevitable for Ripple’s Next Move?Hello and greetings to all the crypto enthusiasts, ✌
All previous targets were nailed ✅! Now, let’s dive into a full analysis of the upcoming price potential for Ripple 🔍📈.
Ripple is approaching a crucial daily resistance level, which could trigger a notable price correction. A potential decline of at least 20% is expected, bringing the price down to the trendline acting as a strong support zone. Meanwhile, the key target remains the $2 level, which aligns with a major daily support area. Given its psychological significance, a retest of $2 is highly probable before the next market move.📚🙌
🧨 Our team's main opinion is: 🧨
Ripple is nearing a major resistance, likely facing a 20% drop to trendline support, while $2 remains the key target and a strong psychological support level. 📚🎇
Give me some energy !!
✨We invest hours crafting valuable ideas, and your support means everything—feel free to ask questions in the comments! 😊💬
Cheers, Mad Whale. 🐋

XRP Wait to BuyA Head and shoulders pattern forming. I'm waiting for a breakdown to take a long trade.
Key areas I'm watching
$2 zone - I don't believe this will hold especially if we get a decent BTC dump. It has been tested too many times.
$1.8 big liquidity pool around that area could get a bounce there.
$1.6 very strong support in that zone would love to get a bit there.


XRP Trading Update – March 5, 2025The final leg of the ABC correction appears to have completed with a clear five-wave decline into liquidity. Price has now breached Wave 4, confirming a Break of Structure (BOS) and signaling a shift in the state of delivery.
With BOS established, we now focus on the impulse leg upward, which not only breaks structure but also aligns with a 2 standard deviation expansion—our projected target zone.
Trade Parameters:
Entry: 2.41 USDT
Stop Loss: 2.14 USDT (-11.34%)
Target: 4.00 USDT (+68.52%)
Risk-to-Reward Ratio: 5.79R
Market Outlook:
The Breaker Block retest would have been the ideal zone to re enter for continuation.
A strong reaction from this level confirms strength for further upside.
Failure to hold the breaker structure will invalidate the bullish scenario.
This is a high R:R setup—execute with precision, manage risk, and let price do the work.
Let’s ride the wave to 4.00 USDT! 🚀
LordMEDZ
