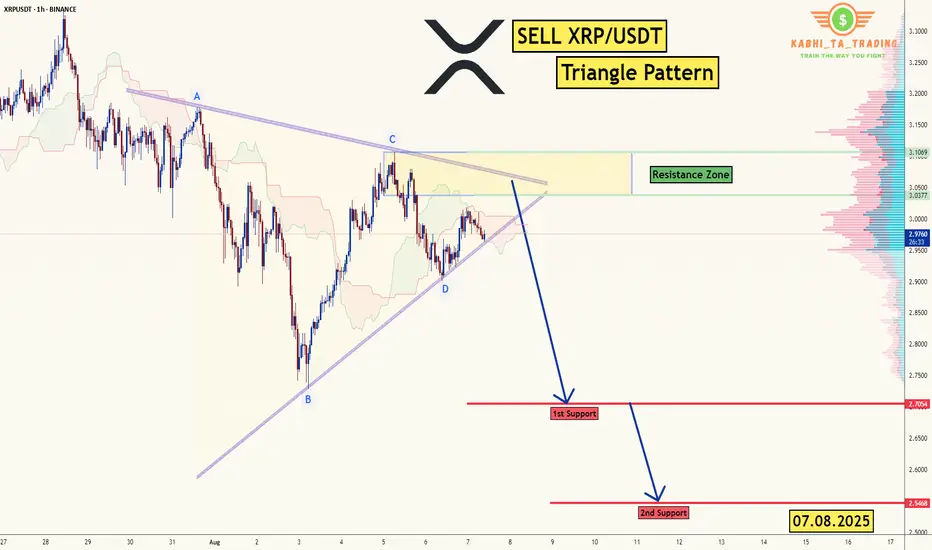
XRP/USDT -H1 - Triangle Breakout (07.08.2025)The XRP/USDT Pair on the H1 timeframe presents a Potential Selling Opportunity due to a recent Formation of a Triangle Breakout Pattern. This suggests a shift in momentum towards the downside in the coming Days.
Possible Short Trade:
Entry: Consider Entering A Short Position around Trendline Of The Pattern.
Target Levels:
1st Support – 2.7054
2nd Support – 2.5468
🎁 Please hit the like button and
🎁 Leave a comment to support for My Post !
Your likes and comments are incredibly motivating and will encourage me to share more analysis with you.
Best Regards, KABHI_TA_TRADING
Thank you.
XRPUSDT trade ideas
XRPUSDTHello Traders! 👋
What are your thoughts on RIPPLE ?
On the XRP chart, we can see that after breaking the descending trendline and reaching a resistance level, the price has entered a corrective phase.
We expect this correction to continue down toward the support zone, which coincides with the ascending trendline. This area also represents a pullback to the previously broken bearish trendline.
Once the pullback is complete, we anticipate a bullish continuation toward higher targets.
Don’t forget to like and share your thoughts in the comments! ❤️

XRPUSDT - Time to be bearish!!Did you know that the XRP chart has turned bearish and is looking pretty grim?
A lot of indicators are pointing in that direction right now.
It recently formed a triangle pattern, broke out, rallied, and hit a new ATH — which coincided with the fifth and final wave of the Elliott Wave impulse.
Now it has shifted into an ABC corrective structure, and wave B seems to have completed, setting the stage for the main corrective move with wave C, which is expected to deliver around a 30% pullback from this point.
Another red flag for me is that XRP barely managed to break into a new ATH, only to quickly reverse and is now retesting the previous ATH, which lines up with the 1.00 Fibonacci level. Based on this, I strongly expect a major correction in XRP from here.
Sure, a lot of die-hard XRP believers won’t like this take — but let them ride it down. You can always buy back cheaper, my friend.
take a look to this post
As I told you earlier in a previous post, I recommended buying it at that time(3 months ago), which was the perfect entry. It has now risen by 50%, so I’m telling you to sell if you still hold it.
Best regards:
Ceciliones🎯

Lingrid | XRPUSDT Potential Trend ContinuationThe price perfectly fulfilled my previous idea . BINANCE:XRPUSDT is holding above the 3.1500 support zone after a clean rebound from the ascending trendline, signaling a bullish continuation setup. The structure remains intact with higher lows, and the next major objective lies in the 3.8000 resistance zone. A breakout above 3.4000 could open the way for accelerated upside movement. Trend bias remains bullish while price holds above key support.
📉 Key Levels
Buy trigger: Break above 3.4000
Buy zone: 3.1000–3.2000
Target: 3.8000
Invalidation: Drop below 3.000
💡 Risks
A breakdown under 3.0000 could shift trend to bearish
Resistance near 3.8000 may cause sharp rejection
Broader market weakness could limit upside
If this idea resonates with you or you have your own opinion, traders, hit the comments. I’m excited to read your thoughts!

Pump Always Comes, After You’re Too Tired To HoldHave you ever felt the market is deliberately tiring you out?
The moment your hope runs out is when the real flight begins.
This analysis explains why market makers change the game exactly then.
Hello✌️
Spend 2 minutes ⏰ reading this educational material.
🎯 Analytical Insight on Ripple:
BINANCE:XRPUSDT is showing strong volume with a respected daily trendline and nearby support. If this zone holds, price could rally about 17% toward 3.70 USD. 📈💹
Now , let's dive into the educational section,
🎯 Big Picture of the Market Maker’s Game
The market is never just a single candle up or down. Its moves are filled with swings designed less for short term gains and more for managing your emotions. Market makers know that 70% of traders think alike. When they see some profit they fear losing it and when they face some loss their patience fades. That exact weakness is their golden opportunity.
This is not random and it is not luck. Behind every long range or sharp fluctuation lies a clear goal. Collecting liquidity and pushing the weakest hands out. Once most people are caught on the wrong side the market maker takes the biggest profit with the least effort.
⏳ Wearing Down Investors
The market maker is a master of time manipulation. They can hold price in a narrow range or dull sideways move where neither strong rallies nor deep drops happen. This slow bleed in excitement causes small traders to withdraw their money one by one.
Every day this continues hope fades and doubt grows. By the time most decide to exit the market is primed for a move they will not be part of.
📉 Stop Loss Hunting in Price Swings
Stop loss placement is vital for traders but to a market maker it is a treasure map. They know most stops are just below recent lows or above recent highs. With a few intentional pushes in price they trigger these stops and collect the liquidity.
This can happen multiple times in one trend each time pushing more traders out and clearing the way for the next move.
🎯 Targeting Leveraged Traders
High leverage traders are like low hanging fruit. Even a small move against their position can cause forced liquidations or margin calls. Market makers exploit this by moving price briefly against the crowd several times flushing them out.
This not only removes a large chunk of opposing positions but also makes it easier to drive the price strongly in the desired direction with minimal resistance.
💧 Building Liquidity
Liquidity is the fuel for major market moves. Without it a big push in price is costly and risky. To create it market makers need traders to buy or sell in large volumes. Stop hunts exhausting investors and shaking out leveraged players all feed this goal.
Once there is enough volume stacked on one side they flip the market hard taking the big profit while the majority has either exited or is trapped in the wrong direction.
📊 TradingView Tools to Spot the Market’s Mind Games
To see this game more clearly TradingView has tools that directly help you.
Volume Profile lets you identify price zones with the most traded volume which are prime hunting grounds.
Liquidity Zones Drawing helps you mark liquidity pockets to predict the next hunt.
Replay Tool lets you rewind past trends and find moments where stop losses were targeted.
Relative Strength Index (RSI) shows that multiple touches in overbought or oversold with sideways price often means a hunter is at work.
Alerts Customization allows you to get notified when price nears key liquidity zones.
Practical use. Open the BTCUSDT chart run a Volume Profile to find high volume areas mark liquidity zones then use Replay Tool to see how often the market hit those zones before a major move. This drill trains your eye to avoid becoming prey.
Summary
The market never moves in a straight painless path. Every swing trap or sideways grind has a purpose. If you understand these moves as part of the market maker’s plan to gather liquidity you can position yourself where others give up and join the move when it truly starts. Patience and pattern recognition are your sharpest weapons.
✨ Need a little love!
We pour love into every post your support keeps us inspired! 💛 Don’t be shy, we’d love to hear from you on comments. Big thanks, Mad Whale 🐋
📜Please make sure to do your own research before investing, and review the disclaimer provided at the end of each post.

XRPUSDT → Hunting for liquidity ahead of a possible declineBINANCE:XRPUSDT.P is forming a downward market structure after a false breakout of global resistance. Bitcoin is in a correction phase and, after a slight rebound, may continue its movement...
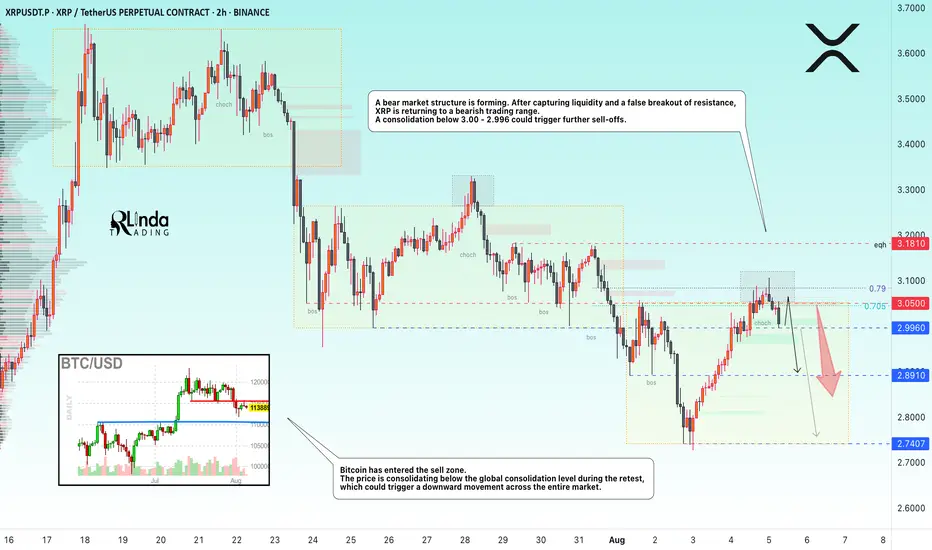
Bitcoin has entered the sell zone. The price is consolidating below the global consolidation boundary of 115,500 during the retest, and if Bitcoin continues to decline, this could trigger a downward movement across the entire cryptocurrency market.
XRP is forming a bearish market structure. After capturing liquidity and a false breakout of resistance, the price is returning to a bearish trading range. There is no potential for continued growth at this time. A consolidation of the price below 3.00 - 2.996 could trigger further sell-offs.
Resistance levels: 2.996, 3.050, 3.181
Support levels: 2.996, 2.891, 2.74
The local bearish structure will be broken if the price starts to rise, breaks 3.050, and consolidates above it. In this case, XRP may test 3.181 before falling further.
At the moment, after a false breakout of resistance, the price is consolidating in the selling zone, and the downward movement may continue. I consider 2.74 - 2.655 to be the zone of interest in the medium term.
Best regards, R. Linda!
Ripple (XRP): 1:3 RR Position Opportunity Here | Breakout ComingXRP is still rising, attempting to break the local high and possibly reach a new all-time high (ATH). We found two trading opportunities here, so now all we have to do is wait!
More in-depth info is in the video—enjoy!
Swallow Academy

Lingrid | XRPUSDT Potential Upside Move From Support ZoneThe price perfectly fulfilled my previous idea . BINANCE:XRPUSDT is rebounding after a breakout from the consolidation zone and testing support around 2.897. The price is forming a bullish structure within a downward channel, aiming to reclaim the mid-level resistance. As long as it remains above 2.897, the bullish wave has room to target the descending channel’s upper boundary near 3.230. Momentum is gradually shifting toward upside continuation following the recent breakout and rebound.
📉 Key Levels
Buy trigger: Break and hold above 2.960
Buy zone: 2.850–2.960
Target: 3.230
Invalidation: Drop below 2.740
💡 Risks
Failure to hold 2.870 could invalidate the rebound
Overall channel remains bearish, posing structural resistance
Broader market sentiment may weigh on breakout momentum
If this idea resonates with you or you have your own opinion, traders, hit the comments. I’m excited to read your thoughts!

XRP Daily (August 6, 2025)Here's the breakdown of the daily XRP/USDT chart analysis:
🧱 Structure Detected
The chart shows a strong parabolic rally, followed by a pullback from a local high near the top of a rising channel.
Price has retraced and is currently sitting just under the midline of the channel, suggesting short-term weakness but within a larger bullish structure.
📊 Market Bias: Neutral-to-Bullish
Despite the local correction, price remains inside the rising channel, maintaining macro bullish structure.
A rejection near the channel midpoint and recent failure to reclaim that zone puts the short-term in a neutral state, but as long as price holds the lower channel trendline or horizontal support, bulls remain in control on the higher timeframe.
🎯 Bullish Targets
$3.18: High-volume node and prior rejection area (near POC on VPVR) — first key target on reclaim.
$3.50–$4.00: Upper channel extension zone — potential area if momentum resumes.
$5.00: Psychological round number and top of channel expansion zone — long-term stretch target.
🔻 Bearish Levels
$2.70: First major horizontal support (yellow line); key for trend defense.
$2.00–$2.20: Strong volume shelf on VPVR; if $2.70 fails, this is a likely bounce zone.
$0.67: Fibonacci anchor level (plotted on chart); last-resort structure base.
🕰️ Timeframe-Based Targets
Daily Swing Targets:
Upside: $3.18 > $3.50 > $4.00
Downside: $2.70 > $2.20 > $0.67
Weekly: Still bullish as long as price holds above $2.70 — structure remains intact.
🧠 Summary
XRP is currently consolidating inside a rising channel after a strong impulse move. Daily structure remains bullish overall, but recent weakness near the channel midpoint and POC suggests sellers are active. Watch for price to reclaim $3.18 or break below $2.70 for next directional move.

XRP Update · Nothing Changes But One Thing...Market conditions continue to improve and all is great but one thing...
XRPUSDT is trading in the bullish zone but below its January 2025 peak price, this can have some implications. If XRP were to stay below this resistance, it can take a while before the next target is reached.
The last advance was a good one. XRP grew 92% in 26 days, including all-time high and everything. The market is good, the market is strong and the market can continue to grow, but there is no hurry if the growth is set to be sustained long-term. If a rise is to be maintained, there needs to be stops along the way.
So moving below resistance for a few days can lead to bullish momentum drying up. Once dried, the bears can take the upper-hand and push prices lower. Lower but still higher as in our classic higher lows.
Retraces, sideways, reversal, consolidation, accumulation. Bullish wave.
The market has room to wiggle around. Patience is key.
If a move back above $3.40 doesn't happen soon, prepare to wait.
Regardless of the length of the waiting period, possibly with a downward bent, XRP will continue to grow. If prices move lower this is an opportunity to buy-in or rebuy.
Namaste.
XRPUSDTTechnical Setup
Pattern: Bullish flag
Trendline: Respected ascending trendline; bounce from dynamic support
Fibonacci Levels: Entry near 0.5–0.618 retracement of prior leg; strong demand zone
RSI: Above 50 and curling upward → momentum building
Target (TP1): ~3.74 – aligns with prior structure and flag projection
Stop Loss: ~3.10 – below recent swing low and structure support
If price breaks and holds above ~3.30 with strong volume, the path to 3.74 opens up quickly.
Just monitor closely around 3.30 resistance — it’s your decision zone.

XRP LONG SETUP INTRADAY ( 11 AUG 2025 )Entry Details:
Entry: 3.1798 $ - 3.2035 $
Target Price: 3.2896 $
Stop loss: 3.1454 $
Trade Ideas:
Idea is clearly shown on chart + we have some secret psychologies and tools behind this.

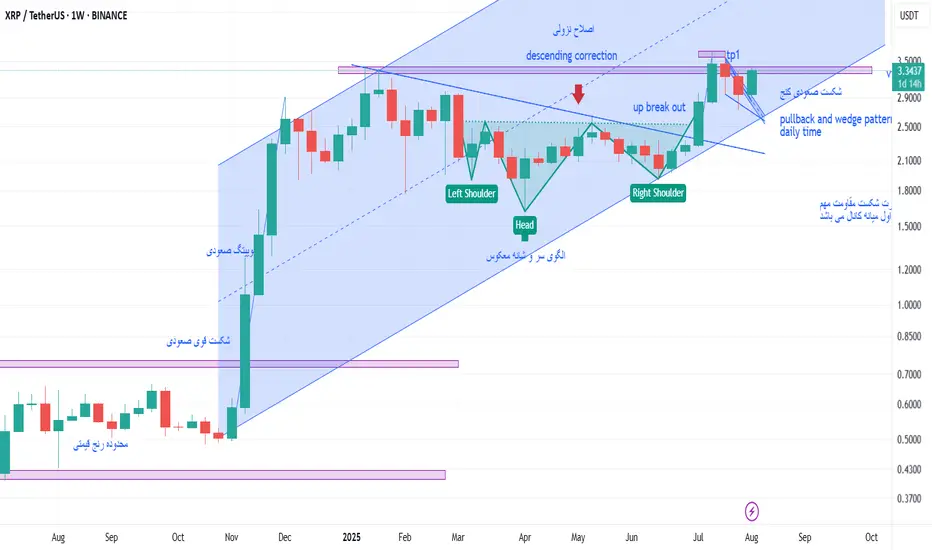
xrp weekly chartas we see total trend is ascending
tips :
1 after a midterm descending corretive trend it formed a head and soulder pattern which with macd positive divergence was a signal for the the end of correction
2 : by 7 july candle which is a strong ascending one the descending trend line was broken up and the buy signal was presented.
3 : when price reached to the vital static resistance made by candle 20 jan 2025 it stoped and formed a wedge pattern which is obvius on daily chart ,
4 : then we witness that the price broke up the wedge and now it is testing the static resistance level .
if it can break up that static resistance level I believe the first target price will be channel midline.
so we are waiting for closing weekly candle and starting new one , and for better decision we should control daily chart .
thank you
XRP RALLY BEGINS "THE CALM BEFORE THE STORM"🚀🚀🚀
SUBSCRIBE, BOOST AND COMMENT IN ORDER TO GET HIGH QUALITY TECHNICAL ANALYSIS.
Firstly, our Algo-based indicators are used to create this analysis.
XRP IS ACCUMULATING TO PUMP SO HARD THAT YOU MIGHT SAY "WHY I DIDN'T LISTEN HIM AND BOUGHT MORE"
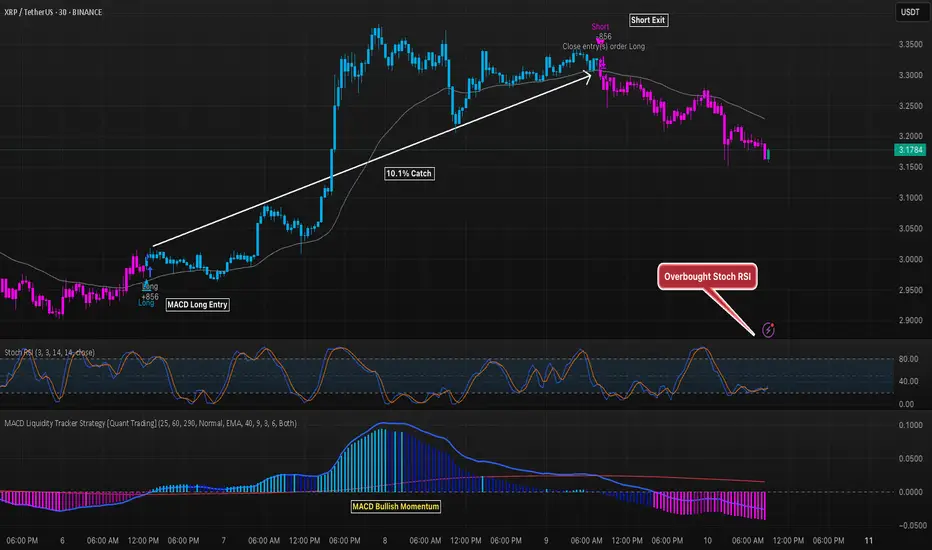
XRP 30M Strategy Trade Nets 10.1% GainThe MACD Liquidity Tracker Strategy caught a strong 10.1% move on XRP’s 30-minute chart, entering on bullish momentum and closing near the peak. The rally aligned with overbought Stoch RSI conditions, signaling potential exhaustion before price turned lower. Post-exit, momentum flipped bearish, confirming a timely close.
XRP 4H – Double Bottom… or Just Another Lower High?
XRP bounced cleanly from major support — the same zone that sparked its last leg up.
This could mark the early stages of a double bottom or just another bear market rally before continuation.
🔹 Previous top = strong supply rejection
🔹 Current support = high-volume bounce zone
🔹 Stoch RSI turning up from oversold
Key confirmation would be:
– Break of $3.15
– Retest + continuation
Otherwise? Another fakeout lower high could trap longs.

Xrp (Ripple)Ripple
Xrp usdt Daily analysis
Time frame daily
Risk rewards ratio >3.2 👈👌
Target 3.2$
Ripple technical analysis ✅️
My last short position reached the target.
Head and shoulders pattern completed.
Now it is a good time to start
My critical area is red box that you see on the chart. It is very important area .
If Ripple can reach and break this resistance, we will have a good pump
But now 3 _3.2$ is a good target

XRP Update · Support Confirmed · Not $4, Now $6 & HigherIt is true our next target is $4.5 but this isn't the final target anymore. Based on what I am seeing coming from the chart and what is happening marketwide, we have to continue to expand while aiming higher, each time, adapting to market conditions.
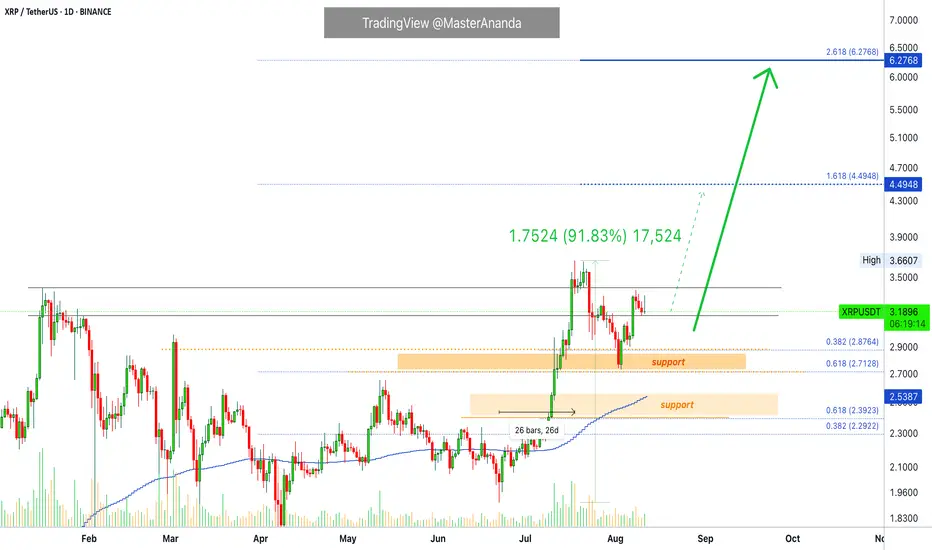
The next target for our XRPUSDT track and trade is now at $6.27, let's read the chart.
First, do what you need to secure profits, your trade, your position; and do your own thing. I you alert of the opportunity, great entry price and timing but it is up to you to plan, take profits and adapt your trading to your own individual conditions. All is good and we are doing great. Notice how the market continues to perform awesome just as expected and notice how we indeed are getting more; and more. This is not the start, XRP is already pretty advanced in its bullish cycle but this isn't the end either. There is plenty of room left available for much more growth.
Yesterday support was found exactly above 0.618 at $2.71. These levels were there before the retrace so we know based on what Fib. proportions XRP is moving. We know exactly where to find resistance and support.
As soon as support was activated the same day we got a full green candle and the break of another resistance. Today full green again. Normally, people would still say that it is early and wait for confirmation; not me, I told you the retrace would be fast and end within days. Seeing the action as it is today, we can confirm the resumption of the bullish move. This means higher prices and higher prices in the chart can translate into weeks of bullish action. Week after week after week. Some retraces and corrections will invariably show up, always small followed by additional growth.
This is the 2025 bull market. Still early, the best is yet to come.
Bullish momentum will grow and a massive force will take over the market. This force is likely to be with us for months and at this point everything will grow. This same energy will remain with us for years and we have to make the most of this cycle.
Be ready, be prepared, maximize profits and continue to buy, to hold and to trade long-term. The more we practice the more we learn.
The more we learn more money we can make. With more money, we can meditate more and with more meditation we can improve our results. The conclusion is abundance and with financial abundance we can materialize the type of life we want. It can be anything, but you will be rewarded based on your insistence, persistence and hard work.
Patience is key.
Thanks a lot for your continued support.
Namaste.

$XRP UPDATE!CRYPTOCAP:XRP
After breaking out above the trendline and tapping resistance at $3.38, price is pulling back, and with the weekend ahead, we might see a healthy retracement toward the 0.5 Fib level around $3.05.
That zone is shaping up as a prime accumulation area, especially for those eyeing the next leg up.
If that level holds, XRP could easily reclaim momentum and push toward $4 and beyond.
This dip might be the perfect chance to load up before the next leg up.
#XRP

XRP - Wait for It!Hello TradingView Family / Fellow Traders. This is Richard, also known as theSignalyst.
📈XRP has been overall bullish trading within the rising wedge pattern marked in blue, and it is currently retesting the lower bound of the wedge.
Moreover, it is retesting a strong demand zone marked in orange.
🏹 The highlighted blue circle is a strong area to look for buy setups as it is the intersection of the orange demand zone and lower blue trendline acting as a non-horizontal support.
📚 As per my trading style:
As #XRP retests the blue circle zone, I will be looking for bullish reversal setups (like a double bottom pattern, trendline break , and so on...)
📚 Always follow your trading plan regarding entry, risk management, and trade management.
Good luck!
All Strategies Are Good; If Managed Properly!
~Richard Nasr

Is XRP doing it again?No need to complicate it, just look into it.
Will it reverse or what? Let's see.

XRP 8H – Rejection Off Resistance, Can Golden FIB Save It?XRP just printed a clean rejection off the $3.15 resistance zone, and price is now pulling back into a high-probability demand zone — the classic Golden Pocket (0.5–0.618) retracement from the July impulse leg.
With momentum cooling off, bulls need to step in soon or risk a drop into deeper Fib levels.
🔹 Key Levels & Structure
Price failed to reclaim the prior breakout zone (blue box) and is now in a short-term correction phase.
The Golden Pocket between $2.79–$2.59 lines up with price structure from late June.
Below that, 0.786 at $2.28 marks the final zone before invalidation of the full move.
🔹 Momentum Check
Stoch RSI remains in overbought territory — a deeper reset could align with a Fib bounce and create the next opportunity.
Price may need to sweep lows before continuation.
🔹 Scenario to Watch
A bullish bounce from the Golden Pocket → reclaim of $3.15 = strong upside continuation potential.
Otherwise, XRP may revisit the 0.786 level before stabilizing.
Do you trust the Fib support — or are you waiting for confirmation above $3.15?
Let’s discuss 👇

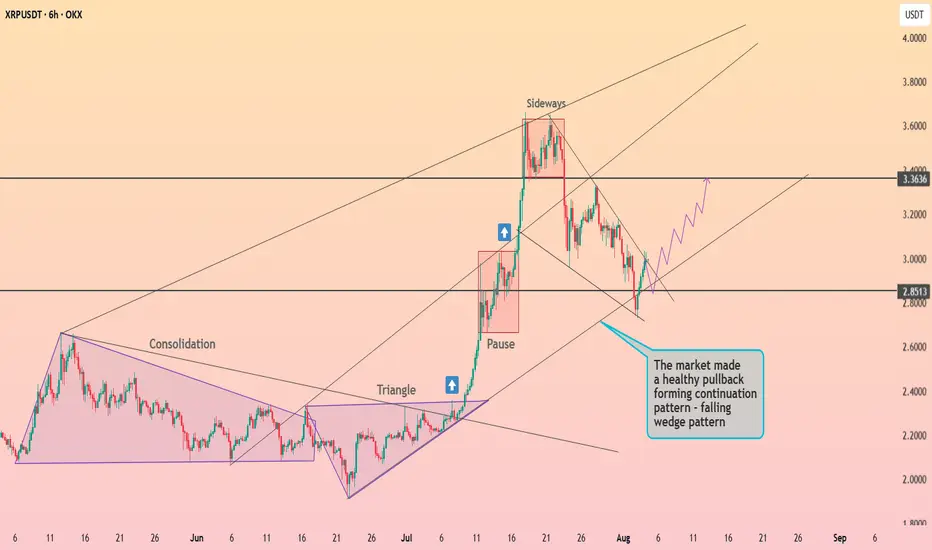
XRP is preparing to exit the wedge ┆ HolderStatOKX:XRPUSDT is forming a falling wedge after a sharp breakout and pullback. Price is stabilizing near $2.85, a key former resistance level. If bulls reclaim momentum here, a move toward $3.36 becomes a high-probability scenario.