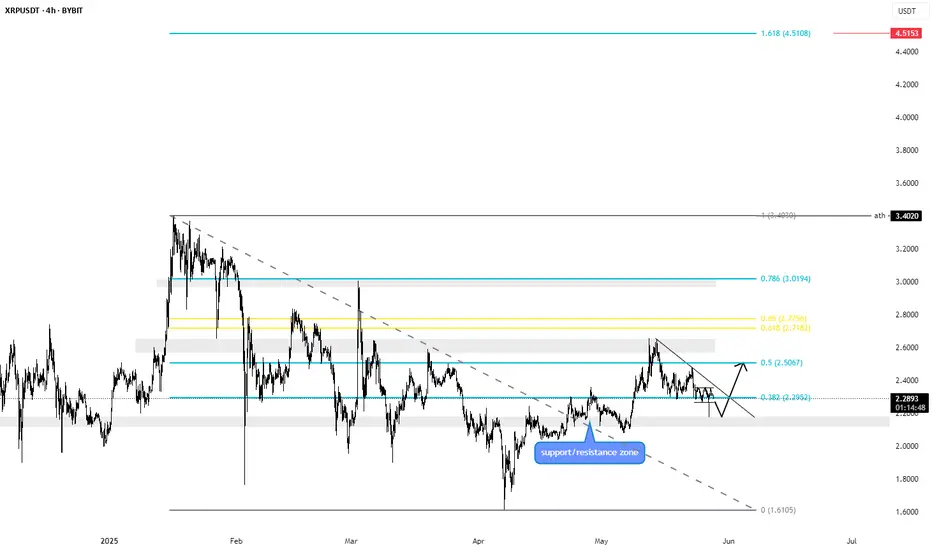
Short term bearisch on XRPXRP shows a triple top on the 4h chart which is a strong bearish pattern. If we are going to play this, this nicely matches the testing of a previous resistance/support zone. which we are now going to test again. If we manage to convert it into support and we break the trendline, the way is clear to the 1.618 fibbonachi level, which amounts to a value of approximately 4.5 usdt. www.tradingview.com www.tradingview.com
XRPUSDT trade ideas
XRP/USDTPrice made 2 bounces from the elite zone already and is showing same sign the 3. time now...but we have to be carefull since we are in a range and there is no signs of new lows nor highs but it is true that we are in a slow sell trend overall and crypto short fall...let see what we can play out of this!
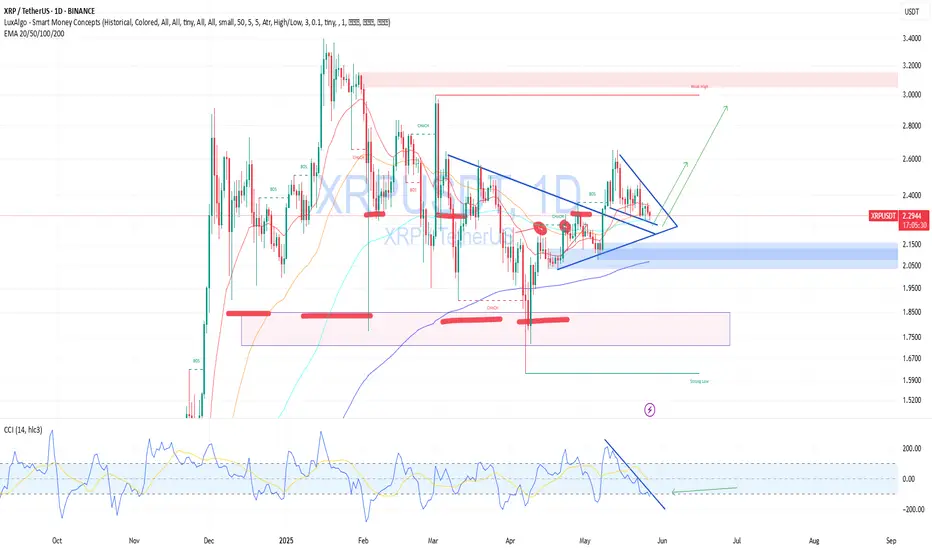
HolderStat┆XRPUSD rebound Ripple—path to sell-zoneCRYPTOCAP:XRP — Sharp rebound tagged 2.65 and carved a rising wedge riding a firm 2.40 k trendline. Current coil suggests a bullish continuation toward 2.90-3.00 k supply zone; failure to hold 2.30-2.35 k only delays, not kills, the broader uptrend. Liquidity build hints accumulation.

Ripple Potential UpsidesHey Traders, in today's trading session we are monitoring XRP/USDT for a buying opportunity around 2.23 zone, Ripple is trading in an uptrend and currently is in a correction phase in which it is approaching the trend at 2.23 support and resistance area.
Trade safe, Joe.

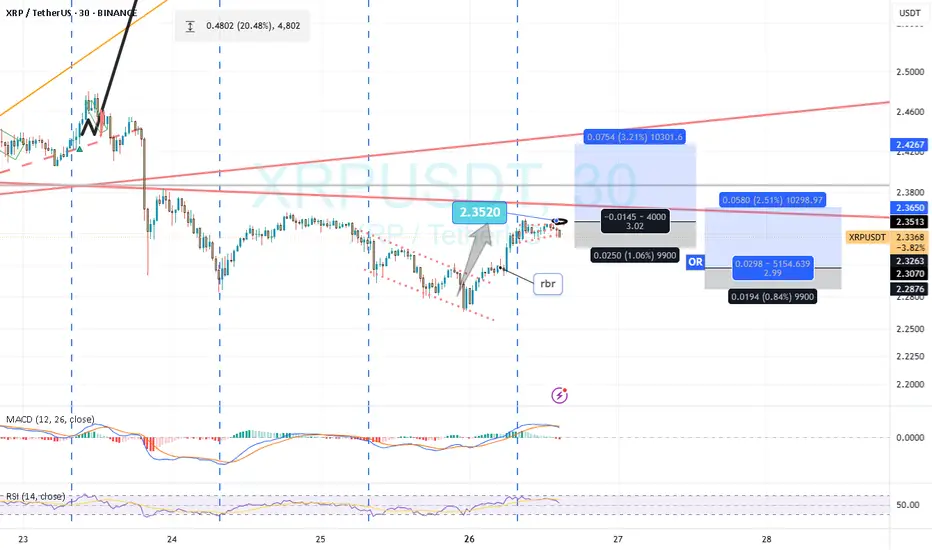
XRP $4.5 Followed by $6.29 Target ConfirmedThere is a small support zone around $2.30 that has been tested and retested since 17-May, it holds and it is now confirmed. You can truly hit the gas now, go all-in on XRP. I say this because the next advance (higher high) is about to get started in the coming hours and days. The full advance of course can take weeks or months to develop but the low entry prices and the buy-zone can be available only for a few more hours, maximum a day or two, before it is gone. I don't believe it will last days but we are still here today.
If the bears had the strength to move the market lower they had 10 days to do so, they failed. A bearish failure is a bullish success.
This is just a friendly reminder because I know you love XRP and I am happy to give you post/charts with great entry price and timing. A high probability of success.
There is no doubt in mind, 100% certain. XRPUSDT is set to grow next.
Thank you for reading.
If you agree follow & boost.
If you agree strongly leave a comment, just a few seconds of your time and it makes a difference. Share, how long have you been holding for? Did you manage to join the previous wave in late 2024? What about the buy zone in early April?
It is never too late, the market always gives a second chance.
This is the third one. The time is right and the time is ripe.
Prepare for financial success. Profits.
Namaste.

Xrp Short Term PossibilitiesBINANCE:XRPUSDT.P
I am sharing this analysis for myself, it is not investment advice.
İn xrp we see a major bearish channel, in the channel we are nearly on the top. And Then wee see a triangle formation short term price move.
İf we break the triangle up we go double resistance area, normal resistance and channel line. İf we go down we are probably see a reaction on the white line and go up, after we go up if 2.27 resistance hold us we go to 2 dollar zone, but if 2.27 dont hold us we go to channel upper limit again.
Lastly, the cumulative delta is showing us a not good sign too. I used perpatual for this analysis but on the spot side things are not different too.

XRPUSDT 4H | Untested Demand Zone RevisitIn this 4-hour chart analysis of XRPUSDT, I’m focusing on a clear and well-defined untested demand zone between 2.05–2.13 USDT . Unlike the first demand zone (already tested and played out), this second zone has not been retested since its formation, making it a fresh area of interest for a potential long setup.
Why this matters :
Untested demand zones often act as powerful magnets for price when revisited, as they represent areas where large buy orders might be waiting to be filled. Because this zone has not been revisited yet, there’s a higher probability for a bullish reaction when price returns to it.
Key Technical Factors :
✅ The 2.05–2.13 demand zone was formed following a significant bullish impulse that created a clear break of structure to the upside.
✅ Price is currently consolidating above this demand zone and also above a potential bearish CHoCH at 2.0784 . This suggests that the bullish structure is still valid unless price breaks below 2.0784.
✅ My bullish target is 2.65 USDT , where previous highs were formed and potential liquidity exists.
✅ My stop loss is set just below the demand zone, around 2.05 , to protect against a deeper retracement or a shift in market structure.
My Thought Process :
I expect that if price returns to the demand zone, there will be a strong chance for buyers to step in and push the market higher. However, I’m aware that if price breaks below 2.0784 , it would signal a bearish CHoCH and invalidate the long scenario. Therefore, patience is key — I’ll wait for price to either test the zone and react strongly or stay above 2.0784 to keep the bullish bias intact.
Clear Trade Setup :
📌 Entry Zone : 2.05–2.13
🛑 Stop Loss : Below 2.05
🎯 Take Profit : 2.65
🧩 Invalidation : Break below 2.0784
💬 Let me know if you have a similar zone marked out or if you see a different setup! Let’s share ideas and refine our strategies together.

XRPUSDT — Buy From Support, Waiting for Triangle BreakoutOn the 4H chart, XRP is consolidating inside a symmetrical triangle and holding above an ascending trendline — a key support zone that has held multiple times.
🧠 Fundamentally:
Ripple continues expanding partnerships with fintech and banks.
The SEC lawsuit has lost its grip on price action.
A potential Fed rate cut could push crypto sentiment up again.
📌 I’m entering positions near $2.31, gradually accumulating. A breakout above the triangle could trigger a strong move.
🎯 Targets:
$2.50 — initial resistance
$2.65+ — if breakout is confirmed with strong momentum
🔽 If price breaks below $2.20, I’m looking to buy confidently near $1.80, where major demand sits. I don't expect such a dip, but markets can surprise.
XRP is looking for a way outXRP has broken the April trend line, it has also found support temporarily.
I am watching as it has avoided a couple downward channels over this past weekend. Currently it is attempting to find a ride towards 2.35
If this channel doesn’t work for it we may see it ride the yellowish channel down towards 2.20
Btc conference this week. EU tariffs delayed. Macro event is what may be the catalyst to either side.
I am overall bullish and still DCAing.
Good luck this week

XRP Eyes Breakout Toward $2.92 – Channel Structure Holds
CRYPTOCAP:XRP is currently trading inside a rising channel and holding the midline support around the 0.618 Fibonacci level. This zone has acted as a launchpad in the past and could again support a strong upward move.
✅ Structure: Bullish channel
🧠 Key Support: ~$2.18–$2.22 (aligned with 0.618–0.786 Fib levels)
📍 Trigger: Bullish continuation from this zone confirms trend resumption.
🎯 Target: $2.9206
This is the projected move based on the height of the channel structure.
Watch for volume confirmation on the bounce — the setup remains valid as long as XRP stays above key support.

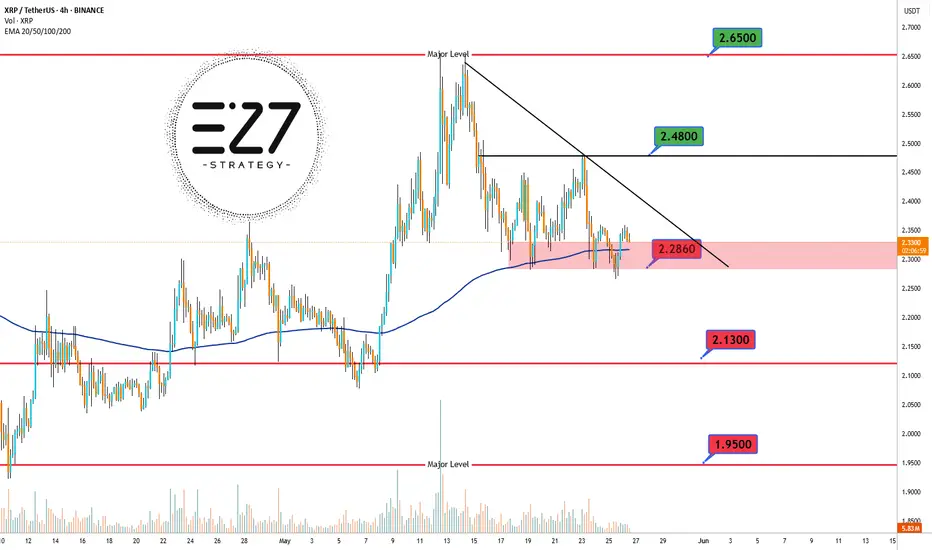
XRPUSDT The 4-hour chart of BINANCE:XRPUSDT shows that the overall trend remains bullish, but the price is currently in a corrective downward phase. 📉 At the moment, XRP is trading in a highly critical zone, right at the 2.2860 USDT support level, which aligns with the 200 EMA — often considered a dynamic support area. 🛡️ Despite this confluence, the price still sits below the descending trendline, indicating continued bearish pressure. ⚠️ If the price manages to hold this key zone and break above the trendline, a move toward the next resistance at 2.4800 USDT and potentially 2.6500 USDT could follow. 🚀 However, losing the 2.2860 support could trigger a deeper drop toward 2.1300 USDT and even 1.9500 USDT. ❗ This current level, where static support intersects with the 200 EMA, is a make-or-break zone that will likely define the short-term direction of XRP.
Support & Resistance Levels:
🔼 Major Resistance: 2.6500 USDT
🔼 Secondary Resistance: 2.4800 USDT
⚡ Dynamic Resistance (trendline): ~2.3500 USDT
🔽 Key Support (current price level): 2.2860 USDT
🔽 Secondary Support: 2.1300 USDT
🔽 Major Support: 1.9500 USDT
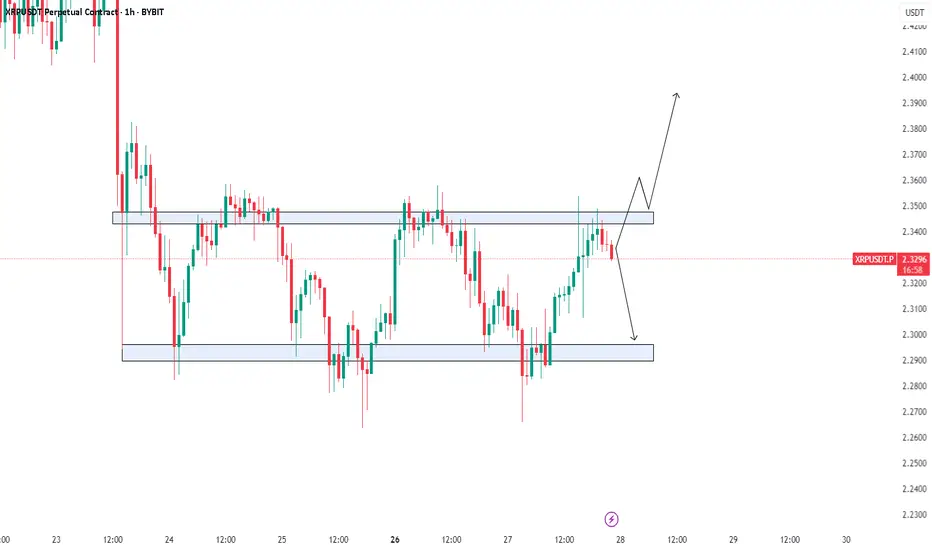
Holiday movesXRP flirting with new short term trend line
Looking for a quick in/out.
2.3280 break I’m in for short to 2.29ish
Bounce from 2.33 I’m in for long to 2.36
SL tight
Will be 100% watching position

SHWIGGITY THE HEADSHOULDERYI would like to reclaim the POC and vwap and i'd also want BTC confluence but XRP mooned without btc multiple times.
this looks fine by me.

are you miss Miracle ?! TradeWithMky on XRP MultyTimeWeekly time frame we are facing with a stronge bullish movement that we have passed
retrecement 61.8 started a great bullish movement so we can expect if price pass next resistance can touch a 6.00$ Xrp sooner than a centry
Consider that this is not a financial advice its My analysis about this chart !
@TradeWithMky Do you Want more and last analysis about ripple ? " Lets watch a miracle "
🔥 Live Trade Started .

XRP? Continuation..
Yest was a strong up move .
Currently it's trading range of 20-25% of yest up move.
What is the probability of it trading higher?
To answer this : you will need to find answers yourself
Do not depend of others to spoon feed you.
Find reasons:
1/ we could trade above today resistance
2/ we could wait for the dips previous strong buy levels( at rally based rally / drop based drop )
Once you justify YOURSELF
take the shot
You'll be better off than following anyone.
Answerable to none & if it's wrong you know your mistakes
All the best
Not a guru.
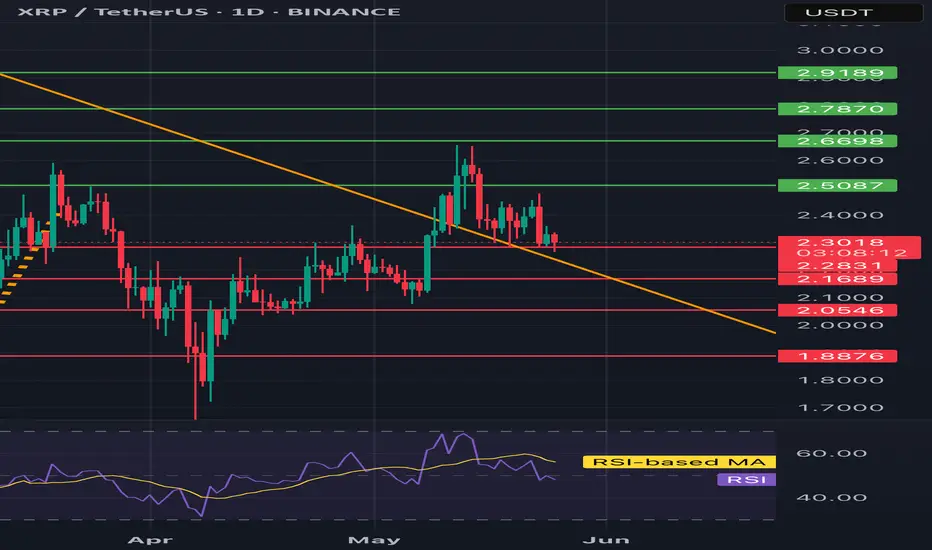
XRP/USDT 1D chart reviewHello everyone, let's look at the 1D XRP chart to USD, in this situation we can see how the price lasts above the downward trend line.
Going further, let's check the places of potential target for the price:
T1 = $ 2.51
T2 = $ 2.67
Т3 = 2.79 $ t4 = $ 2.92
Let's go to Stop-Loss now in case of further declines on the market:
SL1 = $ 2.31
SL2 = $ 2.17
SL3 = $ 2.06
SL4 = $ 1.89
Looking at the RSI indicator, you can see how he reacted and returned to the middle of the range, which creates a place for a panty growth.
XRP - Time To Buy LongBINANCE:XRPUSDT is forming an ascending triangle pattern on the daily chart, indicating bullish momentum.
Price is currently around \$2.30, with key resistance at \$2.60.
A breakout above this level could lead to a move toward the \$3.40–\$3.47 zone.
Support levels are seen at \$2.22 and \$2.16, which may act as a bounce zone.
Invalidation of the setup lies below \$1.96, making it a well-defined risk.
Overall, the chart suggests a potential breakout with a favorable risk-to-reward setup

XRPXRP Drivers and Challenges in 2025
Key Drivers
Regulatory Resolution
Ripple’s long-running lawsuit with the U.S. SEC has largely been settled, with the fine reduced from $125 million to $50 million.
The court ruling that XRP is not a security and the ongoing regulatory clarity have removed major uncertainty, boosting investor confidence and enabling broader institutional participation.
The appointment of a crypto-friendly SEC chair further supports a positive regulatory environment.
Institutional and Real-World Adoption
XRP’s use in RippleNet for cross-border payments and as a bridge currency in Ripple Payments (formerly On-Demand Liquidity) drives real-world transaction volume.
However, adoption depends on how many financial institutions choose XRP over alternatives like Ripple’s stablecoin RLUSD or fiat-backed digital currencies.
Growing integration in banking and fintech sectors enhances XRP’s utility and demand.
ETF Speculation and Market Sentiment
Speculation around potential approval of XRP spot ETFs by major firms like BlackRock and Franklin Templeton has triggered buying interest.
Institutional capital inflows via ETFs could significantly increase liquidity and price.
Positive macroeconomic factors, including easing inflation and improved risk sentiment, support bullish momentum.
Whale Activity and Global Demand
Large holders accumulating XRP and increased trading volumes in markets like South Korea indicate strong investor interest.
Whale transfers to exchanges suggest positioning for potential price moves.
Technical Strength and Price Momentum
XRP has broken key resistance levels (e.g., $2.40), with bullish technical indicators supporting further upside.
Challenges
Competition Within Ripple Ecosystem
Some community concerns exist that XRP’s role is diminishing as Ripple promotes its stablecoin RLUSD, potentially reducing XRP’s core utility.
Regulatory and Legal Uncertainties
Although the main lawsuit is settled, final court approval of the settlement faces procedural hurdles.
Any delays or negative regulatory developments could dampen momentum.
Market Volatility and Overbought Conditions
XRP’s RSI and other indicators suggest overbought conditions, increasing the risk of short-term pullbacks.
Significant liquidations of long positions have occurred recently, which could trigger corrections.
Dependence on Institutional Adoption
The success of RippleNet and XRP’s price depends heavily on widespread institutional integration, which is not guaranteed.
Competing payment solutions and digital assets could limit XRP’s market share.
Summary
Drivers Challenges
Regulatory clarity and lawsuit settlement Potential procedural delays in settlement approval
Institutional adoption in cross-border payments Competition from Ripple stablecoins and other digital assets
ETF speculation and inflows Market volatility and overbought technicals
Whale accumulation and global demand Dependence on broad institutional integration
Positive technical momentum Regulatory risks remain in some jurisdictions
Conclusion
XRP’s price and adoption in 2025 are poised for growth driven by regulatory wins, institutional adoption, and ETF speculation. However, challenges such as ecosystem competition, regulatory procedural hurdles, and market volatility could temper gains. The balance of these factors will determine XRP’s trajectory, with optimistic forecasts suggesting potential prices between $2 and $10+ by the end of 2025 depending on how these drivers and challenges unfold.


#XRP/USDT#XRP
The price is moving within a descending channel on the 1-hour frame, adhering well to it, and is heading for a strong breakout and retest.
We are seeing a bounce from the lower boundary of the descending channel, which is support at 2.29.
We are seeing a downtrend on the RSI indicator that is about to break and retest, supporting the upward trend.
We are looking for stability above the 100 Moving Average.
Entry price: 2.30
First target: 2.33
Second target: 2.37
Third target: 2.42

#XRP/USDT#XRP
The price is moving in a descending channel on the 1-hour frame and is expected to continue upward.
We have a trend to stabilize above the 100 moving average once again.
We have a downtrend on the RSI indicator, which supports the upward move with a breakout.
We have a support area at the lower boundary of the channel at 2.25.
Entry price: 2.34
First target: 2.42
Second target: 2.47
Third target: 2.56

Long (scalp) - XRPEntering a scalp long on XRP
BTC and XRP are the only 2 putting in HL, whereas ETH and SOL are making LLs...
In with small % risk!

Where from here?Short closed.
I am looking for a long entry if XRP pushes below 2.33
2.30ish
Btc conference this week
