XRPXRP Drivers and Challenges in 2025
Key Drivers
Regulatory Resolution
Ripple’s long-running lawsuit with the U.S. SEC has largely been settled, with the fine reduced from $125 million to $50 million.
The court ruling that XRP is not a security and the ongoing regulatory clarity have removed major uncertainty, boosting investor confidence and enabling broader institutional participation.
The appointment of a crypto-friendly SEC chair further supports a positive regulatory environment.
Institutional and Real-World Adoption
XRP’s use in RippleNet for cross-border payments and as a bridge currency in Ripple Payments (formerly On-Demand Liquidity) drives real-world transaction volume.
However, adoption depends on how many financial institutions choose XRP over alternatives like Ripple’s stablecoin RLUSD or fiat-backed digital currencies.
Growing integration in banking and fintech sectors enhances XRP’s utility and demand.
ETF Speculation and Market Sentiment
Speculation around potential approval of XRP spot ETFs by major firms like BlackRock and Franklin Templeton has triggered buying interest.
Institutional capital inflows via ETFs could significantly increase liquidity and price.
Positive macroeconomic factors, including easing inflation and improved risk sentiment, support bullish momentum.
Whale Activity and Global Demand
Large holders accumulating XRP and increased trading volumes in markets like South Korea indicate strong investor interest.
Whale transfers to exchanges suggest positioning for potential price moves.
Technical Strength and Price Momentum
XRP has broken key resistance levels (e.g., $2.40), with bullish technical indicators supporting further upside.
Challenges
Competition Within Ripple Ecosystem
Some community concerns exist that XRP’s role is diminishing as Ripple promotes its stablecoin RLUSD, potentially reducing XRP’s core utility.
Regulatory and Legal Uncertainties
Although the main lawsuit is settled, final court approval of the settlement faces procedural hurdles.
Any delays or negative regulatory developments could dampen momentum.
Market Volatility and Overbought Conditions
XRP’s RSI and other indicators suggest overbought conditions, increasing the risk of short-term pullbacks.
Significant liquidations of long positions have occurred recently, which could trigger corrections.
Dependence on Institutional Adoption
The success of RippleNet and XRP’s price depends heavily on widespread institutional integration, which is not guaranteed.
Competing payment solutions and digital assets could limit XRP’s market share.
Summary
Drivers Challenges
Regulatory clarity and lawsuit settlement Potential procedural delays in settlement approval
Institutional adoption in cross-border payments Competition from Ripple stablecoins and other digital assets
ETF speculation and inflows Market volatility and overbought technicals
Whale accumulation and global demand Dependence on broad institutional integration
Positive technical momentum Regulatory risks remain in some jurisdictions
Conclusion
XRP’s price and adoption in 2025 are poised for growth driven by regulatory wins, institutional adoption, and ETF speculation. However, challenges such as ecosystem competition, regulatory procedural hurdles, and market volatility could temper gains. The balance of these factors will determine XRP’s trajectory, with optimistic forecasts suggesting potential prices between $2 and $10+ by the end of 2025 depending on how these drivers and challenges unfold.
XRPUSDT trade ideas


#XRP/USDT#XRP
The price is moving within a descending channel on the 1-hour frame, adhering well to it, and is heading for a strong breakout and retest.
We are seeing a bounce from the lower boundary of the descending channel, which is support at 2.29.
We are seeing a downtrend on the RSI indicator that is about to break and retest, supporting the upward trend.
We are looking for stability above the 100 Moving Average.
Entry price: 2.30
First target: 2.33
Second target: 2.37
Third target: 2.42

#XRP/USDT#XRP
The price is moving in a descending channel on the 1-hour frame and is expected to continue upward.
We have a trend to stabilize above the 100 moving average once again.
We have a downtrend on the RSI indicator, which supports the upward move with a breakout.
We have a support area at the lower boundary of the channel at 2.25.
Entry price: 2.34
First target: 2.42
Second target: 2.47
Third target: 2.56

Long (scalp) - XRPEntering a scalp long on XRP
BTC and XRP are the only 2 putting in HL, whereas ETH and SOL are making LLs...
In with small % risk!

Where from here?Short closed.
I am looking for a long entry if XRP pushes below 2.33
2.30ish
Btc conference this week

XRP steaks again this weekend?Looking for a quick in\out short scalp around mid 2.36
Target is 2.3324
SL is tight

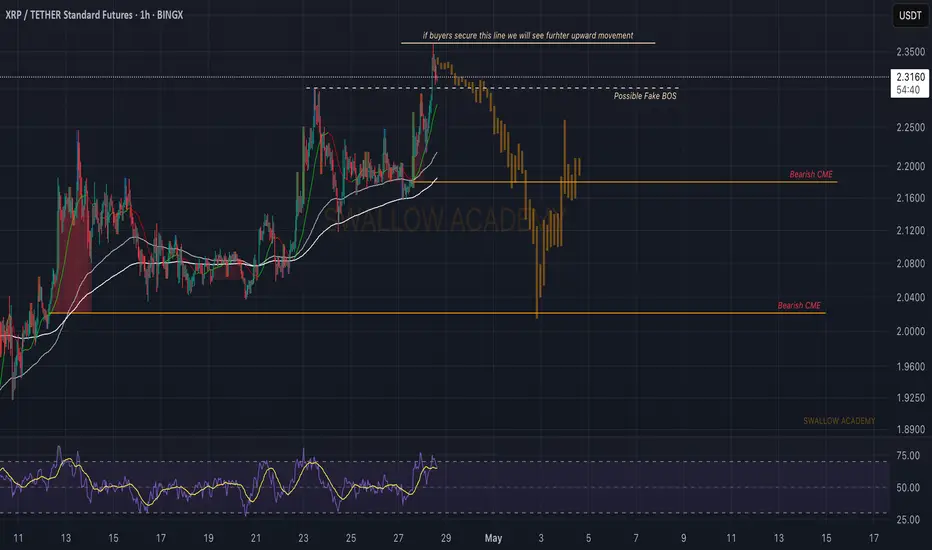
Ripple (XRP): Possible Fake-out Forming | Fill of CMEsRipple coin is showing some sort of weakness right after we had a decent break of structure and now we might be going to a fakeout here.
Why do we see a possibility of a wakeout? It's due to the CME gap that was formed when the price went for a break of structure so we might see a sharp fakeout, which then would give a good entry for the downward movement from there.
Swallow Academy
XRP Long SetupXRPUSDT – Double Bottom + Cup and Handle Pattern Signaling Bullish Reversal
The XRPUSDT 6H chart is showing strong signs of a potential bullish reversal. After a prolonged downtrend, price appears to have formed a double bottom near the key demand zone at 2.30 – 2.25, which is also the base of a developing Cup and Handle pattern.
✅ Key Analysis Points:
• Double bottom formation around the 2.30 level indicates strong buying interest and rejection of lower prices.
• The overall price structure is forming a Cup and Handle, a classic bullish continuation pattern.
• Clear CHoCH (Change of Character) confirms bullish momentum and possible trend reversal.
• Price is currently consolidating in the handle region with a potential breakout toward the 2.65 resistance zone (marked as “Weak High”).
• Trend model suggests a bullish trend supported by machine learning and optimal trend-following metrics.
📌 Confluence Factors:
• Demand zone support around 2.25–2.30
• Multiple CHoCH signals reinforcing bullish control
• Structure alignment with the Cup and Handle formation
• Parabolic move projection toward upper resistance area
🎯 Targets:
• TP1: 2.45
• TP2: 2.60
• TP3: 2.65 (Weak High area)
❌ Stop Loss:
• Below 2.25 support zone or under recent CHoCH lows
⚠️ Note: Watch for a strong breakout above the handle structure with volume to confirm the pattern. Failure to hold the 2.25 zone would invalidate this bullish scenario.

Ripple (XRP): Waiting Is Key, Waiting For Breakdown Near CMERipple coin has filled almost our CME gap since the last time we took a look at the coin, and now we are looking for a possible breakdown of that zone to happen.
While price is currently retesting the upper resistance zone again, we are looking for price to fall back and get rejected, which would then give us an opening for possible downward movement to lower zones, giving us a chance to fill an FVG.
Swallow Academy

Ripple (XRP): Possible Zone of Rejection | April 2025Ripple has reached the resistance zone, which has aligned with the 200EMA, forming a strong resistance zone.
We are looking for some kind of MSB to form here, which can give us a good entry for a short position.
Swallow Academy

Ripple (XRP): Huge CME Gaps On Lower Zones / Time For Drop?Ripple coin had a proper breakdown where currently we are seeing some sort of re-test happening, which we intend to be successful, so a proper rejection is forming there!
More in-depth info is in the video—enjoy!
Swallow Academy

Ripple (XRP): Looking For Shorting Zones and ConfimationsRipple coin can form here a good downward movement where we are still waiting for any signs of weakness in the markets. In our opinion, this coin is doomed for fall so let's see how things will unfold!
More in-depth info is in the video—enjoy!
Swallow Team

HolderStat┆XRPUSD seeks to overcome $2.8CRYPTOCAP:XRP snapped a year-long down-sloping barrier, rocketed to 2.65 USDT, and is recharging in a slanted box whose floor sits on the 2.40 trend confluence. Hold that hinge and the next swing could tunnel into the 2.90-3.00 sell zone; surrender it and 2.20 becomes the logical rebound trench while the macro channel still tilts higher.

XRP Correction Complete? — Long Setup Aligned with Fib & OBXRP has completed a 5-wave impulse move. As expected, XRP is now in a corrective phase, pulling back after rejecting from a key resistance — and it’s doing so with technical precision.
The question now: where is the next high-probability long setup? Let’s break it down.
🧠 Market Structure & Key Zones
Using Fibonacci retracement from the base of the 5-wave impulse, we now have a potential golden pocket target aligned with major confluence.
🔽 Support Zone
🔹 0.618 Fib retracement: $2.2982
🔹 Daily Bullish Order Block: $2.2949
🔹 Daily 21 EMA: $2.329
🔹 Daily 21 SMA: $2.301
🔹 Liquidity pool
🔹 0.786 Fib Speed Fan (only if price drops between May 17–18)
This creates a high-confluence support cluster at ~$2.3 — a prime candidate for a long re-entry.
🟢 Long Trade Setup
Entry: Ladder between $2.32 and $2.28
Stop-loss: ~$2.21
Target: $2.7175 (0.618 Fib retracement of the corrective downtrend)
R:R: ~5:1
🔴 Short Setup (Conditional)
Trigger: Rejection at $2.7175
Entry: ~$2.7175
Stop-loss: Above $2.8033 (0.666 Fib) → set at ~$2.811
Take Profit: ~$2.56 or lower
R:R: ~2:1+ (dependent on entry confirmation and PA behaviour)
Shorts only valid if a clear rejection or SFP pattern emerges. If momentum is strong, this level may break — so wait for structure to confirm.
📘 Educational Insight: Why Confluence Matters
Too often, traders chase single-indicator signals. But real edge comes from confluence — when multiple tools (Fibs, MAs, Order Blocks, Liquidity, VWAPs, FVG, Speed Fans etc.) agree on the same zone. This alignment not only increases confidence in your entry, but also sharpens your risk management.
Think of it as building a case — the more aligned evidence you have, the stronger your trade thesis becomes.
📌 Summary
XRP is in a corrective phase after a 5-wave impulse
Clean rejection from weekly resistance → continuation of bearish trend
Long zone: ~$2.3
SL: ~$2.21 | TP: $2.7175 | R:R ~5:1
Optional short: $2.7175 rejection → SL $2.811 | TP $2.56
Precision isn’t about predicting — it’s about being ready when the chart speaks with clarity. Patience makes probability powerful.
___________________________________
If you found this helpful, leave a like and comment below! Got requests for the next technical analysis? Let me know.

XRPUSDT 1HR TF Bullish multiple swing breakoutA breakout at 2.4380 from multiple swing
Targets are 2.53 and 2.6
Invalidation: if it closes below 2.4058 in 1hr time frame.
Entry 2.4380 - 2.4058

XRSPUSDT ABC-D Pattern AnalysisHi there,
XRPUSDT has the potential to dip before pulling back up; however, it is unclear how deep the correction might be.
The price remains bullish against the ABC-D pattern, with point D potentially reaching the 2.8024 area.
Momentum like this is high-risk, costly, and requires careful monitoring.
Happy trading; and have a wonderful weekend.
Khiwe.
Not trading advice.

#XRPUSDT We see that the inside of a yellow pattern is fluctuating and
the ceiling of this pattern is close
A strong break of the black ceiling of the pattern and especially the red resistance band could indicate good growth ahead
So wait and watch

XRP Poised To Reach 2.6 SoonXRP Poised To Reach 2.6 Soon
Optimism for a significant increase in the cryptocurrency market has increased significantly after Bitcoin broke 111K for the first time, thus creating a new price level.
Altcoins have not moved much at the moment, but are now positioned to increase further after Bitcoin.
XRP broke out of a small structure area located at 2.4 and if the price manages to hold it, it should continue the optimistic movement with targets at 2.5 and 2.6.
You may find more details in the chart!
Thank you and Good Luck!
❤️PS: Please support with a like or comment if you find this analysis useful for your trading day❤️

XRPUSDT 1hr time frame, make another swing please.For XRPUSDT on the 1-hour time frame: If it makes another swing below the neckline before a breakout, I can consider trading this based on my strategy. If not, I will wait for another pattern to trade.
Just my POV. Adding this to watch list again.

2025.05.23 RIPPLE Short-term long positionWe are the SeoVereign Trading Team.
With sharp insight and precise analysis, we regularly share trading ideas on Bitcoin and other major assets—always guided by structure, sentiment, and momentum.
🔔 Follow us to never miss a market update.
📈
Currently, Ripple is analyzed to have completed its B wave around the $2.20 level in the mid- to short-term wave count. Accordingly, the upcoming movement is likely to be an upward C wave or the beginning of a new bullish wave.
Based on the technical structure and wave theory, the short-term targets are as follows:
1st Target: 2.49
2nd Target: 2.51
3rd Target: 2.55
In the short term, whether previous highs are broken and the strength of buying pressure are key indicators to watch. If the rise continues with increased trading volume, the above targets are likely to be valid.
📌 Strategy Summary:
Pullback buying strategy is valid with proper risk management
Key support level is around $2.20
Position adjustment to follow based on future main scenario updates
Strategy based on the mid-term main outlook will be provided sequentially.

XRP? intra
Hi
We are juncture .. to decide Break or not 2.43000
Not at yest average high
Hope to see momentum from hereon
All the best
money Management
Not a guru

X to the r to the p Bullish flag breakout with targets on the charts
on the higher time frame you can see the retracement on the flag therefore ready to pump
