XRP 3 Line Drive and Bull FlagXRP about to make 2 major chart patterns for a bullish move to $5 range. 3 Line drive and trendline hit on a bull flag.
XRPUSDT trade ideas
XRPUSDT 1D#XRP has formed a bullish pennant on the daily chart — keep an eye on it.
In case of a breakout above the pattern resistance and the daily MA50, the targets are:
🎯 $2.5067
🎯 $2.7175
🎯 $3.0177
🎯 $3.4000
⚠️ Always use a tight stop-loss to manage risk and protect your capital.

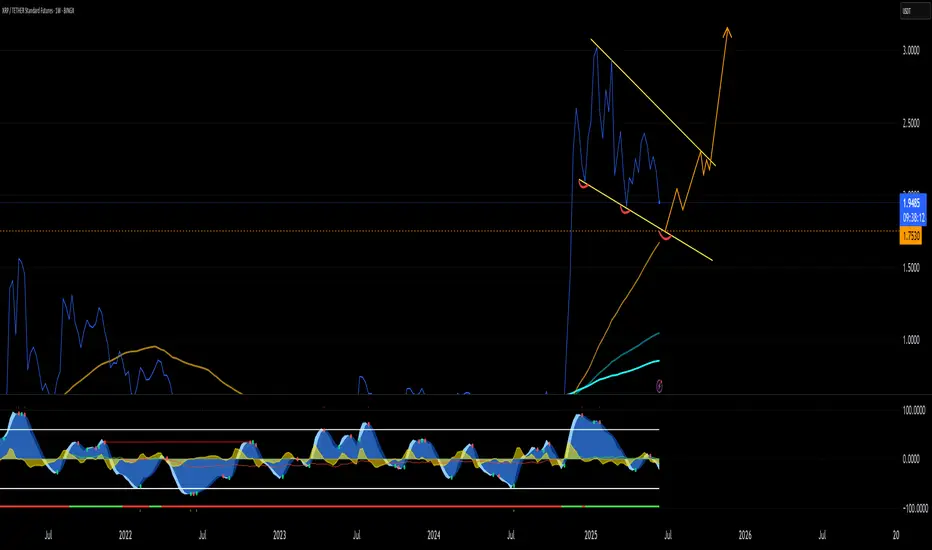
XRP UG-ah-LYXRP has been slowly chopping lower in a mess of overlapping candles. Lower highs and lower lows at the Highest degree. The trend is down and the Elliott Is ugly.
There is a chance here for the trend to shift, but that low needs to hold.
In Elliott Wave, ugly can be useful. An ugly pattern often screams correction. That is the working assumption right now. This structure could still be a complex wave four.
Even though the wave count has not been crystal clear, I am not flying blind. I am using support and resistance to track the structure and wait for clarity.
Here are the levels that matter right now:
3.4005 was the major high
3.0257 and 2.2762 are key reaction zones
2.6510 is the median and the first major line bulls need to beat
1.9736 is the old high that price continues to bounce from
1.9015 and 1.5267 are the potential downside reaction zones if the yellow path unfolds
If this is a correction, there is still potential to hold above 1.62 and send. If that level goes, the structure shifts fast to lower targets.
This is not the time to get brave without confirmation, mo.
Ugly price action can still resolve cleanly. But I want to see an impulsive move through one of these levels, followed by a corrective return to that level. That would offer a more ideal continuation in whichever direction price decides.
Let the level reactions speak first. I will act after.

XRP — Triple Tap at Support or One More Low Before Lift-Off?🎯 BINANCE:XRPUSDT Trading Plan:
Scenario 1 (Support Holds):
Bullish above $1.90 — possible pre-breakout setup if structure improves
Look for volume/impulse above midrange to confirm move
Scenario 2 (Sweep Lower):
If $1.90 fails, set alerts at $1.39–$1.40 for reaction/reversal setup
Entry on strong reversal pattern at sweep zone
No Trade:
No action unless price at the range extremes or showing breakout structure
🔔 Triggers & Confirmations:
Only engage after confirmation: bullish SFP at $1.90 or $1.39–$1.40, or clear structure before breakout
📝 Order Placement & Management:
Buy: Only at $1.90 (on reclaim) or $1.39–$1.40 (on strong reversal)
Stop: Below range low ($1.90) or below sweep zone ($1.39)
Targets: $2.90 (range high), then $3.40 (liquidity sweep)
🚨 Risk Warning:
Wait for range extremes or breakout confirmation
Avoid chasing chop — patience until the setup is clean

Breakout loading on $XRPBreakout loading on CRYPTOCAP:XRP 🚀
Accumulating heavily here as the price coils inside a massive triangle.
Q3 could be explosive, chart points to a breakout toward $4.60
Retweet if you're BULLISH !!

Ripple (XRP): Seeing Smaller Bullish Movement To AccumilateRipple coin has extended itself heavily since november but what we noticed is how close the 200EMA line on the daily timeframe has come to the market price, which is our main point of interest as of now.
More in-depth info is in the video—enjoy!
Swallow Academy

XRP: You Have What it Takes, Success is Yours!It seems XRP has been trading at the same price for more than 7 months. The mean price since XRP broke above $2 back in December 2024.
Can you see what I am referring to? Good if you do.
If you don't, continue reading, everything will be clear in a few seconds.
Price action
Is neutral price action at this point bearish or bullish?
Bullish.
Most of the action has been happening above $2 and this is clearly bullish.
The upswings are bigger than the down-swings.
Buy volume is higher than sell volume.
The main move is an advance that started in November 2024.
The bigger picture and major trend is bullish.
The fundamentals are getting better everyday; there is nothing bearish on this chart.
Where to next?
New all-time high and higher prices.
How to approach the market
Start with 3-5X. When the bullish action is fully confirmed, the market starts to move higher supported by high volume and marketwide wide action, go all-in. That's the only way to win.
Make the winners pay big. Keep the losers small.
If you don't take risk you can't win in this or any other game.
Thanks a lot for your continued support.
Trading tips
Only risk money you can afford to lose and make sure to do a calculated risk. Not crazy risk nor gamblers risk. 2-3X. As the market advances, 3-5X. When the trend is confirmed, go higher and continue to increase until you max everything out. When our target hits sell everything and never look back. You can buy again when there is a crash or a retrace. Opportunities are endless.
If you secure profits and the pair continues to grow; who cares! Buy one that is safe and secure. Buy a new one that is trading low. Don't go back to the same pair just because you won. Detach. Take some time out. Secure profits. Comeback refreshed and the market will bless you with endless opportunities, it is not going away.
Motivation
Just make sure to win-win-win.
If you can win small, you will eventually win big.
Win, win, win. Make a habit of winning.
Go step by step.
Many people overestimate what they can do in a year but underestimate what they can achieve in a decade. Think long-term.
Instead of tomorrow, next week or next month, think how much money you are going to make in a decade if you start preparing now. What if everything you are doing does not need to yield an instant result? Now you can relax your mind. It will all come to you, but let it come, there is no rush.
Even if you hurry, life will continue to give you what you need, what you earned and not what you think is best. Whatever situation you are in right now is the result of past action. Take responsibility and watch everything grow.
Your future can change if you make the right choices today. You can change everything, start now; what can I do today to make my day better? What is the best action to take? Should I go out and get drunk, sniff a bunch of drugs, or, should I exercise and eat clean, do what it takes to reach my goals?
Choose wisely and watch your profits grow.
Whatever results you get when trading is just a reflection of your mind and the choices you make in your day to day live. Belief and take control.
You have what it takes.
Success is yours.
Namaste.

Possible outcome for $xrp 🚀 XRP Set for a Major Breakout: Bullish Outlook on XRP/USDT
The XRP/USDT chart on the daily timeframe presents an exciting bullish setup that could see XRP rally towards significant highs in the coming months. Let’s break down the key technical insights and what they could mean for traders and investors.
📊 Current Price Action
At the time of analysis, XRP is trading around $2.15. The price has been consolidating in a wide range after an explosive move that took XRP beyond the $3 mark earlier in the year. This consolidation reflects market indecision but also builds up potential energy for a strong directional move.
🏗 Key Levels
Support Zone: $1.70 - $1.85
This zone has been identified as a strong demand area where buyers previously stepped in, preventing further decline. The chart suggests XRP might revisit this area, forming a solid base before a rally.
Immediate Support: ~$2.00 - $2.05
There’s a minor support level here, but the major bullish reversal is expected closer to the deeper support zone.
Resistance Zone: $3.20 - $3.50
This is the target region for the next bullish leg. Historically, this area has capped XRP’s upward movements, but a breakout could open the door to higher prices.
🔑 Bullish Scenario
The chart outlines a potential move where XRP could: ✅ Dip into the lower support range between $1.70 and $1.85, trapping late sellers and inducing demand.
✅ From this accumulation zone, XRP could launch a powerful upward rally.
✅ The rally could target the $3.20-$3.50 resistance area — a key zone that aligns with prior highs.
💡 Why This Setup Looks Bullish
Clear structure of higher timeframe accumulation: The long consolidation phase suggests that XRP may be preparing for a large move, typical after prolonged sideways price action.
Liquidity grab potential: A dip below minor support would shake out weak hands, before a sharp reversal.
Room for upside: Once $3.20 is tested and broken, FOMO (fear of missing out) could drive prices higher, possibly beyond prior highs.
⚠ Risk to Monitor
While the setup points to a bullish move, traders should keep an eye on:
The strength of the $1.70-$1.85 zone. If this level fails, deeper downside could occur.
External factors such as regulatory news or broader crypto market sentiment that might impact XRP’s price action.
🌟 Conclusion
The XRP/USDT daily chart hints at an imminent bullish opportunity as price approaches a key support zone. If the outlined path unfolds, XRP could see significant upside towards the $3.20-$3.50 area in the coming months. For traders, patience and careful risk management at the support levels could position them to ride the next wave of XRP’s move.

XRPUSDT Forming 2017-Style Flag — Major Breakout Loading! BINANCE:XRPUSDT is currently forming a classic bullish flag pattern, a setup that looks strikingly similar to what we saw back in 2017 before CRYPTOCAP:XRP went on a massive run. The price has been consolidating within a tight range, and this could be the calm before a powerful breakout.
Back in 2017, a similar flag formation led to a parabolic uptrend once the resistance was broken. While history doesn’t repeat exactly, this pattern suggests the potential for a significant upside move if the breakout confirms. Traders and investors should keep a close eye on this structure — a breakout from this flag could reignite bullish momentum and open the door for a sharp rally.
This is a buy and hold scenario for those who believe in XRP’s potential, but remember — risk management is key. Always use a stop loss below the flag support to protect your capital. Momentum could build quickly, so stay alert and watch for volume confirmation on the breakout.

XRP - Trade The Range!Hello TradingView Family / Fellow Traders. This is Richard, also known as theSignalyst.
📈XRP has been trading within a range between $2 and $2.35 in the shape of a flat rising broadening wedge pattern in red.
🏹 The highlighted blue circle is a strong area to look for buy setups as it is the intersection of the green support and lower red trendline acting as a non-horizontal support.
📚 As per my trading style:
As #XRP approaches the blue circle zone, I will be looking for bullish reversal setups (like a double bottom pattern, trendline break , and so on...)
📚 Always follow your trading plan regarding entry, risk management, and trade management.
Good luck!
All Strategies Are Good; If Managed Properly!
~Rich

Weekly trading plan for XRP BINANCE:XRPUSDT Price has reached the weekly pivot point, so now it is important to understand the further reaction. Several trend lines can be seen on the chart. If the lower trend line and the level of 2.18 are broken, the price will probably continue its downward movement to the support zone, but it will already renew the local bottom.
Write a comment with your coins & hit the like button and I will make an analysis for you
The author's opinion may differ from yours,
Consider your risks.
Wish you successful trades ! mura

Xrpusdt 4hr tf bearishA bearish head and shoulders pattern is forming.
If it closes below 2.0811 on the 4-hour timeframe, the pattern may be activated.
Targets are 1.95, 1.80, and 1.65.
Invalidation occurs if the high of the right shoulder (2.3355) is broken.

$XRPUSDT 6h Chart. $XRP/USDT 6H chart shows a clean breakout above the descending trendline, followed by a successful retest at the key demand zone.
This confluence suggests bullish momentum is building up.
As long as price holds above the $2.1023 support, the setup points toward a potential 17% upside move targeting the $2.4873–$2.5035 range.
DYRO, NFA

XRPUSDT UPDATEPattern: Falling Wedge
Current Price: $2.2130
Target Price: $4.00
Target % Gain: 70.09%
Technical Analysis: XRP is forming a falling wedge on the 1D chart. Price is approaching the resistance trendline with potential for breakout. Volume looks stable; a breakout above $2.40 may trigger bullish momentum.
Time Frame: 1D

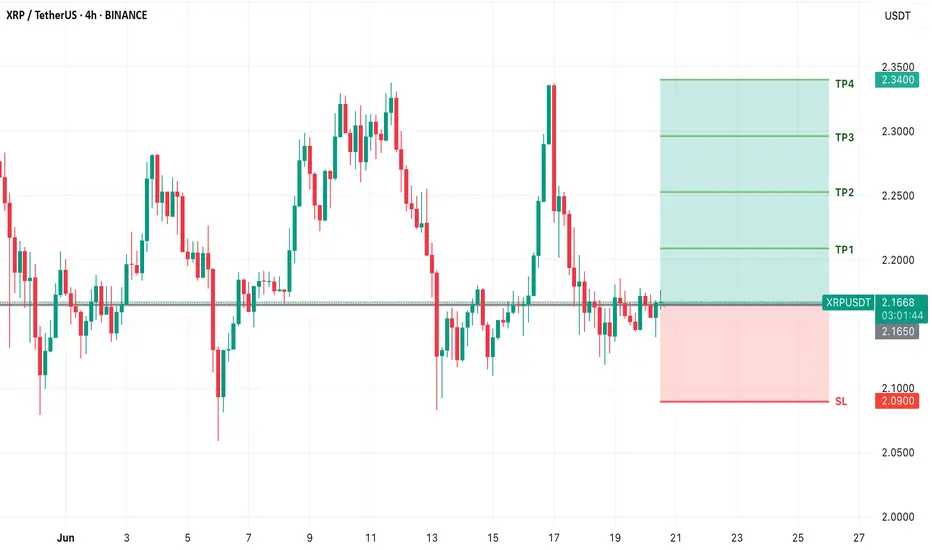
XRP LONG TRADE SETUPXRP/USDT is currently holding at a strong support zone , with a high probability of an upward price move.

3 weeks of breakoutJust put on a long position, looking to hold till Monday open.3 weeks of breakout and false break

HolderStat┆XRPUSD correction from the trend lineOKX:XRPUSDT found footing at 2.09 and now grinds beneath descending resistance. Regaining 2.18 should unlock a glide toward 2.25-2.35 inside the larger bull channel, whereas failure to defend 2.05 risks a trip to 1.95 reload territory.

About the chart that shows a sideways movement...
Hello, traders.
If you "follow", you can always get new information quickly.
Have a nice day today.
-------------------------------------
When you study charts, you will realize how difficult it is to move sideways.
Therefore, depending on how long the sideways movement was before the big wave, the size of the wave is also predicted.
However, in the charts showing sideways movement, the price range and wave size are often known after the wave appears.
This shows that the location of the sideways movement and the size of the sideways wave are important.
-
Looking at the chart above, we can say that it is showing a sideways movement.
However, since the price is located at the lowest price range, it is better to exclude this chart.
The reason is that if it is showing a sideways movement at the lowest price range, it is likely that the trading volume has decreased significantly due to being excluded from the market.
This is because it is likely to take a long time to turn into an upward trend in this state.
-
Looking at the chart above, the price is showing a sideways movement while maintaining a certain interval after rising.
The sideways movement is about 31%, so it may be ambiguous to say that it is actually sideways.
However, if the price moves sideways while maintaining a certain interval after rising, it means that someone is trying to maintain the price.
Therefore, when it shows a movement that breaks through the sideways section, it should be considered that there is a possibility that a large wave will occur.
The wave can be either upward or downward.
Therefore, it is necessary to be careful not to jump into a purchase with the idea that it will definitely rise in the future just because it moves sideways.
A box section is set at both ends of the sideways section.
Therefore, it is recommended to proceed with a purchase in installments when it shows support after entering this box section.
In other words, it is important to check the support in the 1.5-1.9669 section or the 25641-2.6013 section.
You can see that the HA-Low indicator and the HA-High indicator are converging.
Therefore, if this convergence is broken, it is expected that a trend will be formed.
-
Like this, you should measure the price position of the sideways movement and the width of the sideways movement well and think in advance about whether to proceed with the transaction when it deviates from that range.
Otherwise, if you start trading after the wave has already started, you may end up giving up the transaction because you cannot overcome the wave.
Since it is not known when the movement will start once the sideways movement starts, individual investors easily get tired.
Therefore, when the coin (token) you want to trade shows a sideways movement, it is recommended to increase the number of coins (tokens) corresponding to the profit while conducting short-term trading (day trading).
If you do this, you will naturally be able to see how the sideways waves change, and you will be able to hold out until a big wave starts.
I think there are quite a few people who are not familiar with day trading and say they will buy at once when the wave starts.
If you can hold out well against the wave, you will get good results, but there is a possibility that the trade will fail 7-8 times out of 10, so if possible, it is good to get used to the feeling by day trading coins (tokens) that show this sideways pattern.
-
Thank you for reading to the end.
I hope you have a successful trade.
--------------------------------------------------

HolderStat┆XRPUSD reboundBYBIT:XRPUSDT is carving higher lows off 2.03 support through a wedge break, morphing base into bullish momentum. Holding the rising line sustains upside tilt; clearing 2.35 unlocks 2.55 and breakout buzz 🌊

#XRP/USDT#XRP
The price is moving within a descending channel on the 1-hour frame, adhering well to it, and is heading towards a strong breakout and retest.
We are experiencing a rebound from the lower boundary of the descending channel, which is support at 2.21.
We are experiencing a downtrend on the RSI indicator that is about to be broken and retested, supporting the upward trend.
We are heading for stability above the 100 Moving Average.
Entry price: 2.24
First target: 2.27
Second target: 2.30
Third target: 2.35

The FATE of XRP will soon be DECIDED🔥 Hello everyone! I haven't reviewed XRP because it's not the best token for trading. It's purely an institutional token.
But it's painting a very interesting picture. Let's take a closer look:
📊 XRP is trading in a key area of interest and is therefore currently sandwiched between two powerful levels: support at 2.08 and resistance at 2.31. In addition, the price has just broken out of a downward channel and needs time to consolidate above it.
During the last impulse, two gaps formed below: 2.14 - 2.07 and 2.25 - 2.16. And as we know, in 99% of cases, gaps close sooner or later.
XRP is now literally at a crossroads and needs a bullish catalyst to move higher. Because it doesn't need a catalyst to move lower.
⚙️ Metrics and indicators:
Volume - there is a slight divergence between sales volumes and price. But it is practically flat, which means that seller pressure is still high.
Money Flow - in strict harmony with the price. Money leaves during corrections and enters during growth. The asset is completely flat, awaiting news or activity in the market.
📌 Conclusion:
XRP currently looks as unattractive as possible for trades, which means it's the best time! The next direction of price movement will soon become clear, and it will be possible to open positions.
Personally, I am inclined to believe that in the short term, we will go lower, along with the entire market. We will fill the GAP's lower, we may test $2, and then we will go higher.
Also, don't forget that the deadline for XRP ETF applications expires in the summer. And the adoption of the ETF could be just the catalyst we need. And considering that this is an institutional asset:
➡️ as soon as inside information about adoption or non-adoption appears, it will be visible on the chart when all institutional insiders start taking positio ns.
➡️ XRP may see good liquidity inflows right away. No one is holding it as a semi-ETF, as was the case with Ethereum. No one will sell it.
So for now, I'm just sitting back and watching what happens.
Have a great week, everyone!

XRP BREAKING OUT!!!Looking at XRP I see price breaking out of the daily downtrend with a invert head and shoulders pattern. In my experience these patterns have strong impulses in crypto trading and I expect BTC ETH and XRP all to move up from these levels as we are already seeing breakouts to upside on lower timeframes too.
16.June (today) is also big for XRP and SEC case, so potential news regarding the case could attribute to XRP breakout and strong moves up.
Immediate resistance level at 2.60. IF broken, price would then go towards the 3 dollar mark. Must look out for potential profit taking in these levels and in current political sphere should not expect any explosive moves right away.
