This week's Bitcoin planMarked important levels for this week
Also updated the XRP analysis
The author's opinion may differ from yours,
Consider your risks,
DYOR.
XRPUSDT trade ideas

$XRP Eyes $10 as SEC Case ClosesAnalysts predict that XRP CRYPTOCAP:XRP could reach $10 by 2030 after the SEC officially dropped its lawsuit against Ripple. Ripple CEO Brad Garlinghouse confirmed that the regulator will not appeal the court’s decision, marking the end of the legal battle that began in 2020. As of March 24, 2025, XRP CRYPTOCAP:XRP trades at $2.46, up 2.17% in the past 24 hours, with a market cap of $143.29 billion.
Despite bullish prospects, challenges remain. Market volatility and competition from Ethereum and stablecoins could slow growth. Analysts at InvestingHaven believe XRP’s success depends on Ripple’s network expansion, though crypto market instability remains a key factor.
While a 306% rise to $10 by 2030 seems feasible, today’s market is less competitive than in 2017 when XRP CRYPTOCAP:XRP surged 64,000%. Investors are closely watching regulatory changes and macroeconomic conditions that could impact the coin’s future trajectory.

$XRP Adds $100 Billion to Its Market Cap in a YearShort-term charts depict XRP CRYPTOCAP:XRP as highly volatile and, at times, disappointing. Despite favorable external factors, the token has gained only 14.96% over the past year. However, the long-term outlook tells a different story—XRP is up 277.50% year-over-year and 385.54% since Donald Trump's pivotal re-election.
XRP’s market capitalization reflects this surge, skyrocketing by approximately $107.6 billion from $34.7 billion to $142.34 billion. The impact of Trump’s November victory is even more pronounced, with XRP’s market cap jumping $113.7 billion from 28$28.6 billion since November 5.
Most of these gains occurred before January 20, when the most crypto-friendly president in history took office, and SEC hardliner Gary Gensler stepped down—marking a turning point for regulatory sentiment toward digital assets.

xrp price moveXRP/USDT going to beak 1h down trend if this trend break price start to go higher
USDT.D same like before and still in the same box but new 1h triangle its breaking if it break and start to move down all markets gonnna be high

XRP/USDT📊 XRP/USDT Analysis – March 24, 2025 🚀
XRP is currently trading at $2.4585, showing a slight increase of +0.79%. The chart highlights a significant zone around the $2.50-$2.70 range, which could determine the next big move.
📈 Key Technical Levels:
🔹 Resistance: $2.70 - A breakout above this level could push XRP towards $2.90-$3.00.
🔹 Support: $2.30 - If XRP fails to hold, it may retest $2.20 or lower.
The price is approaching a major resistance zone, and the market will need strong volume to break higher. If rejected, a pullback toward the support zone is likely.
📊 Technical Outlook:
✅ Bullish Scenario: A break and close above $2.70 could trigger a rally toward $3.00 and beyond.
❌ Bearish Scenario: Failure to break resistance might lead to a drop back to the $2.30-$2.20 support area.
📢 Recent Fundamental Developments:
SEC Drops Case Against Ripple: The U.S. Securities and Exchange Commission (SEC) has withdrawn its lawsuit against Ripple Labs, ending a four-year legal battle. This decision has significantly boosted investor confidence in XRP.
Presidential Support for Crypto: President Donald Trump acknowledged XRP's potential inclusion in the U.S. government's crypto reserve and anticipates the approval of an XRP-tracking ETF this year. He emphasized his administration's commitment to positioning the U.S. as a leader in the crypto industry.
Analyst Predictions: Analysts are optimistic about XRP's future, with some forecasting a rise to double-digit values within the year. This bullish outlook is supported by increasing institutional interest and favorable regulatory developments.
Market Sentiment: The resolution of Ripple's legal issues and growing institutional adoption have improved market sentiment toward XRP, potentially attracting more investors.

XRP Found Buyers Near 2.35XRP Found Buyers Near 2.35
From our previous analysis, XRP reached our third target and decreased again.
After this taking profit moment, XRP decreased by nearly 9% from 2.59 to 2.35
The price reaction from 2.35 zone looks strong again and also clear, so XRP may resume the bullish trend again as shown on the chart.
XRP may rise again to 2.56, 2.63 and 2.76
You may find more details in the chart!
Thank you and Good Luck!
❤️PS: Please support with a like or comment if you find this analysis useful for your trading day❤️

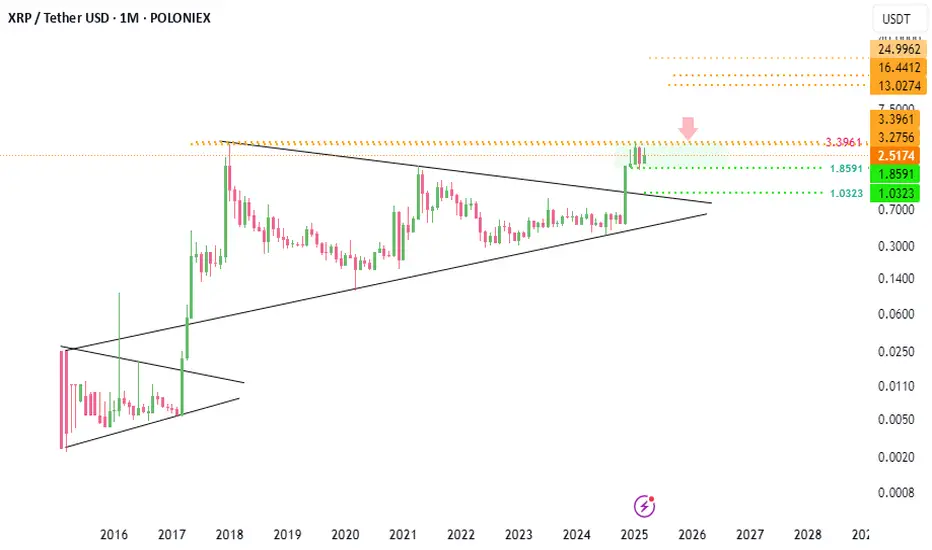
#XRPUSDT (monthly )Beautiful patterns are created with very high energy.
The candles of the extremities of a green boundary are currently exposed and
the flames of the red roof are expected to be volcanic.
Bounce from 200 EMA – Is XRP Ready to Fly?XRP is currently showing bullish momentum as it pushes toward the strong resistance zone after bouncing off the 200 EMA, which is acting as dynamic support. This move follows a consolidation phase above the strong support zone, indicating accumulation.
If the price breaks and sustains above the resistance zone, it could trigger a strong upward move.
DYOR, NFA

XRP/USDT "Ripple vs Tether" Crypto Market Heist Plan🌟Hi! Hola! Ola! Bonjour! Hallo! Marhaba!🌟
Dear Money Makers & Thieves, 🤑 💰🐱👤🐱🏍
Based on 🔥Thief Trading style technical and fundamental analysis🔥, here is our master plan to heist the XRP/USDT "Ripple vs Tether" Crypto Market. Please adhere to the strategy I've outlined in the chart, which emphasizes short entry. Our aim is the high-risk Green Zone. Risky level, oversold market, consolidation, trend reversal, trap at the level where traders and bullish thieves are getting stronger. 🏆💸Book Profits Be wealthy and safe trade.💪🏆🎉
Entry 📈 : "The heist is on! Wait for the breakout (2.0500) then make your move - Bearish profits await!"
however I advise placing Sell Stop Orders below the breakout MA or Place Sell limit orders within a 15 or 30 minute timeframe. Entry from the most recent or closest low or high level should be in retest. I Highly recommended you to put alert in your chart.
Stop Loss 🛑: Thief SL placed at 2.4000 (swing Trade Basis) Using the 4H period, the recent / swing high or low level.
SL is based on your risk of the trade, lot size and how many multiple orders you have to take.
Target 🎯: 1.4000 (or) Escape Before the Target
🧲Scalpers, take note 👀 : only scalp on the Short side. If you have a lot of money, you can go straight away; if not, you can join swing traders and carry out the robbery plan. Use trailing SL to safeguard your money 💰.
📰🗞️Fundamental, Macro, COT, Sentimental, Positioning, Overall Outlook:
╰┈➤XRP/USDT "Ripple vs Tether" Crypto Market is currently experiencing a bearish trend,., driven by several key factors.
🌟⭐🌟Fundamental Analysis
Regulatory: Ripple’s SEC lawsuit remains unresolved; potential ETF approvals (e.g., Bitwise) could lift XRP, but legal risks persist—mixed impact.
Adoption: Ripple’s payment network grows (e.g., U.S. hiring up 75%, FXStreet), but XRP utility lags vs. stablecoins—mildly bullish.
Market Trends: Altcoin interest rises (XRP inflows $38.3M vs. BTC outflow $571M)—bullish.
Tech: XRP Ledger’s speed/low fees remain competitive—bullish.
Supply: 57.45B circulating, 100B total; Ripple’s escrow releases (e.g., 500M unlocked, FXStreet) add pressure—bearish.
🌟⭐🌟Macroeconomic Factors
U.S.: Fed rates at 3-3.5%, PCE 2.6%—USD strength caps XRP gains; weak PMI (50.4) may soften USD—neutral.
Global: China at 4.5%, Eurozone 1.2%, Japan 1%—slow growth boosts safe-havens, indirectly aiding XRP—mildly bullish.
Commodities: Oil at $70.44—stable, neutral for XRP.
Trump Policies: Tariffs (25% Mexico/Canada, 10% China) drive risk-off, potentially lifting XRP vs. USD—bullish.
🌟⭐🌟Commitments of Traders (COT) Data
Speculators: Net long ~40,000 contracts (down from 50,000 post-Jan peak), cooling but still bullish.
Hedgers: Net short ~45,000, steady as firms lock in highs—neutral.
Open Interest: ~90,000 contracts, rising—sustained U.S. interest—bullish.
🌟⭐🌟On-Chain Analysis
Volume: 24h trading volume ~$7.91B (TradingView)—declining buying pressure, bearish signal.
Active Addresses: ~81,000 (CoinRepublic)—stable engagement, neutral.
Dormant Supply: Spiked to 208M XRP ($467M, FXStreet) as long-term holders sell—bearish.
Exchange Supply: 41.75M XRP—high liquidity, potential sell-off risk—bearish.
🌟⭐🌟Market Sentiment Analysis
Retail: 60% short at 2.2000
contrarian upside risk—bullish potential.
Institutional: Mixed—bullish long-term (CoinCodex to $3.26 in 2027), cautious now—neutral.
Corporate: Ripple hedges at 2.50-2.80, neutral stance—stable.
🌟⭐🌟Positioning Analysis
Speculative: Longs target 3.00-3.40, shorts aim for 2.00-1.80
Retail: Shorts at 1.40-1.20—squeeze risk if price rebounds.
Institutional: Balanced, eyeing regulatory clarity.
Corporate: Hedging caps upside pressure.
🌟⭐🌟Overall Summary Outlook
XRP/USDT at 2.2000 shows mixed signals: bullish fundamentals (adoption, tariffs) clash with bearish on-chain (selling pressure) and sentiment (retail shorts, Social media bearishness). Short-term downside to 2.00 looms unless 2.20 holds, with medium-term upside to 2.90 possible if catalysts emerge.
📌Keep in mind that these factors can change rapidly, and it's essential to stay up-to-date with market developments and adjust your analysis accordingly.
⚠️Trading Alert : News Releases and Position Management 📰 🗞️ 🚫🚏
As a reminder, news releases can have a significant impact on market prices and volatility. To minimize potential losses and protect your running positions,
we recommend the following:
Avoid taking new trades during news releases
Use trailing stop-loss orders to protect your running positions and lock in profits
💖Supporting our robbery plan will enable us to effortlessly make and steal money 💰💵 Tell your friends, Colleagues and family to follow, like, and share. Boost the strength of our robbery team. Every day in this market make money with ease by using the Thief Trading Style.🏆💪🤝❤️🎉🚀
I'll see you soon with another heist plan, so stay tuned 🤑🐱👤🤗🤩

XRP Breakout Alert! Time for a 40% Move?OKX:XRPUSDT.P has been trading inside a parallel channel for 66 days since January 16, 2025. Now, the price is breaking out to the upside!
💡 The key strategy here is waiting for a retest if the price successfully flips the channel into support, it could be the perfect entry for a strong upward move.
📈 Potential upside? 40%+ if the breakout holds and momentum kicks in!
🔍 Watch for:
✅ Retest & confirmation of support
✅ RSI & momentum indicators aligning
✅ Heatmap support
✅ Gold cross of MA 200-D/50-D
Are you catching this move? Share your thoughts in the comments! 🚀🔥

BUY - BULLISH AB=CDBINANCE:XRPUSDT looks to be forming a bullish AB=CD pattern, after finding support at 0.618 fib level. Since AB=CD is a continuation pattern. I am expecting the price to reach our projections at point D!

XRP 2.54mXRP is showing strong momentum, and based on technical indicators and recent price action, it is poised to reach the £2.54 mark. Market sentiment, increased adoption, and bullish trends in the crypto space could push XRP toward this target in the near future."

Xrpusdt 1wHello friends
I think it can make a similar move on the weekly time frame, but I'm still waiting for another confirmation, be careful with your purchases, while on the smaller time frame it can make a positive move

XRPUSDT Consolidating at ATHi see the consolidation as very young and it may need both : time and volume to gather serious weight in order to register new all time highs . I see a rare fractalized repetition of H&S patters on the lower timeframes which is up to end a toping pattern in the following days thus granting short term opportunities for shorting with significant R/R ratios


XRP - My toughtsSupport and Resistance Levels
Resistance Levels:
$2.745 – $2.760 zone → Strong resistance from previous swing highs (seen multiple rejections here).
$2.87 – $2.90 → Smaller resistance, visible as a local high.
$3.10 – $3.20 → Psychological round number and a potential target if a breakout occurs.
Support Levels:
$2.12 – $2.15 → Strong support zone (also 50–61.8% Fib retracement area).
$1.95 → Key support level from the bottom of the range, previous major low.
$2.29 – $2.31 → Minor support, marked by local consolidation.
Entry Price for Long Trade (Breakout Strategy)
Aggressive Entry: Around $2.50, on confirmation of higher low and early momentum shift. (Stop loss below $2.30)
Conservative Entry: Wait for breakout above $2.75, retest and support confirmation → enter around $2.76 – $2.78.
Target 1: $2.90
Target 2: $3.10 – $3.20
Stop loss: Below $2.60 or $2.50 depending on your risk appetite.

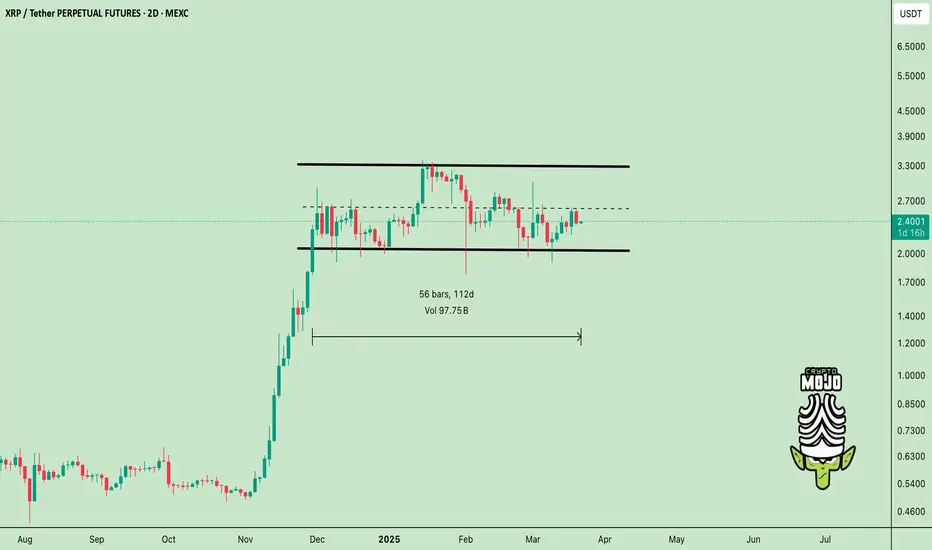
$XRP in the Pressure Zone!CRYPTOCAP:XRP has been stuck in a range for over 3 months!
Price is moving sideways between key support and resistance. A breakout from this zone could lead to a strong move.
The bigger the squeeze, the bigger the pop!
XRPUSDT ANALYSIS #xrp one of my favourite coin in d market has shown a potential clear move on d higher tf, #xrp moving inside a bullish flag, once #btc makes its sell move, I expect #xrp to drop down to 1.5 to complete it's bull structure b4 d bullish continuation move takes effect and my target then will be around 3.5-4$.. those wishing to buy this coin at a low price wait for 1.5 b4 jumping and riding...

XRP decision time !Hello Traders 🐺
In this idea, I want to talk about XRP, because in my opinion, the price is currently sitting at a critical decision-making area—and any moment could lead to a major move. So let’s take a look at the possible scenarios: 👇🔥
🟢 Bullish vs. Bearish – What’s Next?
First of all, we’re still in an uptrend, and as the saying goes: "The trend is your friend until the end." 📈 However, the current pattern forming on the chart—if it plays out—could mark the end of this uptrend, at least in the short term. 😬
On the flip side, there’s also a bullish scenario at play: a potential bull flag pattern. I’ve drawn it on the chart using the orange resistance line. If the price can break above this resistance, we could expect much higher targets—and I’ll definitely update you on those in my next posts. So make sure to follow me and don’t miss the train! 🚂🚀
and also remember :
🐺 Discipline is rarely enjoyable, but almost always profitable. 🐺

XRP Jumps 7% After Surge in Network Activity & Whale BuyingXRP, the digital asset associated with Ripple Labs, has recently experienced a notable price surge, climbing approximately 7% amidst a flurry of on-chain activity and substantial whale accumulation.1 This resurgence has reignited discussions within the crypto community regarding XRP's potential for further growth, particularly in light of a significant uptick in active addresses and evolving regulatory landscapes.
The recent price movement follows a period of relatively stagnant performance, prompting analysts to scrutinize the underlying factors driving the renewed interest in XRP. A key catalyst appears to be the dramatic increase in network activity, with active addresses reaching their highest level since April 2023.2 This surge in transactional volume suggests a heightened level of engagement and utility within the XRP ecosystem, potentially indicating growing adoption and demand.
Furthermore, reports of significant whale accumulation have fueled speculation that large-scale investors are positioning themselves for a potential price rally. These whales, often possessing substantial market influence, are known for their ability to trigger price movements through strategic buying and selling activities.3 Their recent accumulation of XRP suggests a strong conviction in the asset's future prospects.4
The combination of increased network activity and whale buying has created a bullish sentiment among many XRP holders. However, the question remains: will this surge in activity translate into sustained price appreciation? While the current momentum appears promising, several factors could influence XRP's trajectory in the coming weeks and months.
One of the most significant factors influencing XRP's price is the ongoing regulatory landscape, particularly concerning the Securities and Exchange Commission (SEC) lawsuit against Ripple Labs.5 While a partial victory was achieved in the summer of 2023, the SEC's case is not fully resolved. The ongoing legal battle has cast a shadow over XRP's price for several years, creating uncertainty and hindering its potential for wider adoption.
Recently, analysts have begun speculating that the SEC may ultimately drop its four-year lawsuit against Ripple Labs, citing the potential for a more crypto-friendly regulatory environment under a potential Trump administration. This perspective suggests that the market may have already "priced in" the expectation of a favorable resolution, given the potential for significant policy shifts.
The notion that the SEC's actions were anticipated based on potential political shifts adds another layer of complexity to XRP's price dynamics. The argument suggests that market participants have been anticipating a change in regulatory stance, leading to a gradual accumulation of XRP in anticipation of a favorable outcome. If this proves accurate, the recent price surge could represent the beginning of a more sustained upward trend.
However, it is crucial to acknowledge that the regulatory landscape remains fluid and subject to change. While a Trump administration might usher in a more lenient approach to cryptocurrency regulation, there is no guarantee that the SEC will definitively drop its lawsuit. The legal proceedings could continue, potentially leading to further volatility and uncertainty.
Beyond the regulatory environment, XRP's price is also influenced by broader market trends and investor sentiment.6 The cryptocurrency market is known for its volatility, and sudden shifts in sentiment can significantly impact asset prices.7 Therefore, even with positive developments in network activity and whale accumulation, XRP's price could still be affected by external factors.
The utility of XRP within the Ripple ecosystem also plays a crucial role in its long-term price potential. Ripple Labs has positioned XRP as a bridge currency for cross-border payments, aiming to facilitate faster and cheaper transactions.8 The adoption of XRP by financial institutions and payment providers could significantly increase its demand and drive its price higher.
However, widespread adoption has been hindered by the regulatory uncertainty surrounding XRP. As the legal battle with the SEC progresses, potential partners may hesitate to integrate XRP into their operations. A favorable resolution could remove this barrier, paving the way for wider adoption and increased utility.
In conclusion, XRP's recent 7% price jump, fueled by a surge in network activity and whale buying, reflects a renewed interest in the digital asset.9 While the potential for a more crypto-friendly regulatory environment under a potential Trump administration has fueled speculation of a favorable resolution to the SEC lawsuit, the legal landscape remains uncertain.
The increase in active addresses to the highest level since April 2023 indicates a growing level of engagement and utility within the XRP ecosystem.10 Coupled with significant whale accumulation; these factors suggest a potential for further price appreciation. However, the volatility of the cryptocurrency market and the ongoing regulatory uncertainty require a cautious approach.
Ultimately, XRP's long-term price potential will depend on a combination of factors, including regulatory clarity, broader market trends, and the continued adoption of its utility within the Ripple ecosystem. While the recent surge provides a glimmer of optimism, investors should remain vigilant and consider the various factors that could impact XRP's future performance.

XRP Update: SEC Drops Lawsuit, What’s Next for Ripple? Hey traders! 👋
Big news today for XRP – the SEC has dropped its lawsuit against Ripple! After years of legal battles, this is a game-changer that could lead to huge gains for the token. With the legal uncertainty now cleared, Ripple is free to push forward with its vision. But the real question is: what’s next for XRP? 🤔
Looking at the chart, it’s clear that there’s a lot of potential here. We could see a surge in price, especially as the market reacts to this positive news. But here’s the big question: will we first fill the fair value gap or will we surge straight through to the supply box we’ve been eyeing for a while now? 📊
The market might want to fill that fair value gap before heading higher, but if Ripple continues to catch momentum, we might see a rapid push into that supply zone. If we break through that, we could be looking at new highs. 🚀
What’s your take? Will XRP start filling that gap, or will we go straight to the supply zone? Drop your thoughts in the comments!
Happy trading, and let’s see where XRP goes next! 💰📈

XRP BUY SETUPTrade Analysis of the Chart
1️⃣ Market Context
The chart displays a long trade setup with risk management in place.
The price is currently consolidating near the entry zone after a recent bullish move.
A gray supply zone at the top suggests potential resistance.
The risk/reward ratio looks favorable (green zone = profit target, red zone = stop-loss).
2️⃣ Trade Setup Breakdown
🔹 Entry Zone:
The price is currently at a demand/support level around $2.38 - $2.40.
The market might be testing this support before a potential upside move.
🔹 Stop Loss (SL):
Placed below the support zone, around $2.29.
This protects against invalidation of the bullish setup.
🔹 Take Profit (TP):
Set at $2.70 zone, which aligns with the previous resistance.
🔹 Confluence Factors:
✅ Bullish Structure: Higher highs & higher lows suggest an uptrend continuation.
✅ Support Zone: The price is reacting to a demand level, increasing the likelihood of a bounce.
✅ Fibonacci/Breakout Retest: The price may have retested a key breakout level.
3️⃣ Possible Scenarios
📈 Bullish Case:
If price holds $2.38 - $2.40 and forms bullish candles, it could rally toward $2.70 (profit target).
📉 Bearish Case (Invalidation):
If price breaks below $2.29, this trade setup may fail, leading to further downside.
📌 Conclusion
Current Bias: Bullish (long setup in play)
A strong break above $2.45 - $2.50 could confirm upside momentum.
Monitor lower timeframe reactions for confirmation before price moves.

XRP Price Outlook: Is a Deeper Correction on the Horizon?XRP remains in a descending channel, facing strong resistance levels. The price has recently rejected the moving average, signaling potential downside movement. Fibonacci retracement highlights key support at $2.31 (0.786 Fib) and $2.02.
If bearish momentum persists, a retest of the lower trendline is likely. The daily chart shows significant supply zones around 2.3265-3.4106 and 2.5032-2.6487, with additional selling pressure expected between 2.6487 and 3.0153. If the RSI remains below 60-65 within these ranges, XRP could roll over, initiating another bearish impulse wave. Monitoring lower timeframes for signs of trend reversals or uptrend violations can help confirm short entries and long exits.
Should sellers regain control, daily demand zones are identified at 1.5414-1.2843 and 1.1222-1.0033, with Fibonacci retracements reinforcing these levels. Given XRP’s explosive rally in 2024, the monthly and weekly charts feature "tradeable voids" due to expanded-range candlesticks. While these large candles suggest momentum, they also indicate gaps in order flow, which could lead to rapid price movements if a correction occurs.
If XRP sells off, price may decline quickly due to the lack of unfilled orders to absorb movement. Traders should remain cautious and use micro-timeframes to spot early signs of trend shifts and potential entry opportunities.
