XRP may go furthermore!In my opinion, CRYPTOCAP:XRP has the opportunity to surpass $4 in the near future. It needs some rest and range above $3, and then the rising trend will start again.
XRPUSDT trade ideas

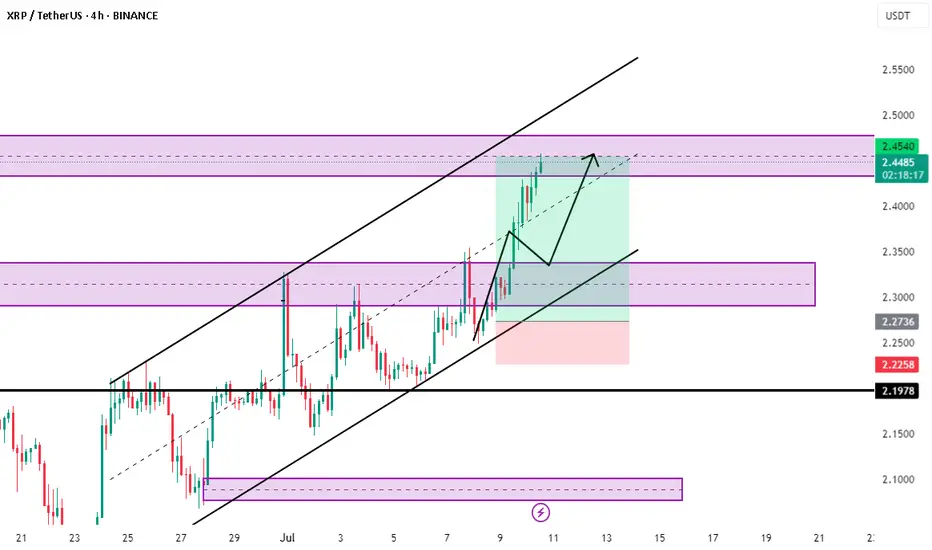
DeGRAM | XRPUSD continues to move in the channel📊 Technical Analysis
● Aggressive breakout from the 8-week green consolidation box has pierced both the purple ’23 trend-cap and inner wedge roof; pull-backs are holding above the prior 2.71 swing, confirming a fresh demand flip.
● Price is now tracking the mid-July parabolic support inside the black rising channel; the next confluence lies at the channel crest / Feb supply 3.11, implied by the 40¢ measured move of the July flag.
💡 Fundamental Analysis
● CME CF announced a cash-settled XRP reference rate for institutional derivatives, boosting open interest and signalling deeper liquidity ahead of the 23 Jul SEC status hearing.
✨ Summary
Long 2.70-2.80; hold above opens 2.88 → 3.11. Invalidate on a 6 h close below 2.60.
-------------------
Share your opinion in the comments and support the idea with a like. Thanks for your support!

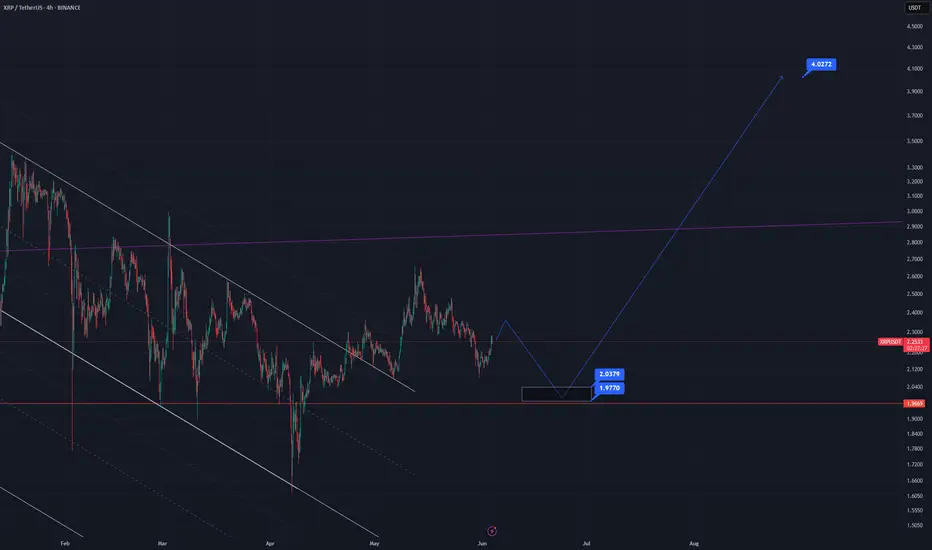
XRP (Ripple) Analysis – July 15, 2025XRP has built significant liquidity between the $1.6 to $3.4 range, making a clear breakout through this zone more challenging.
📊 While a short-term breakout above this range is possible,
the presence of short-term investors likely aiming to take profits above the range increases the probability of a pullback toward the lower bound.
🎯 For a more optimal and lower-risk entry, we should wait for price action near the $2 zone.
If the market shows a strong bullish reaction from that level, it could offer a solid setup for targeting higher levels.

Weekly trading plan for XRPLast week, BINANCE:XRPUSDT demonstrated strong bullish momentum, hitting all our projected targets. Currently, price is facing rejection at resistance. Locally, we've drawn a trendline - a breakdown would initiate downside movement toward support levels. Until that break occurs, we retain potential for new ATH
As always, manage your risk wisely

XRPUSDTEverything went according to the previous analysis and we reached the target of 2.7.
Taking profit at this point would be logical and the marked red area would be a worthwhile price to buy back in the long term.
XRP - Next Upside Price TargetsPlease Refer to our last post:
After we go the first confirmation of the breakout as outlined in the previous post we have now blown through the second confirmation. Instead of the retest we got a break of the LTF high starting an upwards trajectory.
Now price is fighting the 0.786 right around the psychological $3 level. If we are able to hold above the 0.618 ($2.70) and continue our rise past $3. Most likely price will rapidly increase to the yellow dotted line around $3.30 with our high only being $0.10 above that.

XRP | Trade Setup📌 After the breakout from the last high at 2.6, a bullish sequence (green) has now been activated.
📊 These setups typically occur no more than twice per year on any given altcoin, so I’ll be aggressively buying each level at the B-C retracement area.
Trademanagement:
- I'm placing long orders at each level. ((If the price continues climbing, I’ll adjust the trend reversal level (green) accordingly and update my limit orders.)
- Once the trade reaches a 2 R/R, I’ll move the stop-loss to break-even.
- From a 3 R/R onward, I’ll start locking in profits.
✅ I welcome every correction from here on —
but I won’t enter any new positions at these top levels.
Stay safe & lets make money

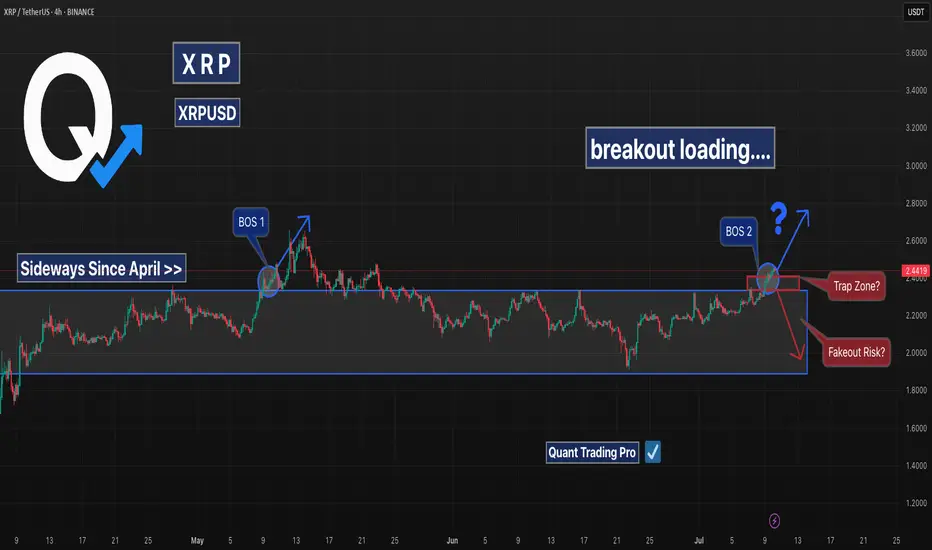
XRP Breakout Loading… or Just Another Trap?XRP has been locked in a sideways range since early April, bouncing between $1.90 and $2.45 for nearly 3 months.
Now, it’s pressing into the top of that range once again — and traders are watching closely for either a confirmed breakout or another fakeout rejection.
📊 Technical Breakdown:
🔹 Sideways Since April: The structure has been consolidative and indecisive.
🔹 BOS 1 + BOS 2: Each break of structure led to temporary rallies — but failed to hold above resistance.
🔹 Trap Zone Identified: ~$2.45–$2.50 has repeatedly acted as a liquidity magnet.
🔹 Fakeout Risk Still Present: Without strong follow-through, this could reverse into the range again.
📈 Breakout Scenario:
• Clean candle close above ~$2.50
• Targets: $2.90 and $3.20
• Look for volume confirmation
📉 Rejection Scenario:
• Wick into resistance + bearish engulfing
• Back to midrange or support zone ~$2.10
XRP-- Ripple Hi everyone
Xrp can have another upward leg and there exists some fundamental support.
So in my opinion these levels are good to buy some.
DYOR!
Good luck

XRP: 100% Gain in couple of weeks!Get ready for 100% surge in the coming weeks, but before that another low to grab liquidity is essential.
Place your buy order around 2$ mark and enjoy.
#XRP Update #2 – July 15, 2025#XRP Update #2 – July 15, 2025
XRP had previously completed the correction of its first impulsive move. Now, it has also completed the correction of the second impulsive leg. The current target for XRP stands around the $3.15 zone.
However, before reaching that level, it first needs to break through the $3.00 resistance area, which previously acted as a strong support/resistance zone. If XRP fails to gain enough volume and momentum for a strong breakout, there is a risk it may reverse from this level, potentially forming a double top pattern.
Because of this uncertainty, I do not recommend taking a long or short position on XRP at this stage.

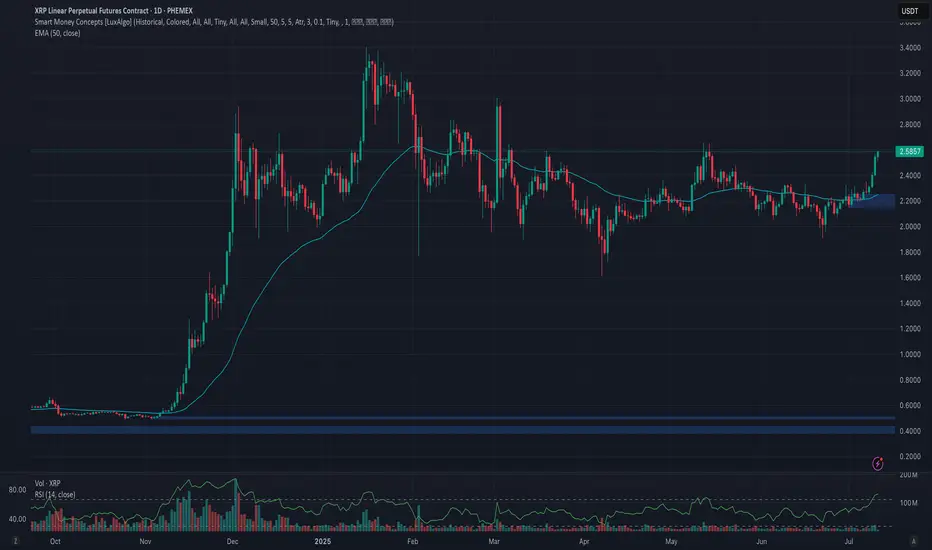
Phemex Analysis #96: Pro Tips for Trading Ripple (XRP)Since our previous analysis on XRP , Ripple’s native token [ PHEMEX:XRPUSDT.P ] successfully broke above the significant $2.45 resistance level, subsequently establishing a higher low around $1.90 on June 22nd. Encouragingly, XRP has surged 10% over the past two days, once again decisively breaking the $2.45 barrier, and is currently trading at around $2.57.
Given XRP’s recent bullish performance and evolving market dynamics, let's explore several potential scenarios that traders should closely monitor.
Possible Scenarios
1. Continued Bullish Momentum (Breakout Scenario)
If XRP maintains its current bullish strength, it’s likely to break above its recent high at $2.65. Such a breakout would signal strong buying interest and may push the price further toward the resistance zones at $2.96 and $3.12.
Pro Tips:
Entry Strategy: Consider entering or scaling positions upon confirmation of a breakout above $2.65, supported by increased trading volume.
Profit-Taking: Strategically take partial profits as XRP approaches the next resistance levels at $2.96 and especially $3.12 to secure gains effectively.
2. Rejected by Strong Resistance Levels (Pullback Scenario)
While the recent rally is promising, broader market conditions currently exhibit limited bullish momentum, indicating caution. XRP may face strong selling pressure at resistance levels like $3.12, leading to a potential price rejection.
In this scenario, XRP could retreat to establish a higher low above the important support at $2.15.
Pro Tips:
Buying Opportunities: Long-term investors might consider gradually accumulating positions if XRP forms a confirmed higher low above the critical support zone around $2.15.
Patience: Wait for clear stabilization signs at support before increasing positions, rather than rushing entries during active retracements.
3. Consolidation within Defined Range (Neutral Scenario)
XRP might enter a period of price consolidation, oscillating between support at $1.91 and resistance at $2.65. This scenario is common when market sentiment is uncertain or awaiting clearer directional cues.
Pro Tips:
Grid Trading Strategy: Utilize grid trading bots to profit systematically from predictable range-bound price movements. Initiate Long Grid bots near support at $1.91 and Short Grid bots near resistance around $2.65.
Stop-Loss: Always set clear stop-losses outside the consolidation range, ensuring protection against unexpected breakouts or breakdowns.
Conclusion
Ripple (XRP) currently offers compelling trade opportunities across different market scenarios. By closely monitoring bullish breakout signals above $2.65, potential pullbacks toward $2.15, and consolidation opportunities within $1.91–$2.65, traders can strategically position themselves to capitalize effectively while managing risks prudently. Always maintain a disciplined approach, pay close attention to broader market trends, and carefully execute trades based on well-defined scenarios.
🔥 Tips:
Armed Your Trading Arsenal with advanced tools like multiple watchlists, basket orders, and real-time strategy adjustments at Phemex. Our USDT-based scaled orders give you precise control over your risk, while iceberg orders provide stealthy execution.
Disclaimer: This is NOT financial or investment advice. Please conduct your own research (DYOR). Phemex is not responsible, directly or indirectly, for any damage or loss incurred or claimed to be caused by or in association with the use of or reliance on any content, goods, or services mentioned in this article.
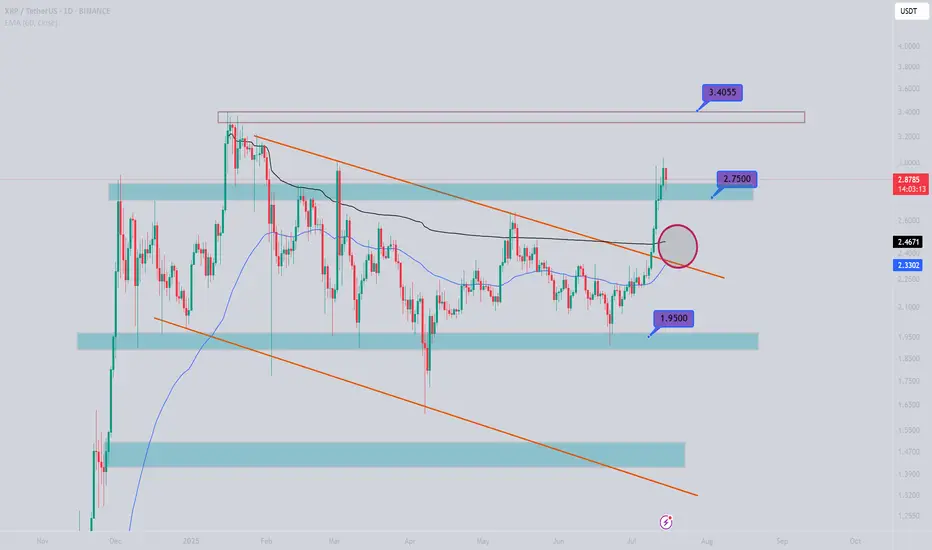
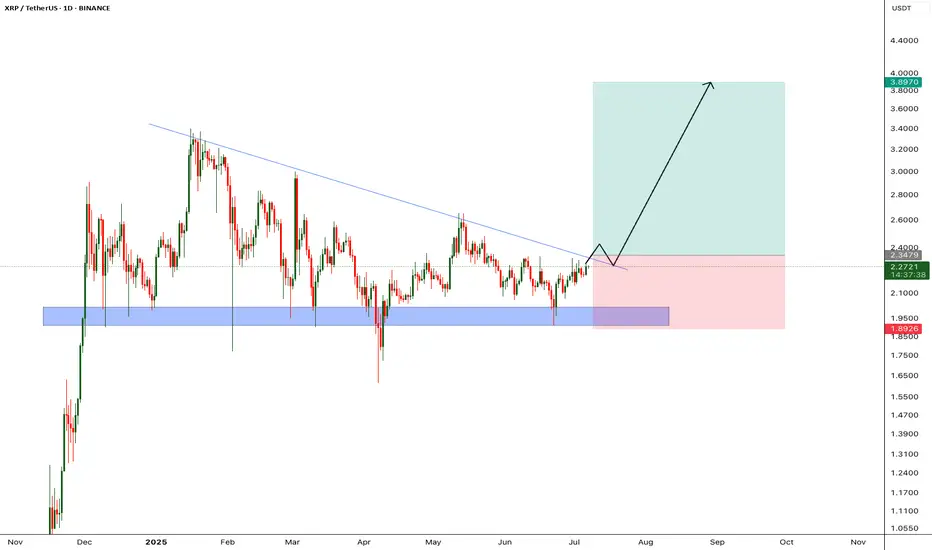
XRP’s Descending Trendline Showdown: Is a Breakout Toward $4From a purely technical‐analysis standpoint (not financial advice), here are a few observations and ideas you can take into xrp/usdt
1. Descending Trendline Resistance
- Price has been making lower highs, forming that yellow descending trendline. A sustained break and close above it (on higher‐than‐average volume) would be a strong bullish signal.
- If price rejects at the trendline again, that often implies more consolidation or another leg downward, so watch how price reacts if/when it retests that line.
2. Moving Average Context
- It looks like the market is hovering near or just below a key moving average (blue line). If the price can reclaim that moving average and stay above it, it typically signals renewed bullish momentum. Conversely, continued closes below it can cap upside.
3. Key Support Zones
- The pink/gray box in the chart (roughly the 2.0–2.1 area) seems to be an important support region; buyers have stepped in there before.
- Below that, the 1.77–1.80 area looks like a major support “floor” (dotted line). If price were to break below that, it could trigger a deeper pullback.
4. Potential Upside Targets
- The horizontal level around 3.40 is the next big resistance if price can break out above the descending trendline.
- If bulls really take over and push through that 3.40 zone, a run toward 3.90–4.00 (as shown by the arrow) becomes more plausible.
5. Watch Volume and Momentum**
- Pay attention to volume on any breakout. A low‐volume push above the trendline can be a fakeout, whereas a strong volume surge confirms conviction.
- Oscillators (RSI, MACD, etc.) can help you gauge whether momentum is building or fading as price approaches resistance.
Overall, a breakout above the descending trendline plus a reclaim of the moving average would favor upside toward the mid‐3s or higher. Failure to break out, however, might lead to another test of that 2.0–2.1 support or even the 1.77 floor. Keep risk management in mind either way.

XRP/USDT MEXCAll 5 indicators with a short box and Fibonacci trend. My short is at 2.54. I'm hoping for sub $2 prices

$XRP - Falling Wedge Breakout is CookingRipple is forming a simple yet perfect setup
There is a strong horizontal support level of $2.11 that was established back in December of 2024 and has held the price perfectly (with only one breakdown) since then. Moreover, at that time a massive Falling Wedge started forming and is still doing it up to this day.
Talking about resistances, there is a $2.45 one. Not very strong, but solid enough to form a decent horizontal channel within which the price moves.
So, as the result we have the following structure: CRYPTOCAP:XRP has been consolidating above strong support for 6 months already and formed a pattern that suggest upcoming upward movement. The perfect entry spot in LONG will be at the breakout&retest of the both $2.45 resistance and Falling Wedge resistance (they perfectly correlate) .
Target zone of $3.5 - $4 can be reached within the next 3 - 5 months.

XRP Pattern Repeats—Next Move to $2.34?The XRP/USDT 1-hour chart is showing a compelling setup that may mirror a previously bullish price pattern. The left side of the chart highlights Pattern 1, which played out after a period of sideways consolidation followed by a breakout, resulting in a strong upward move. Now, price action is repeating a similar structure with nearly identical conditions forming.
In Pattern 1, XRP consolidated in a tight range, flipped the trend indicator from red to blue (suggesting a momentum shift), and then surged higher. This same transition is occurring again in the current market phase. Price has reclaimed the trend baseline, which has turned blue, hinting at growing buyer strength.
The idea here is that XRP could be preparing for another impulsive move to the upside, identical to what happened before. The setup is visually marked with a trade box showing entry, stop-loss, and target levels.
Trade Idea Based on Current Pattern
• Entry: 2.2849
• Target: 2.3436
• Stop-loss: 2.2520
• Reward-to-Risk (R:R): ≈ 1.78
• Potential Gain: 2.57%
• Potential Loss: 1.44%
The structure favors a long position, as long as the price holds above the 2.25–2.26 support range. A break below this could invalidate the setup and trigger the stop-loss. If the breakout is confirmed with volume, XRP could move rapidly toward the 2.34 level and possibly beyond.
This kind of fractal behavior, where patterns repeat themselves in similar market conditions, is common in crypto. With the trend indicator already flipping bullish and price forming higher lows, the probability of continuation looks solid—especially for short-term traders.
As always, trade with proper risk management, and be cautious of volatility that can trigger stop-hunts in tightly ranged zones.

XRP - Huge breakout incomingXRP price is retesting it's descending trendline, in the past price got rejected from this trendline multple times, however im expecting price to breakout from this trendline since we almost at the last 2 quarters of bull run.
We will enter the trade after candle closes above the trendline
Entry Price: 2.34
StopLoss: 1.89
TP1: 2.5981
TP2: 2.8543
TP3: 3.2796
TP4: 3.8676
Like and follow.
Cheers
GreenCrypto
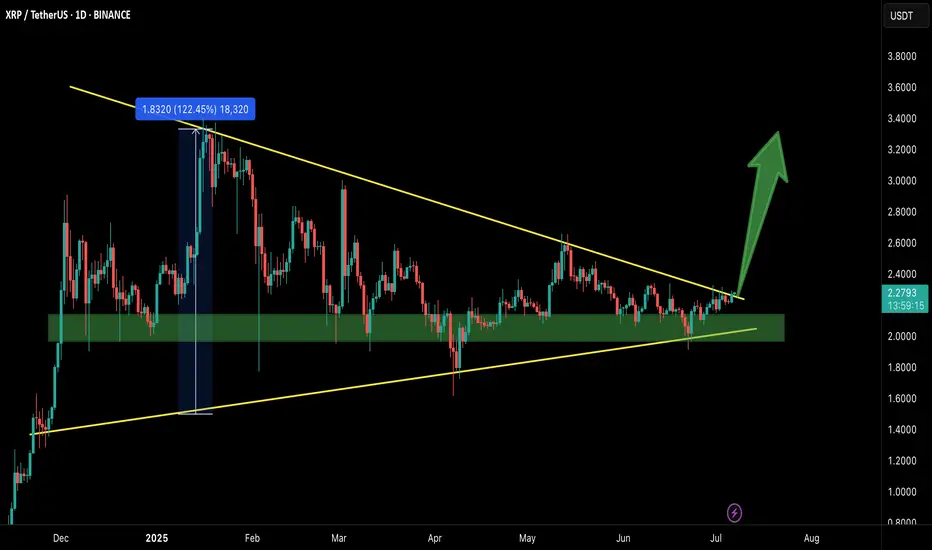
XRP/USDT – Breakout Confirmed!Hey Traders — if you're into high-conviction setups with real momentum, this one’s for you.
XRP has finally broken out from the massive symmetrical triangle on the 1D timeframe after holding the green support zone like a champ.
This structure has been compressing for months, and with this breakout, momentum could be shifting in favor of the bulls.
Entry: Current Market Price (CMP)
Add More: On dips above $2.20
Targets: $2.60 / $2.95 / $3.40 / $3.80
Stop Loss: $2.05
Leverage: 5x–10x
As long as price stays above the breakout zone, this setup holds strong potential. Keep a close eye for volume confirmation and follow-through.
Let’s see how this plays out. Will update as it unfolds.
XRP head to 7$XRP will make it the 2nd biggesst crypto in histiry surprassing Ethereum once ET Network is suffeering the biggest sells ever by traders.
Everyone on the other side is beting on Bitcoin, making it bigger but with room for others like XRP the best performing crypto in history.

DeGRAM | XRPUSD seeks to retest of the resistance line📊 Technical Analysis
● A third rebound from the rising purple support (green dots) printed a bullish engulfing that has already forced price back above the short-term grey down-trend, signalling a momentum shift.
● XRP is now coiling inside a contracting triangle capped by the purple resistance line near 2.40; the 18 ¢ consolidation width implies 2.45 on a break, while the April pivot at 2.65 lines up with the upper channel for the next objective.
💡 Fundamental Analysis
● Ahead of the 23 July SEC – Ripple status hearing, HSBC’s digital-asset unit announced a pilot using XRP for cross-border settlement, lifting social volume and spot bids.
✨ Summary
Buy 2.10-2.20; confirmed close above 2.40/2.45 targets 2.60-2.65. Thesis void on a 16 h close below 1.98.
-------------------
Share your opinion in the comments and support the idea with a like. Thanks for your support!

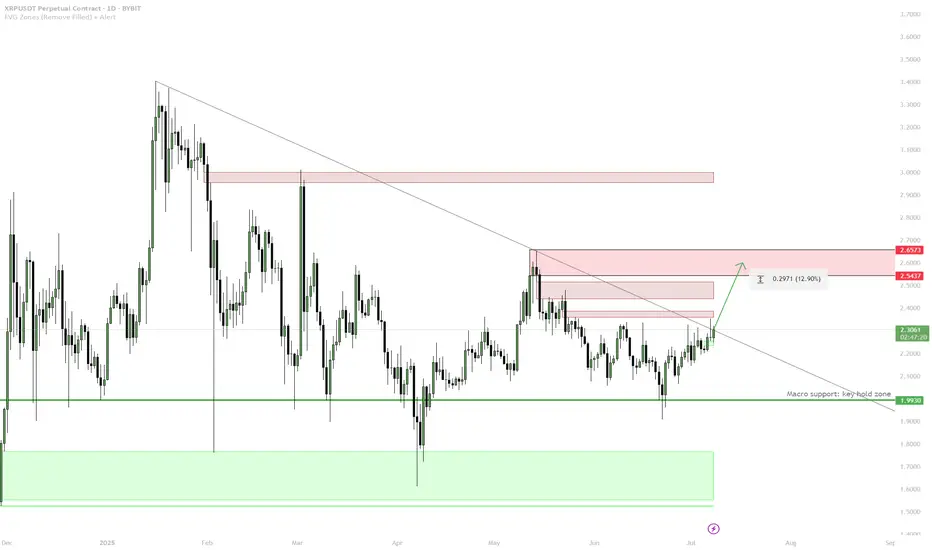
XRP — Macro Support Hold & Redbox Target1. Macro support (1.99) held — bullish bias
2. Enter on confirmed break and hold above trendline
3. TP1: 2.54–2.60 (first redbox)
4. TP2: 2.65+ (next supply)
5. Stop: Below macro support = invalid
XRP/USDT UPDATE📢 XRP/USDT UPDATE
Trade idea played out nicely ✅
🔼 Entry: Around $2.35
🏁 Exit: $2.45 — I'm out!
Secured clean profits before resistance zone ⚡
paid members only access
Sometimes the best move is knowing when to exit 🧠
More setups on the way — Follow for sniper trades 🎯
#XRP #CryptoTrading #Altcoins #Binance #TA
XRPUSDT BINANCE:XRPUSDT Price broke above the downtrend line but faced resistance at 2.2770 dollars and started correcting. Key supports are at 2.1900 and 2.0800 dollars. If it bounces, resistances to watch are 2.2770, 2.3600, and 2.4620 dollars. Price is currently between key levels.
Key Levels:
Support: 2.1900 – 2.0800
Resistance: 2.2770 – 2.3600 – 2.4620
⚠️Contorl Risk management for trades.
