$PEPE chartCRYPTOCAP:PEPE cup and handle. Cup in the making? CRYPTOCAP:PEPE has one of the highest beta as a meme coin and is a high beta proxy for Ethereum. ETH is on its way to $4000 now
XRPUSDT trade ideas
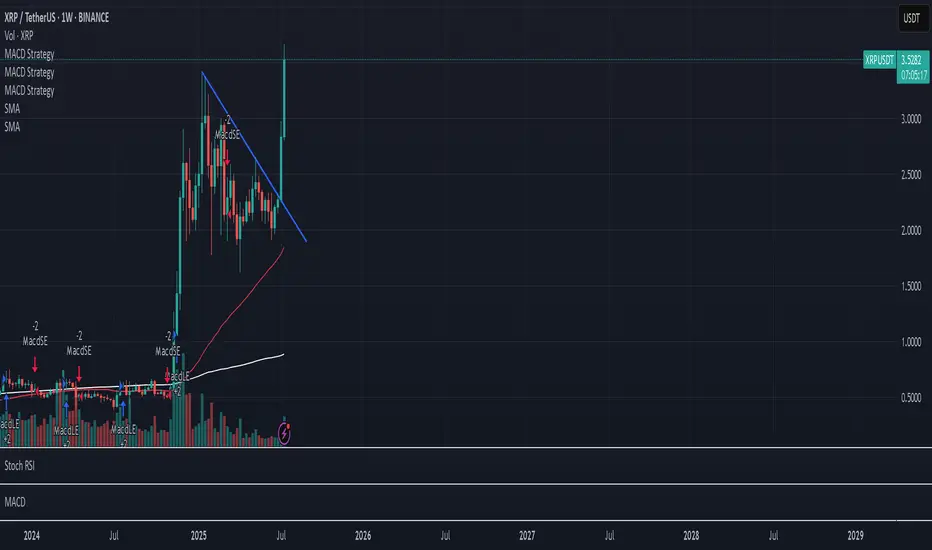
XRP - ContinueRipple's price movement in the main channel and its decline or decrease to the lowest price level has been completed, and we can expect an increase in the price of this currency in the crypto market. Ripple's analysis has recorded a 200% increase so far, which you can see the results of in past analyses.
Sasha Charkhchian

Bullish Flag on #XRPWe can see a clear picture of #XRP forming a bull flag, it will stay and consolidate as traders take off of profit. Price will have a new accumulation zone prior to another leg up, its a matter of time it makes ATH. As the price is discovering new zone, a fib golden zone puts it at $ 5.6 and a bull flag to $10 for sure.
The bears need to step in and invalidate the breakout that's to happen before their eyes and suppress the price from discovering in order to secure profit.

Good moment for try to Buy XRPGood moment for try to Buy XRP. We are in a sideways trend and are now approaching its upper border. We will take a breakout. Stop under the lower line of the channel. We'll see

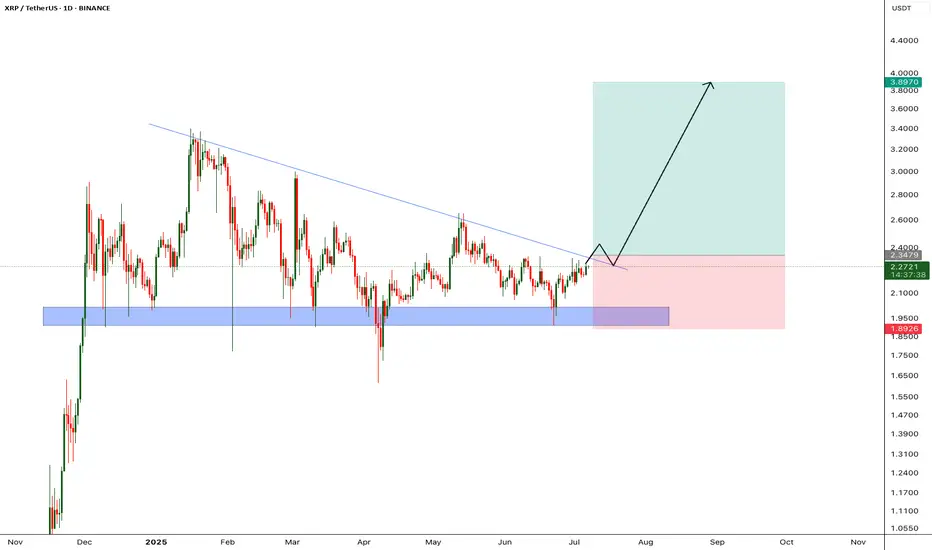
XRP - Time to buy again! (Update)It seems the price is forming a head and shoulders pattern, which, if correct, suggests a good price increase in the coming days. However, we should wait for the pattern to fully complete.
Best regards CobraVanguard.💚

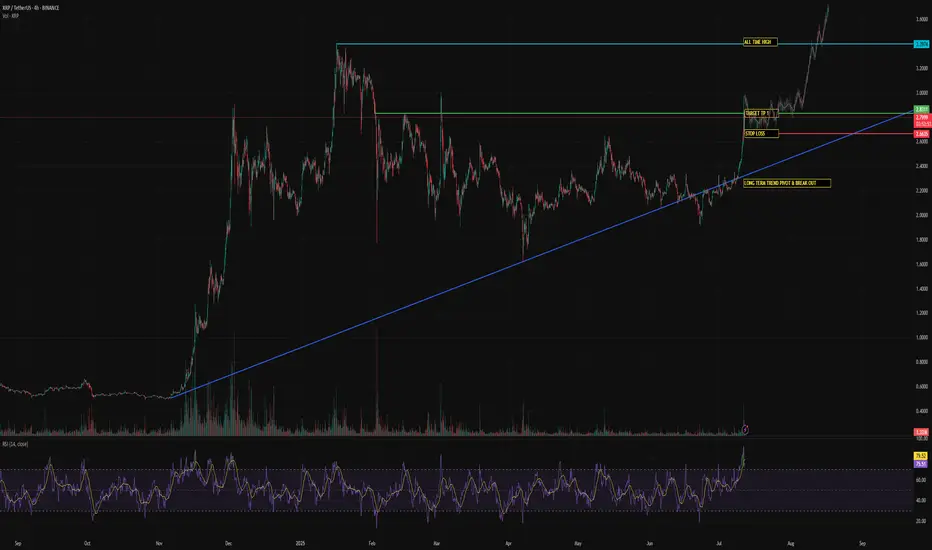
Lingrid | XRPUSDT Potential Upside BreakoutBINANCE:XRPUSDT is currently retesting its upward trendline and support near 2.20 after failing to hold above the June high. The asset remains in a higher-low structure with repeated attempts to break resistance around 2.35, indicating bullish accumulation. If the price holds this trendline, an upside breakout toward the 2.45 target zone becomes more likely.
📈 Key Levels
Buy zone: 2.20–2.17 (trendline + horizontal support)
Sell trigger: break and close below 2.15
Target: 2.45 resistance, followed by potential toward 2.60
Buy trigger: bullish reversal above 2.20 confirming trendline defense
💡 Risks
Breakdown below 2.20 opens downside risk to 1.92 support
Flat momentum may lead to range-bound movement
Resistance at 2.45 could stall rallies without volume support
If this idea resonates with you or you have your own opinion, traders, hit the comments. I’m excited to read your thoughts!

XRP Pattern Repeats—Next Move to $2.34?The XRP/USDT 1-hour chart is showing a compelling setup that may mirror a previously bullish price pattern. The left side of the chart highlights Pattern 1, which played out after a period of sideways consolidation followed by a breakout, resulting in a strong upward move. Now, price action is repeating a similar structure with nearly identical conditions forming.
In Pattern 1, XRP consolidated in a tight range, flipped the trend indicator from red to blue (suggesting a momentum shift), and then surged higher. This same transition is occurring again in the current market phase. Price has reclaimed the trend baseline, which has turned blue, hinting at growing buyer strength.
The idea here is that XRP could be preparing for another impulsive move to the upside, identical to what happened before. The setup is visually marked with a trade box showing entry, stop-loss, and target levels.
Trade Idea Based on Current Pattern
• Entry: 2.2849
• Target: 2.3436
• Stop-loss: 2.2520
• Reward-to-Risk (R:R): ≈ 1.78
• Potential Gain: 2.57%
• Potential Loss: 1.44%
The structure favors a long position, as long as the price holds above the 2.25–2.26 support range. A break below this could invalidate the setup and trigger the stop-loss. If the breakout is confirmed with volume, XRP could move rapidly toward the 2.34 level and possibly beyond.
This kind of fractal behavior, where patterns repeat themselves in similar market conditions, is common in crypto. With the trend indicator already flipping bullish and price forming higher lows, the probability of continuation looks solid—especially for short-term traders.
As always, trade with proper risk management, and be cautious of volatility that can trigger stop-hunts in tightly ranged zones.

XRP - Huge breakout incomingXRP price is retesting it's descending trendline, in the past price got rejected from this trendline multple times, however im expecting price to breakout from this trendline since we almost at the last 2 quarters of bull run.
We will enter the trade after candle closes above the trendline
Entry Price: 2.34
StopLoss: 1.89
TP1: 2.5981
TP2: 2.8543
TP3: 3.2796
TP4: 3.8676
Like and follow.
Cheers
GreenCrypto
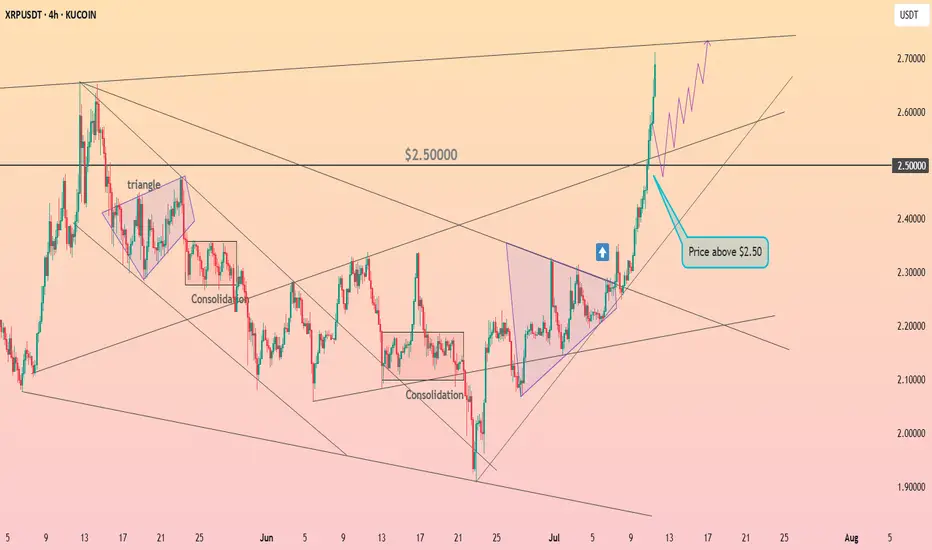
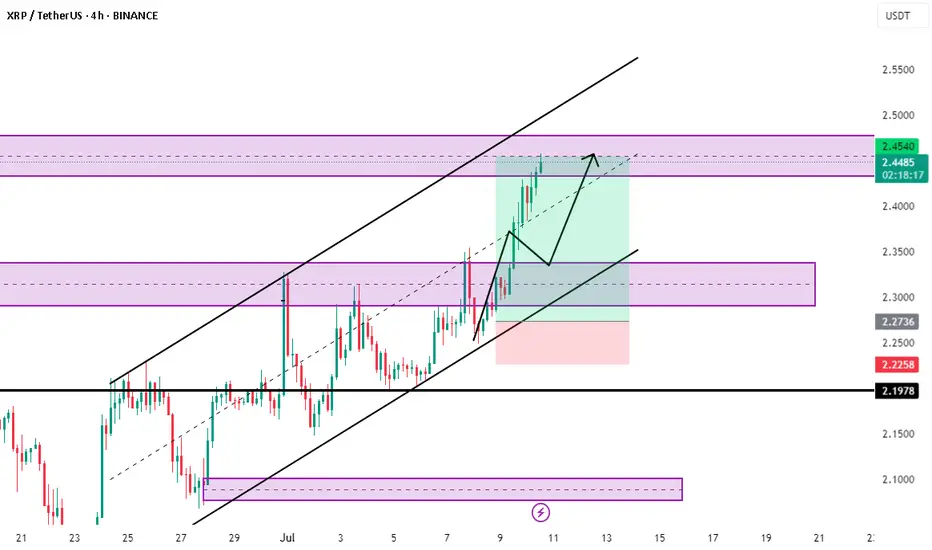
HolderStat┆XRPUSD above the $2.5KUCOIN:XRPUSDT has rallied sharply, breaking above the key $2.50 resistance following multiple consolidation and triangle patterns. Momentum remains strong, and price structure supports continuation toward the $2.75 resistance zone.
XRPUSDT → Resistance ahead. Correction before growthBINANCE:XRPUSDT is rising after breaking through consolidation resistance. Bitcoin's rally supported the overall market momentum, but a new resistance zone lies ahead...
Bitcoin is testing its ATH and updating it, but is facing pressure and forming a false breakout. A correction in the flagship coin could trigger a correction in XRP, but if Bitcoin continues to storm the 112K area without a pullback, followed by a breakout, the market could find support and continue to rise.
After XRP broke through resistance, the coin entered a distribution phase and is testing an important resistance zone of 2.4488 - 2.4772. The inability to continue growth, a false breakout, and price consolidation in the selling zone could trigger a correction.
Resistance levels: 2.4488, 2.4772, 2.6524
Support levels: 2.3587, 2.3375, 2.2455
Despite breaking through resistance, XRP is still in a local downtrend. Pressure on the market is still present. The formation of a false breakout will indicate that growth is limited for now. However, if the price consolidates above 2.4772 and begins to break out of the local structure, we can expect growth to continue.
Best regards, R. Linda!

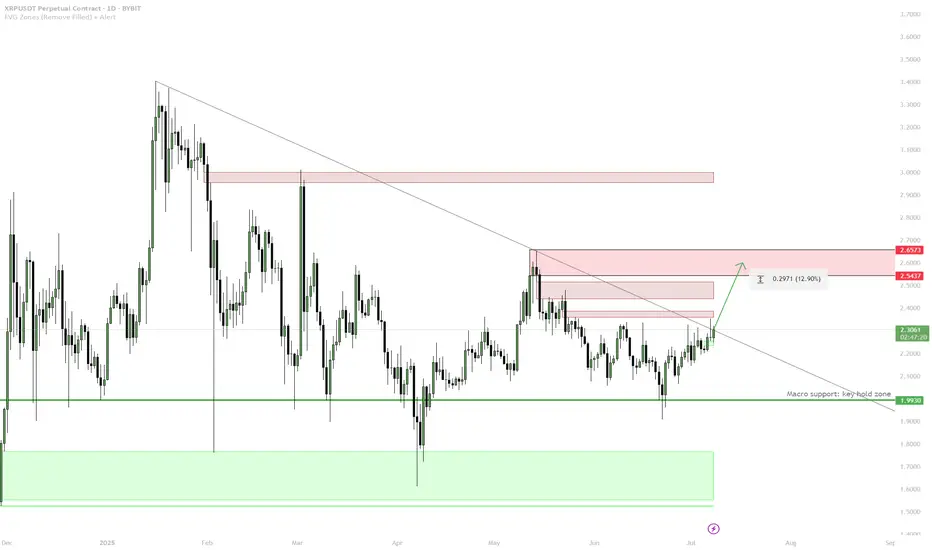
XRP — Macro Support Hold & Redbox Target1. Macro support (1.99) held — bullish bias
2. Enter on confirmed break and hold above trendline
3. TP1: 2.54–2.60 (first redbox)
4. TP2: 2.65+ (next supply)
5. Stop: Below macro support = invalid
XRP head to 7$XRP will make it the 2nd biggesst crypto in histiry surprassing Ethereum once ET Network is suffeering the biggest sells ever by traders.
Everyone on the other side is beting on Bitcoin, making it bigger but with room for others like XRP the best performing crypto in history.

XRP breakout above $2.29 Confirmed – Is $4 the Next Stop? #LONGAt the inflection point of $2.29, the long-term trend broke out, suggesting the price could run up to $3.00 and potentially $3.40 with continued positive sentiment. A news catalyst could trigger a rapid spike towards $4.00.
At $2.70, #FOMO traders entered. Following a short period of consolidation and breakout, the price reached a high of $2.90.
The price action remains bullish and is currently in a zone of interest that could attract previous investors and traders. A news catalyst is key to bringing in the necessary liquidity and volume. If buyers can hold the price within this zone, we may see a continuation of the pattern.
A retest of $2.90 followed by a slight pullback to $2.70 is possible before the uptrend resumes.
XRP - Next Upside Price TargetsPlease Refer to our last post:
After we go the first confirmation of the breakout as outlined in the previous post we have now blown through the second confirmation. Instead of the retest we got a break of the LTF high starting an upwards trajectory.
Now price is fighting the 0.786 right around the psychological $3 level. If we are able to hold above the 0.618 ($2.70) and continue our rise past $3. Most likely price will rapidly increase to the yellow dotted line around $3.30 with our high only being $0.10 above that.

XRP/USDT UPDATE📢 XRP/USDT UPDATE
Trade idea played out nicely ✅
🔼 Entry: Around $2.35
🏁 Exit: $2.45 — I'm out!
Secured clean profits before resistance zone ⚡
paid members only access
Sometimes the best move is knowing when to exit 🧠
More setups on the way — Follow for sniper trades 🎯
#XRP #CryptoTrading #Altcoins #Binance #TA
XRPUSDT BINANCE:XRPUSDT Price broke above the downtrend line but faced resistance at 2.2770 dollars and started correcting. Key supports are at 2.1900 and 2.0800 dollars. If it bounces, resistances to watch are 2.2770, 2.3600, and 2.4620 dollars. Price is currently between key levels.
Key Levels:
Support: 2.1900 – 2.0800
Resistance: 2.2770 – 2.3600 – 2.4620
⚠️Contorl Risk management for trades.

Ripple (XRP): Looking For Breakout | Possible Good Buy EntryRipple has had an insane buy-side volume lately, and the price is currently testing the local resistance zone (neckline area). We are looking for a proper breakout from this area (which will happen if we keep current buyside momentum as it is). As soon as we get it, we are going to look for a buy entry, which should lead the price towards our major target of the upper resistance zone.
Swallow Academy

Xrp:The fate of Ripple in the long termhello friends👋
After a good price growth that we had, you can see that the buyers gradually exited and a triangle pattern was formed.
Now, according to the specified support, it should be seen whether buyers support Ripple or not...
You have to wait and nothing can be said until the failure of the pattern, but we suggest that you buy step by step with capital and risk management in the identified areas that are very good supports and move to the set goals.
And in the end, we must say that don't forget that we are in a strong upward trend, that the probability of the continuation of the Bister trend is the possibility of a fall...
🔥Follow us for more signals🔥
*Trade safely with us*

Long XRP, fast 11% profit✅ 1. Buy Zone Identified
The “Buy zone” is a green area where the price has recently been consolidating (moving sideways).
💡 If the price breaks above this level or shows strength here, it could be a good opportunity to enter a long (buy) trade.
🎯 2. Take Profit Target: +11%
The “Take Profits” line above the buy zone suggests a potential 11% upside.
This is where you might want to sell your position and lock in gains if the price moves in your favor.
🛑 3. Stop Loss: -7%
The “Stop Loss” is clearly marked below the buy zone, with a 7% risk.
This is your safety net , if the price falls to this level, the trade automatically closes to prevent further loss.
📦 4. Volume Profile (on the right side)
The blue and yellow bars show the Volume Profile, which highlights price levels where most trading activity happened.
🔹 The cluster near the buy zone means there was strong interest in this area — it could act as a support zone.
🚀 Simple Summary
The chart shows a bullish setup for XRP/USDT.
There’s a clear Buy zone where price is trying to break higher.
The profit target is +11%, and the stop loss is -7%.
Volume data supports this as an important price zone.


XRP Technical Analysis – Massive Breakout in Play!After months of tight consolidation inside a symmetrical triangle, XRP/USDT has finally broken out with strong bullish momentum on the daily timeframe.
🔹 Chart Pattern: Symmetrical Triangle
🔹 Breakout Confirmation: Daily candle closed above the descending trendline resistance
🔹 Support Zone: ~$2.00 – $2.20 (Held multiple times since April)
🔹 Breakout Level: ~$2.48 – $2.50
🔹 Next Resistance Levels:
▫️ $2.62 – Minor horizontal resistance
▫️ $3.39 – Major resistance from previous highs
▫️ $4.92 – Long-term macro target (measured move from triangle)
🧠 Why does this breakout matter?
✅ Strong Volume: Breakout happened with increased volume – a sign of genuine breakout
✅ Multi-month Base: The longer the consolidation, the stronger the breakout
✅ Support Respect: XRP respected the demand zone repeatedly, showing accumulation
✅ Momentum Building: A clean break could trigger trend-following bots and new buyers

DeGRAM | XRPUSD seeks to retest of the resistance line📊 Technical Analysis
● A third rebound from the rising purple support (green dots) printed a bullish engulfing that has already forced price back above the short-term grey down-trend, signalling a momentum shift.
● XRP is now coiling inside a contracting triangle capped by the purple resistance line near 2.40; the 18 ¢ consolidation width implies 2.45 on a break, while the April pivot at 2.65 lines up with the upper channel for the next objective.
💡 Fundamental Analysis
● Ahead of the 23 July SEC – Ripple status hearing, HSBC’s digital-asset unit announced a pilot using XRP for cross-border settlement, lifting social volume and spot bids.
✨ Summary
Buy 2.10-2.20; confirmed close above 2.40/2.45 targets 2.60-2.65. Thesis void on a 16 h close below 1.98.
-------------------
Share your opinion in the comments and support the idea with a like. Thanks for your support!

$XRP - Falling Wedge Breakout is CookingRipple is forming a simple yet perfect setup
There is a strong horizontal support level of $2.11 that was established back in December of 2024 and has held the price perfectly (with only one breakdown) since then. Moreover, at that time a massive Falling Wedge started forming and is still doing it up to this day.
Talking about resistances, there is a $2.45 one. Not very strong, but solid enough to form a decent horizontal channel within which the price moves.
So, as the result we have the following structure: CRYPTOCAP:XRP has been consolidating above strong support for 6 months already and formed a pattern that suggest upcoming upward movement. The perfect entry spot in LONG will be at the breakout&retest of the both $2.45 resistance and Falling Wedge resistance (they perfectly correlate) .
Target zone of $3.5 - $4 can be reached within the next 3 - 5 months.
