#XRPI would look for a 1.80 1.90 low but don’t count on dipping much below 2 usd if at all. Set buy targets from 1.60’s up to low 2.00’s like 2.13
As much as I hate to admit it the XRP is truly an army not to mention that chart looks super strong esp with fed rate cuts coming within the year or t least announce a new fed chair
XRPUSDT trade ideas

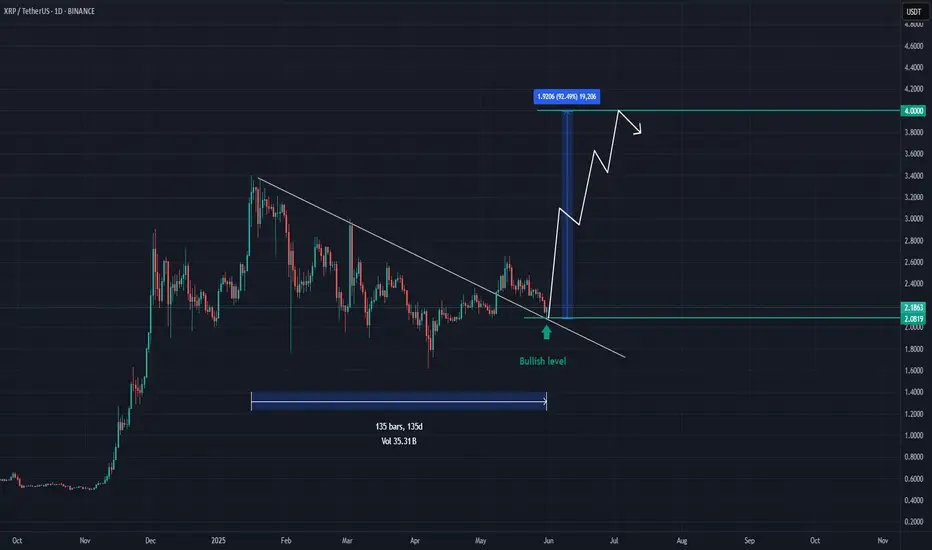
XRP - This is one of many great opportunitiesXRP is reaching a solid level of $2.1.
I believe this level will attract investors for the following reasons :
Technicals :
After breaking the main resistance trendline, XRP is now reaching a solid support level presented in green.
Price action :
- In accumulating since Jan '25
- Resisted to last market dumps
Beyond technicals :
- Very strong community
- Real services and strong team
Market sentiment :
The investors are now looking for a strong asset to invest in. They may switch their alts to any coin that shows strenght. For now, XRP is on the top list.
Recap :
- Risks : bad news from the team , whales dumping , ...
- Main Target : $4
- Reward : near 100%
BITSTAMP:XRPUSD COINBASE:XRPUSD BYBIT:XRPUSDT.P CRYPTOCAP:XRP KUCOIN:XRPUSDT
XRP is making moves!Will it break $3, or drop back to $2? Previous Cycles showed that a correction might be next in line for the crypto market as a whole. Which means, if it happens, altcoins will get affected a lot...Do not get shaken out, after the correction expect a huge rally, but for now...it might be a perfect point to secure some profit.
Not investment advice.
#xrp #bitcoin #crypto #short #analysis
Xrpusdt 4hr time frame bullish iH&SComing from bearish 1st tp area (fib 1.217) from our previous bearish activated pattern " " and now invalidated is a bullish strong move on my POV, as the majority of shorters are taking their profit at the nearest support as sign of fear making a new trend and now formed a bullish ih&s pattern.
Targets are 2.45, 2.6 and 2.8. currently trading above 100 and 200 daily ma which is sign of good bullish move.
Pattern invalidation if closes below 2.15.

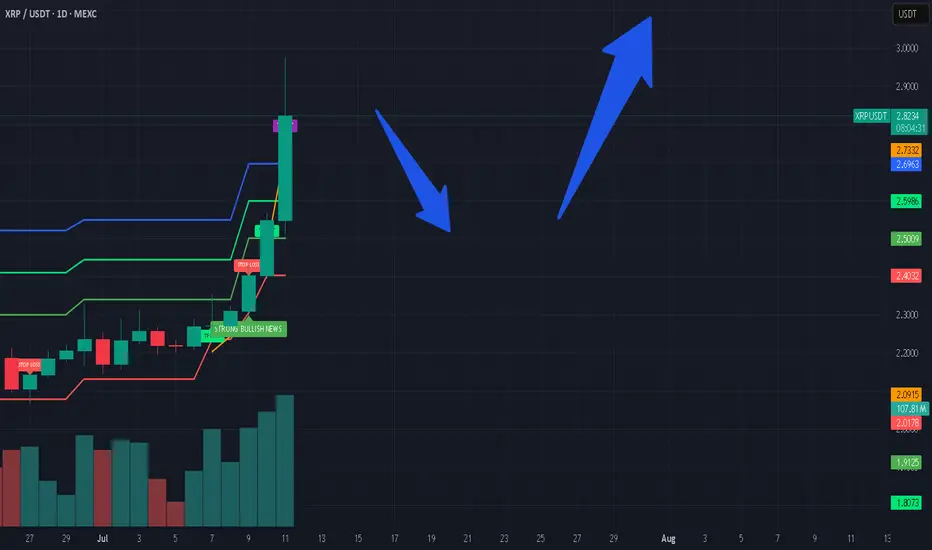
XRP COIN NEXT VIEW Good Day 🌞 Folks i hope all of you are earning well 🥰
Am Still holding my #Xrp🔥🔥 CRYPTOCAP:XRP my next week View on Xrp price soon will jump above $3 so am just holding as of now ❣️🙏🏻 let's see what's next ✌🏻 those who are holding will get great 😃 opportunity to succeed. In below 👇🏻 mentioned chart 📉 you can see my holding trade still waiting for another Rocket 🚀 #xrp

XRP - How they gonna know? They gonna know!Huuuhh XRP blind longs eh? But yeah you can but if i was I wouldn;t

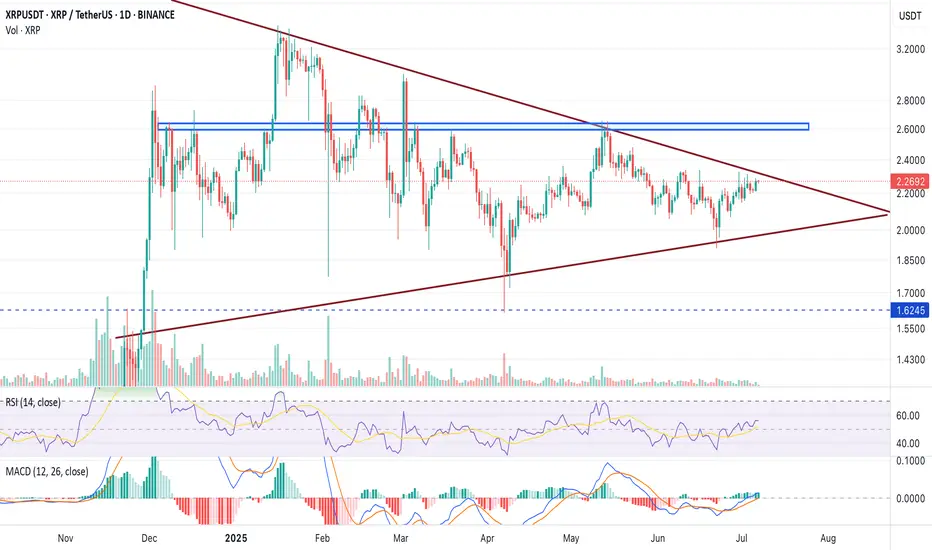
XRP/USDT: Is Ripple Gearing Up for a Breakout?XRP/USDT charts highlight a tightening price structure that hints at a possible breakout. With regulatory clarity emerging and XRP adoption increasing, traders are watching closely. This analysis explores the technical outlook for XRP, including trendlines, support-resistance zones, RSI signals, and volume metrics that may signal XRP’s next major move.
Current Market Structure (as of July 2025)
Price: ~$0.63
Resistance: $0.68 – $0.72 (multi-week rejection zone)
Support: $0.56 – $0.58
Trend: Short-term consolidation in a symmetrical triangle
Volume: Declining, suggesting a pre-breakout phase
On the daily chart, XRP is forming a symmetrical triangle pattern, a classic consolidation setup that often leads to a breakout when accompanied by rising volume. The lower highs and higher lows indicate price compression near the apex.
Technical Indicators to Watch
RSI (Relative Strength Index): Currently near 50 on the daily chart—neutral territory. A move above 60 could suggest bullish momentum building.
MACD (Moving Average Convergence Divergence): Flat, but showing signs of a potential bullish crossover on the 12H chart. A crossover above the zero line would further support bullish continuation.
Volume Profile: Volume declining during consolidation = textbook pattern before a volatility spike.
Look for a volume spike + breakout candle above $0.68 for confirmation.
🔍 Key Resistance & Support Levels
Level Role Reason
$0.72 Major Resistance Previous swing high, rejected 3 times since April 2025
$0.63 Pivot Level Midpoint of the range, near trendline resistance
$0.58 Key Support Base of recent bounce; trendline support
🚀 Bullish Breakout Scenario
If XRP breaks and closes above $0.72 with volume, the next upside targets could be:
$0.84 – Minor resistance from September 2023.
$1.00 psychological level – A key round-number target.
$1.25–$1.40 – Fib extension from the $0.42–$0.72 range.
A move toward these levels could signal the start of a new macro uptrend, especially if fueled by news (e.g., exchange relistings, Ripple partnerships, or legal clarity).
🧨 Bearish Rejection Scenario
Failure to break $0.68–$0.72 could result in a pullback to:
$0.58 support
If broken, next major level = $0.50
Watch for increasing bearish volume on rejection to confirm weakness.
XRP LONG
I am thinking of a couple of days swing trade.
I am waiting for a long breakout in the sideways channel near the previous highs with TP1 and SL drawn IN. TP2 is at the top of the sideways trend channel.

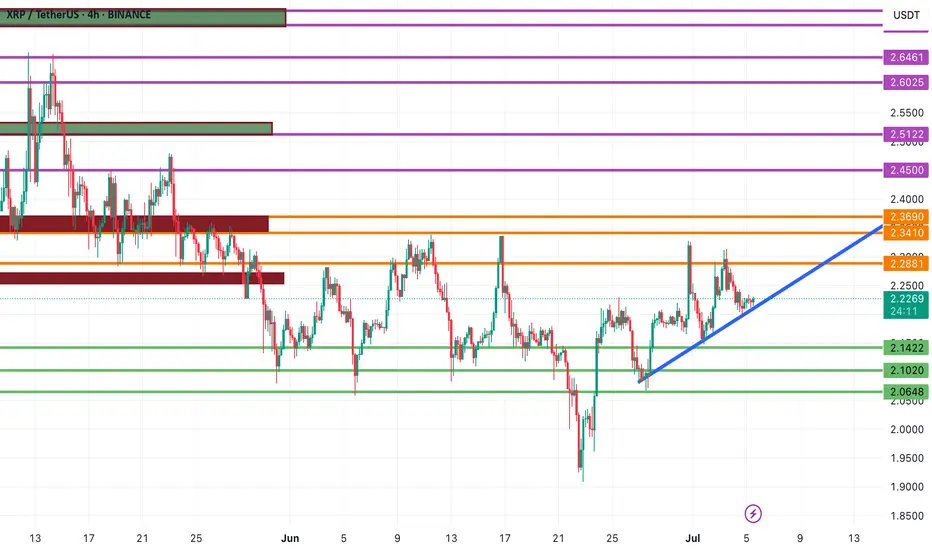
XRPUSDT Technical Analysis – Ripple at a Key Decision Point!🚀 XRPUSDT Technical Analysis – Ripple at a Key Decision Point!
As expected from our previous analysis, XRP has respected the bullish structure and is now hovering right on its ascending trendline. If the price holds this level and confirms bullish signals, a strong upside move may follow.
🔹 Upside Targets:
Key resistance levels to watch are 2.3410 and 2.3690. A breakout above these zones could push XRP toward 2.4500 and then 2.5122.
🔻 Bearish Scenario:
If the trendline breaks down, XRP may revisit previous support zones at 2.1778, 2.1422, and possibly 2.1020.
🎯 Stay tuned for updates – we deliver precise and strategic charts to help you stay ahead of the market.
👉 Follow for real-time crypto insights and smart trading setups!
HolderStat┆XRPUSD forming the rising bottomBINANCE:XRPUSDT has broken above resistance and is consolidating above the breakout zone. This mirrors previous triangle–consolidation patterns that preceded upside moves. If momentum continues, a run toward 2.34 is in play.

XRP 4H TIMEFRAME ANALYSISXRPUSDT strcuture shifted into bullish after CHoCH, Thats why I have marked OB+FVG as POI for long.

XRPUSDT UPDATE
Pattern: Falling Wedge Breakout
Current Price: \$2.2983
Target Price: \$2.60
Target % Gain: 20.23%
Technical Analysis: XRP has broken out of a falling wedge on the 12H chart with strong bullish candles and a volume surge, indicating momentum. The measured move targets a 20% gain from the breakout zone.
Time Frame: 12H

XRPUSDT → Resistance retest. Coin inside the flatBINANCE:XRPUSDT is rising towards resistance at 2.3288 due to a shift in the fundamental background to positive and a rally in Bitcoin, but there is always a but...
On the daily chart, XRP is trading below strong trend resistance, and there is also a fairly strong and voluminous liquidity pool at 2.3300 ahead, which could provide strong resistance. Bitcoin is also approaching its critical level of 110500, which may temporarily hold back growth, and a correction in the flagship could trigger a correction in the rest of the market...
Focus on resistance and the liquidity pool at 2.3288. A sharp approach and capture of liquidity without the possibility of continuing growth could lead to a correction by half or the entire local range (to 2.16).
Resistance levels: 2.3288, 2.357, 2.45
Support levels: 2.25, 2.213, 2.16
If the retest of resistance at 2.3288 ends in a false breakout, then subsequent consolidation below the level could trigger a correction to the above support and interest zones.
Best regards, R. Linda!


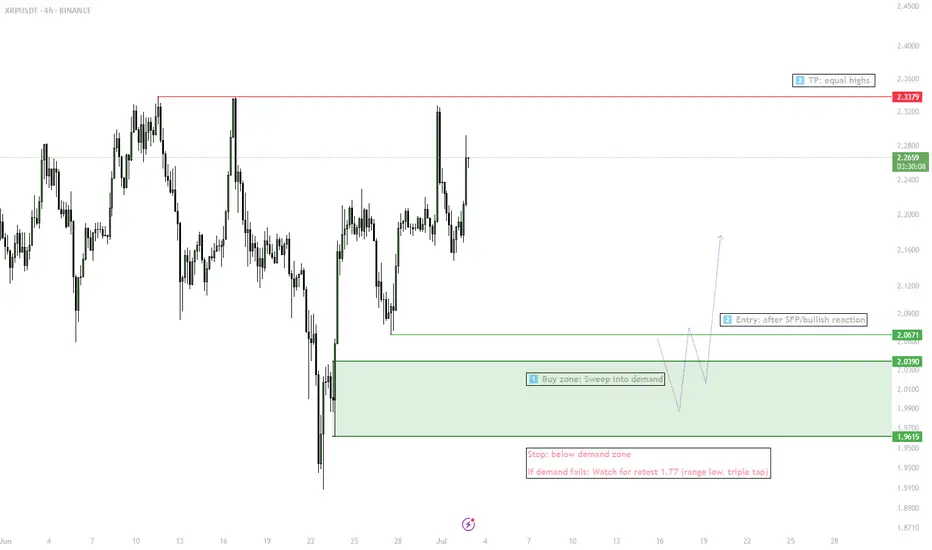
XRP — Liquidity Sweep & Range Play1. Wait for sweep into demand (2.07–1.95)
2. Enter long on SFP/bullish confirmation
3. Target: 2.33 (equal highs)
4. Stop: below demand zone
5. If stop triggered — next watch 1.77 for triple tap setup
XRP Army - prepare for a 72% crash to 0.6 USD! (lifetime chance)The current price of XRP is 2.19 USD, and I predict a big crash in 2025/2026 to 0.6 USD. Yes, I know you may think that that's completely impossible, especially if you are high on your XRP holdings, but I can assure you that this is going to happen! What can you do?
If you are a hodler, then you need to prepare for your portfolio to drop by 72%. Can you really handle this situation? If not, you need to take some action.
If you are a trader and you still speculate on the price increase, you can consider exiting your position. If you bought before the huge pump, take your profit now.
If you are a trader and you bought after the pump, that means at the TOP, you basically FOMOed-IN. It's time to take a small loss or exit your position at break-even. If you found yourself in one of the situations above, you have some work to do. And you need to do the work as soon as possible, before XRP starts crashing, which can be any day now. Otherwise, I strongly recommend entering a short position on futures on a strong resistance if you want to make money on XRP.
Now, importantly, why do I think XRP will crash? Technically, XRP is in a big range and has been in a range since 2017. Nothing changed at all after the pump; the price is still inside this ascending triangle. After the huge pump, the price created a big FVG (Fair Value GAP), and historically this has been a big issue for XRP because we went down each time and wiped out the GAPs. Don't forget that XRP is something like a bitch coin, it's doing weird moves, and it's always ranging and taking liquidity from traders, like a casino. Smart traders can take advantage of it and trade it, but you need to have a strategy. Right now it's obvious that XRP is going to go down in the next months!
Write a comment with your altcoin + hit the like button, and I will make an analysis for you in response. Trading is not hard if you have a good coach! This is not a trade setup, as there is no stop-loss or profit target. I share my trades privately. Thank you, and I wish you successful trades!

Xrpusdt 4hr tf bearishA bearish head and shoulders pattern is forming.
If it closes below 2.0811 on the 4-hour timeframe, the pattern may be activated.
Targets are 1.95, 1.80, and 1.65.
Invalidation occurs if the high of the right shoulder (2.3355) is broken.

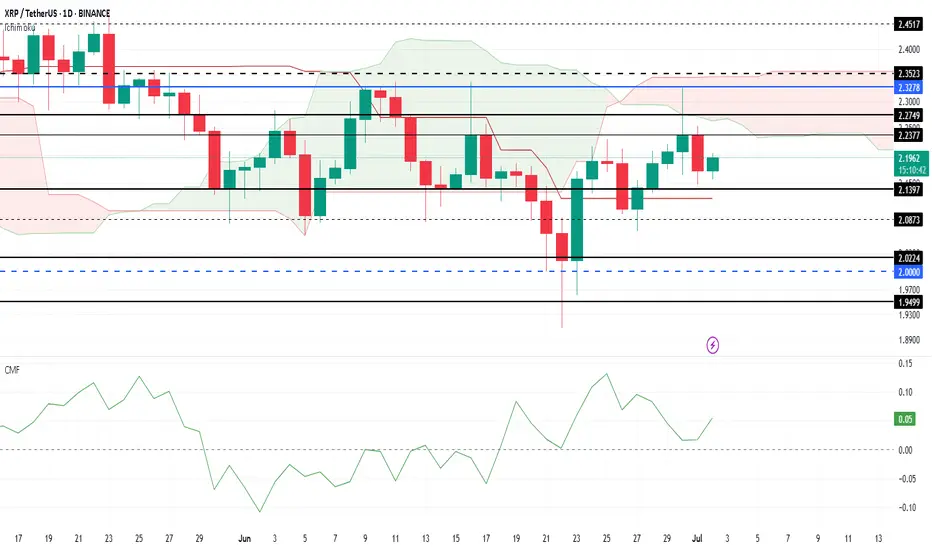
XRP Price Today: Rising Outflows Hinder RecoveryXRP has experienced notable volatility throughout June, with the altcoin failing to break through the $2.32 resistance level. Despite multiple attempts, XRP remains consolidated below this critical price point.
This price action indicates a lack of bullish momentum in the short term, making further gains challenging unless the resistance is breached.
The Ichimoku Cloud is turning negative , suggesting that bearish momentum could intensify for XRP. With the cloud positioned above the candlesticks, it signals further pressure on the price.
Additionally, rising outflows are visible on the CMF, as the indicator moves closer to the zero line, adding to the negative outlook.
If selling pressure continues to mount, XRP could fall below its support at $2.13 , potentially slipping to $2.02. This would mark a significant decline and invalidate the bullish thesis, signaling that XRP’s upward momentum could be at risk in the near future.
When Holding is Suicide, Hope Is a KillerStill holding… just waiting for it to come back?
You’re not alone. Most traders enter with confidence and exit with fear. But in some situations, holding isn’t strategy — it’s just slow motion account suicide.
If you’ve ever lost sleep after refusing to close a position, this one’s for you.
Hello✌
Spend 3 minutes ⏰ reading this educational material.
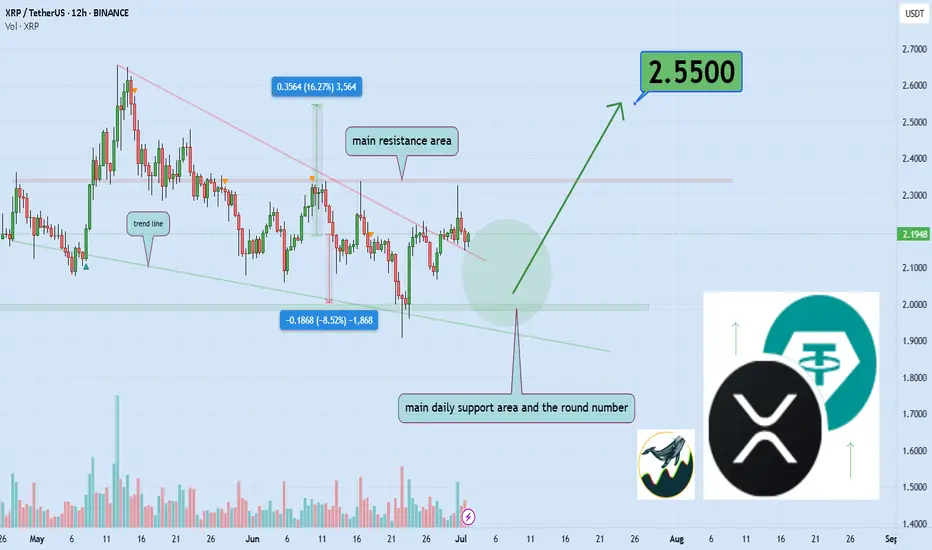
🎯 Analytical Insight on XRP:
XRP is approaching a major daily support zone, aligned with the psychological level of $2.00. This area has historically provided strong buying interest. A potential rebound from this level could lead to a minimum upside of 16%, with a medium-term target around $2.55. 📈
Now , let's dive into the educational section,
🚩 Still Holding? It’s Probably Not About the Chart Anymore
The biggest lie traders tell themselves:
“It’ll bounce back… just give it time.”
But in reality:
Holding a loser drains your mental capital more than your actual balance
The longer you wait without data, the more emotional your decisions get
The market doesn't care about your entry, your hope, or your patience
As they say in trading:
Hope is not a strategy.
And often, it’s the fastest way to wreck your capital quietly.
📊 TradingView Tools to Know When Holding Is Dangerous
Sometimes, charts whisper before they scream. These 4 tools on TradingView help you see when "holding on" is no longer a smart move but a trap. Let’s break them down and make them practical:
1. Volume Profile
This shows you exactly where most buying and selling occurred. If price drops below the highest volume zone, it means conviction is gone.
How to use it:
Right click the chart → Add Indicator → Select "Volume Profile Fixed Range" → Drag across the last trend leg.
2. RSI Divergence
Still holding while RSI shows bearish divergence? That’s a red flag. It signals trend exhaustion.
How to check:
Apply RSI 14. If price makes a higher high but RSI makes a lower high, you're likely holding into weakness.
3. Smart Money Concepts (SMC)
Look for Liquidity Grabs, Breaker Blocks, or Order Blocks. These reveal where big players exit often while you're still hoping.
How to find it:
Go to Indicators → Search “Smart Money Concepts” → Pick a high rated free version.
4. Session Volume / Ranges
If you’re stuck holding during sideways chop, your money is freezing.
How to identify it:
Add Session Volume or Range indicators. If you see price compressing without expansion, it’s not worth staying in.
🪤 5 Situations Where Holding Is Silent Suicide
The market is ranging with no true breakout in sight
Indicators are flashing weakness but you're still “waiting”
You’re only holding because exiting would feel like admitting failure
You missed the exit and now you’re emotionally attached
You fell in love with the fundamentals of a coin and lost objectivity
🧲 Greed vs Hope — Know the Difference
Greed wants more.
Hope just doesn’t want to lose.
Both will blind you from the truth on your chart.
📉 Real World Case: Holding Through a Pumped Altcoin
Last week, thousands held on to a hyped altcoin.
But here’s what the chart said:
RSI was overbought for 3 days straight
Momentum was fading on every push
Smart money exited and left retail praying
Result?
A 48 percent drop in 5 days.
The ones who held are still "hoping" today.
🧘 The Golden Rule of Holding
Before you decide to hold a losing position, ask yourself:
Is this based on actual chart structure or just denial?
Am I trying to avoid the pain of realizing a loss?
If I had no position, would I open this trade right now?
If the answer is no, it’s probably time to get out.
🧭 Final Take
Sometimes holding is wisdom.
Other times, it’s just avoidance wrapped in hope.
Use real data. Use real tools. Make real decisions.
And if it’s time to close that trade, do it before it drags you down deeper.
✨ Need a little love!
We put so much love and time into bringing you useful content & your support truly keeps us going. don’t be shy—drop a comment below. We’d love to hear from you! 💛
Big thanks , Mad Whale 🐋
📜Please remember to do your own research before making any investment decisions. Also, don’t forget to check the disclaimer at the bottom of each post for more details.
DeGRAM | XRPUSD in the consolidation zone📊 Technical Analysis
● A liquidity sweep to $2.00 closed back inside the six-week green range, printing a hammer on the rising-channel base—confirming the dip as a spring rather than a breakdown.
● Price is compressing against the purple April trend-cap; each pull-back now holds a higher low, and a box-range measured move projects a pop toward the dotted pivot at $2.34 and the channel median near $2.60 once $2.24 gives way.
💡 Fundamental Analysis
● Derivatives funding has flipped positive and cumulative OI on major venues is up ~10 % since 23 Jun, signalling fresh long positioning ahead of July’s SEC–Ripple status hearing.
✨ Summary
Buy $2.10-2.18; breakout above $2.24 targets $2.34 → $2.60. Bias void on a 6 h close below $1.98.
-------------------
Share your opinion in the comments and support the idea with a like. Thanks for your support!

$XRP Keep an eye on the marked support zone... If price revisitCRYPTOCAP:XRP Keep an eye on the marked support zone...
If price revisits this range, it could offer a solid entry opportunity before the next major breakout toward the $3–$5 region.

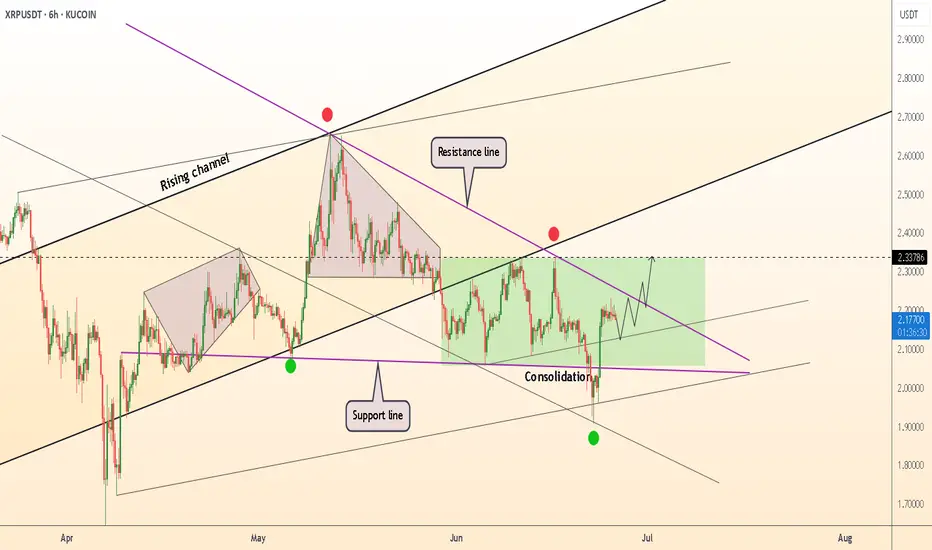
XRP Update ATH - T1 - 10% move Long | Potentially 100% mid JulyXRP is moving in the bullish channel. I believe we need 2 more touches:
1. Resistance Line
2. Support Line
Expectations 7-14 Days and the
