XRP? Flyyyyyy
Hi,
Come on comrades.. we can do this
Absorb that 2.90 seller fortress :)
Flying after 2.90??
NB: Im in position earlier ok. ( not going to be a buy call)
All the best
Not a guru
XRPUST trade ideas

Can XRP breakout deliver 18% gains toward the $2.60 zone?Hello and greetings to all the crypto enthusiasts, ✌
All previous targets were nailed ✅! Now, let’s dive into a full analysis of the upcoming price potential for Ripple 🔍📈.
XRP is approaching a key breakout point above its descending channel and major daily resistance. A confirmed move above this level could pave the way for an 18% upside, with the next significant target set around $2.60, coinciding with a key supply zone 📊🚀.
🧨 Our team's main opinion is: 🧨
XRP is eyeing a breakout with 18% upside potential toward the key target of $2.60, pending confirmation above resistance 📈.
📚🎇
Give me some energy !!
✨We invest hours crafting valuable ideas, and your support means everything—feel free to ask questions in the comments! 😊💬
Cheers, Mad Whale. 🐋

XRP Breakout Alert – Watching 3.3, 3.8, and 5.0 TargetsXRP/USDT just broke out of a 5-month sideways structure, finally pushing through the descending trendline (triangle resistance).
We're now testing the key 2.7 zone—a critical area where I believe a strong close with volume is needed to confirm this breakout.
If we get that confirmation, the next upside target is around the previous high near 3.3, followed by Fib extension levels at:
1.618 = 3.81
2.618 = 5.08
The weekly chart supports this breakout idea as well, price held above the previous demand and MACD is slowly curling up.
BINANCE:XRPUSDT Summary:
1. Breakout from triangle confirmed
2. Watching for strong close above 2.7
3. Targets: 3.3 (previous high), 3.81, 5.08
4. Weekly & daily both show structure support
Let’s see if XRP can reclaim its momentum.

"XRP - Time to buy again!" (Update)Finally, this pattern was broken and had a positive impact, leading to significant growth. Now, with a slight price correction, higher price levels can be reached.
PREVIOUS ANALYSIS
Stay Awesome , CobraVanguard

XRP/USDT ALL MARKETS ON HIGHThe price, like on SOL and ETH are now all at a high point and in a buy trend...here we need to be carefull and truly just look for trend trade or for retracement, fakeout + confirmation on truly good level to actually find a good trade and entry...where you cant find a good entry already stop and wait for market to form better graphs... lets go!
XRP near trend experienceNext few weeks expectation? No FA, just my thoughts on next waves potential

Spotlight on the 2.30 SupportXRP is currently exhibiting signs of upward momentum. The 2.30 zone has acted as a valid support area, with notable price reaction around this level. If the current structure holds, a movement toward the 2.50 region is possible.

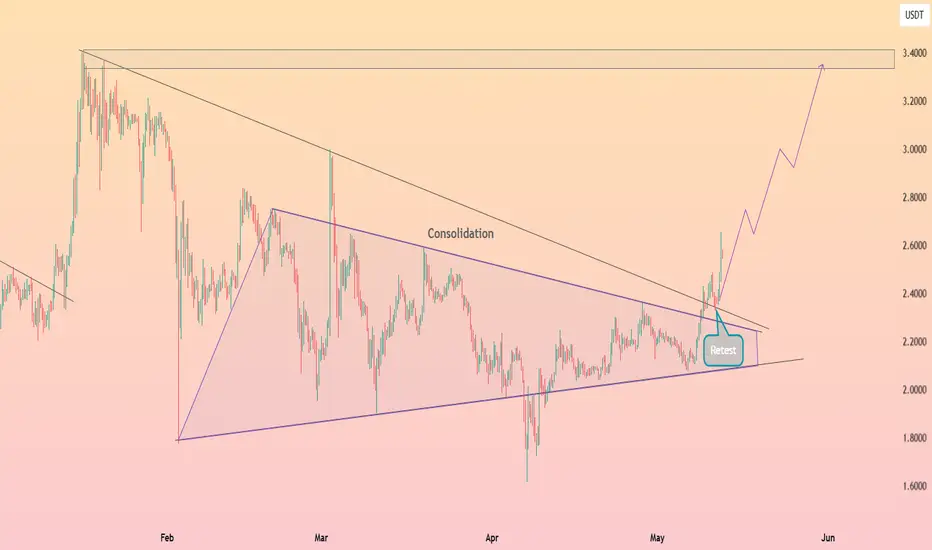
HolderStat┆XRPUSD broke the downtrend📈 XRP compressed for weeks inside a contracting triangle, posting a series of higher lows beneath a stubborn down‑sloping ceiling. Early May produced the decisive break, with price flipping the 2.3‑2.4 zone and immediately returning for a clean retest that held on a dime. The pattern implies energy is stored for a measured move toward the 3.4 resistance band highlighted on the chart; invalidation rests beneath the reclaimed trendline, keeping risk tight.
Trade idea (long) on XRP/USDT (after validation)Here is a trade idea on XRP/USDT.
If the price gets over 2.5839 then pulls back on 2.5839 but keeps being over this price, then enter long with TP1 = 3 USDT.

Ripple is Nearing an Important Support!!! Hey Traders, in today's trading session we are monitoring XRPUSDT for a buying opportunity around 2.17 zone, Ripple is trading in an uptrend and currently is in a correction phase in which it is approaching the trend at 2.17 support and resistance area.
Trade safe, Joe.

XRP is going to 12$🎯 Medium- to Long-Term Targets
Next Major Price Target:
$4.958 (approximately +95% from current levels). Take profit and reload lower once it hits that level
This aligns with a historical Gann fan extension and multi-year fib structure projection.
Final Major Target Zone:
Between $11.2288 and $11.9643.
This zone represents a Gann master angle target intersecting with the long-term expansion arc.
Could take multiple months or a full cycle to reach, but this is the macro target zone for XRP.
Local resistance range VAH:

XRPUSDT UPDATE
Pattern: Falling Wedge Breakout
Current Price: \$2.5398
Target Price: \$3.90
Target % Gain: 55.29%
Technical Analysis: XRP has broken out of a falling wedge on the 1D chart with strong bullish momentum. The breakout is confirmed with a daily close above resistance and increased volume.
Time Frame: 1D
Risk Management Tip: Always use proper risk management.

XRP/USDT Technical Analysis
📈 Current Price: $2.5492
XRP shows signs of strong accumulation and a technical structure aligned with a bullish reversal. As long as it holds above the assembly zone, continuation to higher targets remains probable.
🎯 Target Levels:
First Target: $4.0532
Second Target: $4.6947
Final Target: $5.3925

DeGRAM | XRPUSD volatility expansion📊 Technical Analysis
● XRP is climbing inside a rising channel (green) that has developed on top of the former $2.05‑2.15 demand zone; successive higher lows along the blue trend‑line confirm fresh bullish structure.
● Price has already cleared the long‑standing wedge roof; holding above the channel mid‑line keeps $2.60 resistance (red) in focus.
💡 Fundamental Analysis
● A U.S. judge has ordered the SEC and Ripple to enter a pre‑trial settlement conference before 31 May, fuelling speculation that the multi‑year case could end with a fine rather than a ban—boosting institutional appetite for XRP.
✨ Summary
Rising‑channel momentum plus hopes of a favourable Ripple‑SEC resolution support a push from $2.45 toward $2.60‑2.75.
-------------------
Share your opinion in the comments and support the idea with a like. Thanks for your support!

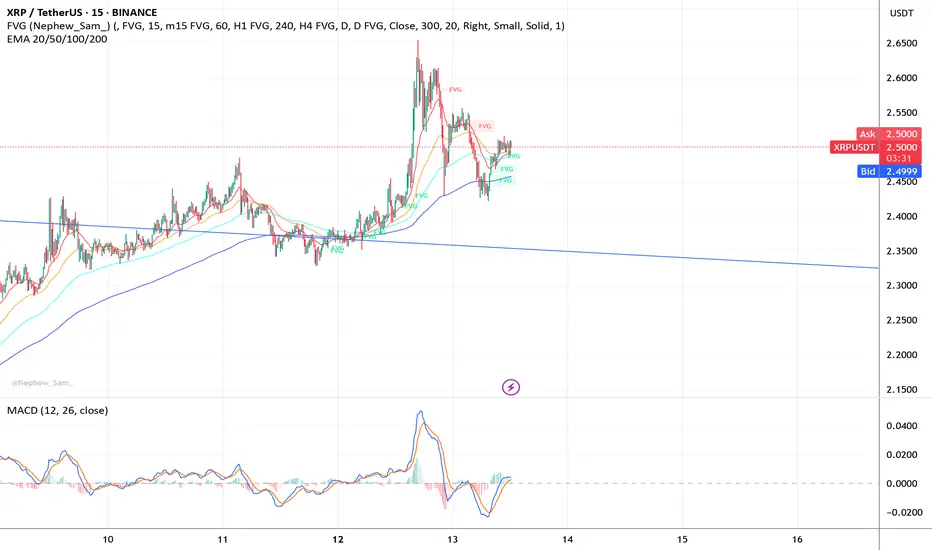
XRP/USDT 15mTrend Context:
The price successfully broke out of the descending wedge (resistance line).
It is now retesting key support zones formed by previous breakout levels, FVG areas, and the 100/200 EMA zone.
A consolidation phase is occurring right below the key resistance zone 2.62–2.65 USDT, making this a healthy correction in a bullish structure.
The MACD on the daily and 4H chart shows potential for continuation after temporary consolidation.
📈 Trade Setup – Long (Futures)
🟢 Position Type:
Long (Buy)
📍 Entry Range:
2.50 – 2.52 USDT
This zone is supported by:
FVG fair value gaps
EMA100/200 on the 1H and 4H timeframes
Retest of breakout zone
📉 Stop-Loss (SL):
2.44 USDT
Set slightly below the major EMAs and the lower support of the FVG range — if broken, it invalidates the bullish structure short-term.
🎯 Take-Profit Targets:
TP1: 2.59 USDT (resistance from last peak)
TP2: 2.63–2.65 USDT (major horizontal resistance zone)
TP3 (optional long-term): 2.85 – 3.14 USDT (based on the daily breakout wedge target)
📊 Risk-Reward Ratio (R:R):
Between 1:2 and 1:3, depending on final exit point.
🧮 Leverage:
5x to 10x Futures leverage
📌 Additional Notes & Confirmation
MACD: Daily and 4H bullish momentum remains intact.
EMA Alignment: Price still above 50/100/200 EMAs in higher timeframes — bullish alignment.
Structure: Breakout and retest confirmed — looking for higher low formation.
⚙️ OCO Order Setup (Optional)
If using Binance Futures:
Entry: Limit Buy at 2.51
Take Profit: 2.59 and 2.63 (split your position or trail stop)
Stop Loss Trigger: 2.45
Final Stop Price: 2.44
XRP | HTF ANALYSIS
BREAKDOWN
- Good Price Action across the block one of the
reason i like XRP bags is the Bridge for bank-to-bank
cross-border payments which makes it a still hit this
Cycle + many other cycles as long as the UseCase
is sustained,
- One of the memes that have undergone previous
alt cycle but still can be a good HODL this time
too as dips are eaten up plus bags capitilzaing
over the dips + can be easily retesting ATH by
tweets,
- Eyes on 2.0604ish region fills for averaging entries
confluenced by Daily breaker block acting as local
Supply region to satisfy Net Auction bids and send
it back higher.
DCA REGION
- 2.0604Ish
TARGETS
- Trimming Ath 3.3994 - 4.2 region

XRPUSDT: Turning Bullish, Chart Signals +20% Upside PotentialHey Realistic Traders!
Is XRPUSDT Gearing Up for a Major Bull Run or Just Faking Us Out Again? Let’s Break It Down...
XRPUSDT has finally broken out of its bearish channel, and price action is holding strong above that zone. This is a solid indication that bulls are gaining control. Shortly after the breakout, a smaller falling wedge formed, which is typically a bullish continuation pattern.
What adds further interest to this setup is that the falling wedge appears to be developing during what may be Wave 4 of the Elliott Wave cycle. While Wave 4 is usually corrective, it can occasionally take the form of a wedge or triangle-like pattern. If this interpretation holds, it would suggest that a bullish Wave 5 may follow, often the final impulse leg in the trend.
Zooming into the 4-hour chart, a fresh breakout has just occurred, further strengthening the bullish case. Adding to this, the MACD has printed a golden cross, a classic momentum signal that supports the outlook for continued gains.
With all these factors aligning, the first target is set at 2.5454. A minor pullback could occur at that level before price continues its move toward the second target at 2.8535. Both targets have been calculated using Fibonacci extension levels from the current bullish wave.
This outlook remains valid as long as the price stays above the stop-loss level at 2.0355.
Support the channel by engaging with the content, using the rocket button, and sharing your opinions in the comments below.
Disclaimer: "Please note that this analysis is solely for educational purposes and should not be considered a recommendation to take a long or short position on Ripple.

XRPUSDT Bullish Setup – Swing Trade Opportunity Toward $6.00XRP has shown a consistent pattern of strong bullish impulses followed by consolidation zones, and this rhythm has repeated multiple times on the weekly chart—signaling high confidence in pattern continuation.
Let's break it down
🔁 Repetitive Buying + Consolidation Patterns
19 Sep 2022: Strong buying candle triggered a short-term rally, followed by a multi-week consolidation period.
10 July 2023: Similar impulse move occurred—buying strength picked up, and then the price consolidated again.
4 Nov 2024: Most recent and strongest impulse—3 consecutive bullish candles that broke out of long-term descending resistance, confirming structural shift. This was again followed by consolidation—mirroring previous price behavior.
📈 Breakout Confirmation & Trend Structure
Breakout of Descending Trendline (Red): XRP broke out of its long-term bearish trendline decisively, confirming a trend reversal.
Support Zone Holding Firm (1.95 USDT): Price retraced slightly but respected the newly established support above 1.9500.
Consolidation Above Breakout: Post-breakout consolidation is forming a bullish continuation pattern.
Key Technical Levels
Entry Zone (Buy Area): Current zone between $2.10 and $2.50 (ideal accumulation zone for swing traders).
Technical Stop Loss: $1.9500 – key level that has acted as both resistance and now flipped to support.
Take Profit Targets
TP1: $3.4157 – previous resistance and a strong psychological level.
TP2: $6.000 – projected top of current trend channel (green line), aligns with 131.59% upside from current level.
Risk-Reward: Over 5:1 R:R on this setup, extremely favorable for mid-to-long-term swing trades.
Bearish Invalidations
If the price closes significantly below $1.95 on the weekly, the current bullish thesis weakens, and price may retest deeper supports around $1.25 or below. But as long as the structure holds, bulls are in control.
📊 Trade Setup Summary
📥 Entry 2.10 – 2.50
🛑 Stop Loss 1.9500
🎯 Take Profit 1 3.4157
🎯 Take Profit 2 6.0000
⚖️ R:R Ratio 5.32x
The chart tells a powerful story—repeated buying, breakout confirmation, support holds, and continuation setup. XRP is positioning itself for a major move, with $6.00 potentially on the table by the end of 2025.
This is an ideal zone for swing traders and position traders who are comfortable with multi-month holding periods and high R:R setups.

XRP? MoM.. Let's SELL
Let's dream big :)
Theoretically.
Momentum by players.. and timing
I don't know.
Manage risk well.
All the best

XRP/USDT Technical and Fundamental AnalysisXRP/USDT Technical and Fundamental Analysis
XRP has recently broken above the $2.50 level, signaling growing bullish sentiment driven in part by improved geopolitical developments, such as the U.S.–U.K. trade agreement and a potential easing of U.S.–China trade tensions.
From a technical perspective, the pair has invalidated minor resistance levels between $2.2500 and $2.5000, with price currently retesting the $2.5000 zone along a lower trendline supported by four key touches—indicating strong bullish structure. This retest aligns with our trendline, offering a potential confirmation for continued upside.
We are monitoring for a liquidity sweep below current levels, followed by a breakout above the key level. Our area of interest lies at a buy stop entry at $2.5390, with a stop-loss placed at $2.3340 (below the liquidity zone) and a target at $2.9970, just above minor resistance. That said, we remain cautious due to a recent CHOCH (Change of Character) break below a major level, which could suggest potential downside risk if confirmed.
Fundamental Outlook:
CME Group has announced the launch of cash-settled XRP futures on May 19, 2025, pending regulatory approval. This development highlights growing institutional interest and marks a significant step for XRP’s integration into traditional financial products. (Source: Reuters)
Additionally, the SEC is expected to decide by June 17, 2025, on a spot XRP ETF application filed by Franklin Templeton. Approval could further legitimize XRP in the eyes of institutional investors and drive broader market participation.
📌 Disclaimer:
This is not financial advice. As always, wait for proper confirmation before executing trades. Manage your risk wisely and trade what you see, not what you feel.

XRP? still bullish?I'm still bullish
So on bullish mode
Buy dips or buy break trendline
Just follow the flow..
Unless I hv different view on asset
All the best
Not a guru

Momentum Rising – $XRP Bulls Eyeing Next Leg UpCRYPTOCAP:XRP is waking up 🔥
Price has broken out of the long-term downtrend and is now testing the important horizontal resistance area
A clean break above this range might spark the next big move. Volume is on the increase, and the structure is all good
Time to keep an eye on this one 👀

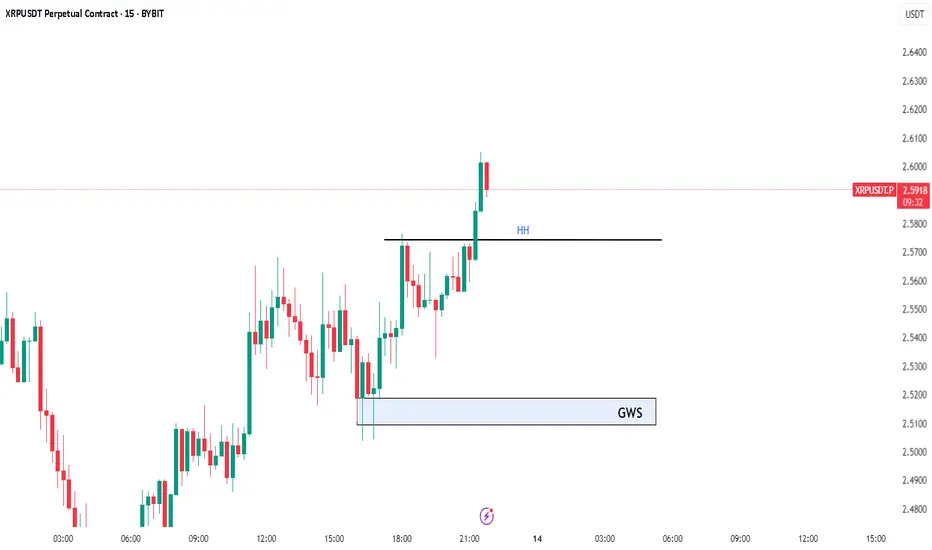
XRP: Bullish Continuation is Imminent!Keep an Eye on XRP
Now is the time to watch XRP. If the price breaks to the upside, we could see a significant move that might take it above $2.95!
Trading Setup
If you’re considering trading XRP, here’s a quick setup that may help you.
The idea is: Buy when the price breaks above $2.5 and take profits at the levels shown in the chart.
Targets:
1. $2.6
2. $2.75
3. $2.95
-------------------------------------------
About our trades:
Our success rate is notably high, with 10 out of 11 posted trade setups achieving at least their first target upon a breakout price breach (The most on TW!). Our TradingView page serves as a testament to this claim, and we invite you to verify it!
