XRPUSDT 1D#XRP has formed a bullish pennant on the daily chart — keep an eye on it.
In case of a breakout above the pattern resistance and the daily MA50, the targets are:
🎯 $2.5067
🎯 $2.7175
🎯 $3.0177
🎯 $3.4000
⚠️ Always use a tight stop-loss to manage risk and protect your capital.
XRPUST trade ideas

XRP - Do you want to slurp?Yeah who doesnt wants to slurp profits? I shall say the move down shall be taken first before the formation of the pattern to work in accordance with the moves! Hope its understood

XRP's situation+ Target PredictionThe XRP is in a Bullish phase by a Falling Wedge Pattern.
A falling wedge indicates the potential for price to reach to $3.
Note if the PRZ ZONE is broken downwards with the strength of Bearish candles , this analysis of ours will be failed.
Best regards CobraVanguard.💚

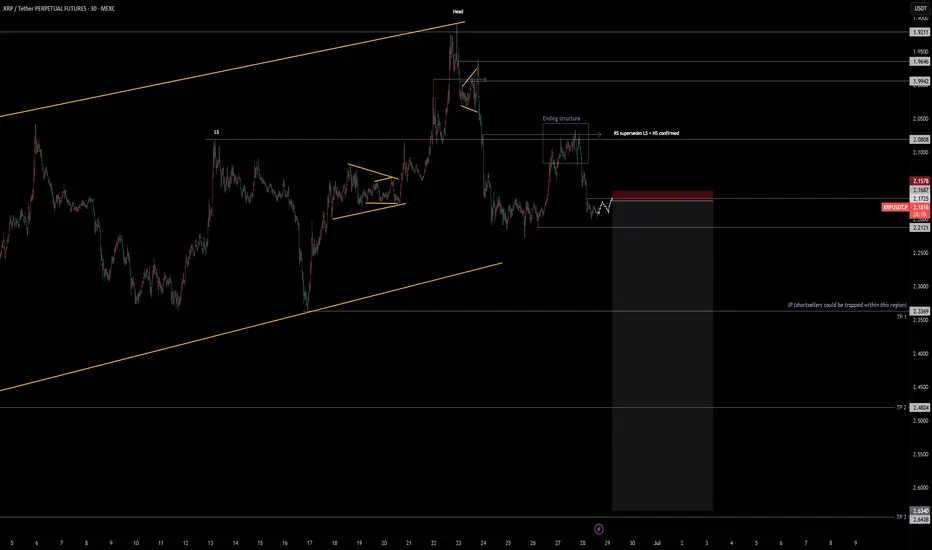
XRP: The Next WaveHi traders,
In previous videos, I covered both LTF and HTF targets for BTC and ETH — everything is unfolding as expected. I'm now spotting growing opportunities on XRP, which is also reflected in the XRP/BTC chart.
Price action has respected a key volume area (VA), and the Head & Shoulders pattern is playing out nicely — each inflection point is being taken out. I'm patiently waiting for a potential LTF flag (correction) to form.
Although I normally avoid taking partials due to this being a swing idea — and considering swap fees on CFDs — I’m securing partial profits at each target.
I’ll be releasing a video soon to break everything down in full detail.
Onwards gang!
CRYPTO:XRPUSD BINANCE:XRPBTC
Xrpusdt 4hr tf bearishA bearish head and shoulders pattern is forming.
If it closes below 2.0811 on the 4-hour timeframe, the pattern may be activated.
Targets are 1.95, 1.80, and 1.65.
Invalidation occurs if the high of the right shoulder (2.3355) is broken.

XRPUSDT UPDATE
Pattern: Falling Wedge Breakout
Current Price: \$2.2983
Target Price: \$2.60
Target % Gain: 20.23%
Technical Analysis: XRP has broken out of a falling wedge on the 12H chart with strong bullish candles and a volume surge, indicating momentum. The measured move targets a 20% gain from the breakout zone.
Time Frame: 12H

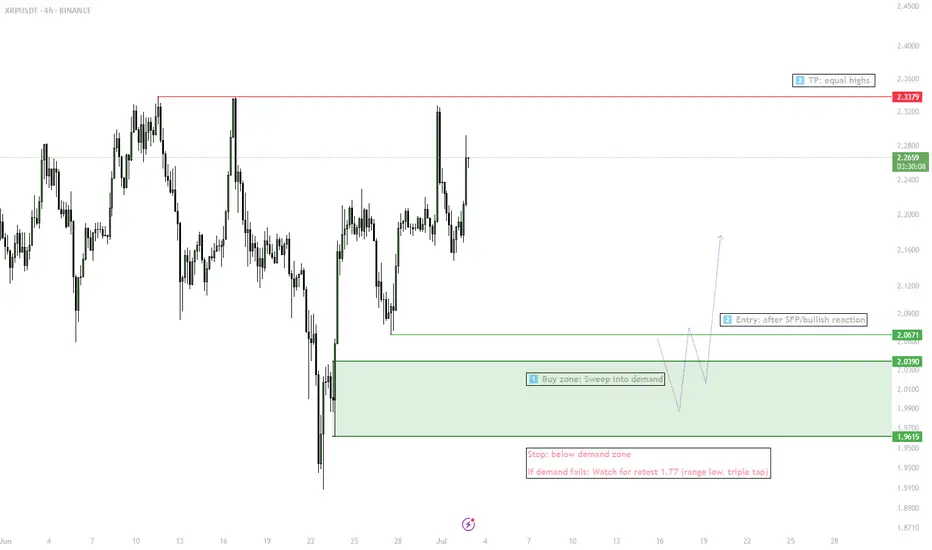
XRP — Liquidity Sweep & Range Play1. Wait for sweep into demand (2.07–1.95)
2. Enter long on SFP/bullish confirmation
3. Target: 2.33 (equal highs)
4. Stop: below demand zone
5. If stop triggered — next watch 1.77 for triple tap setup
XRP UG-ah-LYXRP has been slowly chopping lower in a mess of overlapping candles. Lower highs and lower lows at the Highest degree. The trend is down and the Elliott Is ugly.
There is a chance here for the trend to shift, but that low needs to hold.
In Elliott Wave, ugly can be useful. An ugly pattern often screams correction. That is the working assumption right now. This structure could still be a complex wave four.
Even though the wave count has not been crystal clear, I am not flying blind. I am using support and resistance to track the structure and wait for clarity.
Here are the levels that matter right now:
3.4005 was the major high
3.0257 and 2.2762 are key reaction zones
2.6510 is the median and the first major line bulls need to beat
1.9736 is the old high that price continues to bounce from
1.9015 and 1.5267 are the potential downside reaction zones if the yellow path unfolds
If this is a correction, there is still potential to hold above 1.62 and send. If that level goes, the structure shifts fast to lower targets.
This is not the time to get brave without confirmation, mo.
Ugly price action can still resolve cleanly. But I want to see an impulsive move through one of these levels, followed by a corrective return to that level. That would offer a more ideal continuation in whichever direction price decides.
Let the level reactions speak first. I will act after.

Ripple (XRP): Possible Smaller Bullish Movement IncomingRipple coin buyers are showing some strong volume where we might see another liquidity movement outside our sideways channel, which might give us potential 40% movement, but be careful, as on smaller timeframes we are seeing a possible H&S form.
More in-depth info is in the video—enjoy!
Swallow Academy


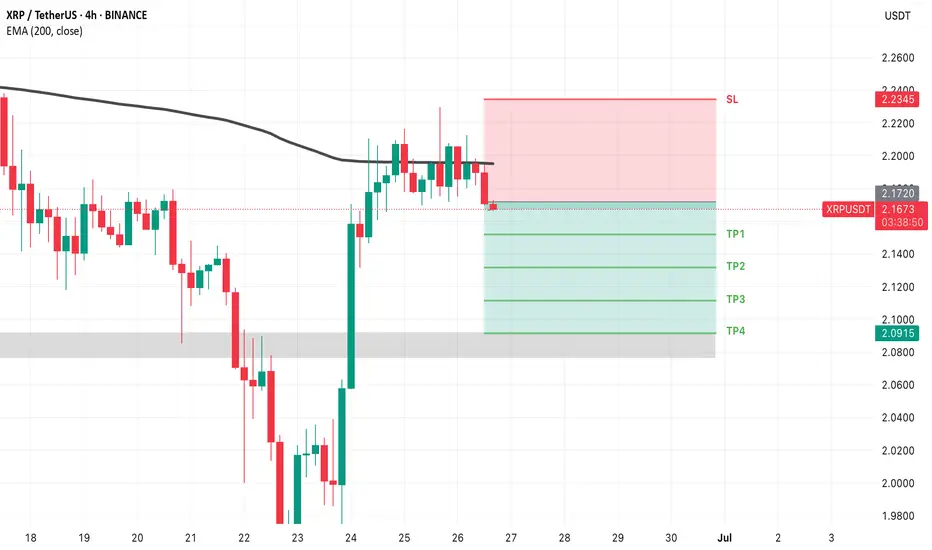
XRP SHORT TRADE SETUPXRP/USDT is currently holding at a strong resistance zone, with a high probability of an downward price move. Also 200 EMA acting as a strong resistance .
Xrp:The fate of Ripple in the long termhello friends👋
After a good price growth that we had, you can see that the buyers gradually exited and a triangle pattern was formed.
Now, according to the specified support, it should be seen whether buyers support Ripple or not...
You have to wait and nothing can be said until the failure of the pattern, but we suggest that you buy step by step with capital and risk management in the identified areas that are very good supports and move to the set goals.
And in the end, we must say that don't forget that we are in a strong upward trend, that the probability of the continuation of the Bister trend is the possibility of a fall...
🔥Follow us for more signals🔥
*Trade safely with us*

XRP road map (Daily)This could be the last chance for Ripple; if the triangle breaks downward, the price could enter a channel below $2.
Best regards CobraVanguard.💚

Ripple (XRP): Seeing Smaller Bullish Movement To AccumilateRipple coin has extended itself heavily since november but what we noticed is how close the 200EMA line on the daily timeframe has come to the market price, which is our main point of interest as of now.
More in-depth info is in the video—enjoy!
Swallow Academy

XRP About to Break Out! 3.40 Target.Trading Fam,
It's really this simple. This is a bullish triangle. Three hits in the premium buy zone (bottom of the triangle) and we're done. Once we break, there will be some resistance at that VRVP PoC (2.39) and then we're gone. 3.40 is an easy target.
Stew

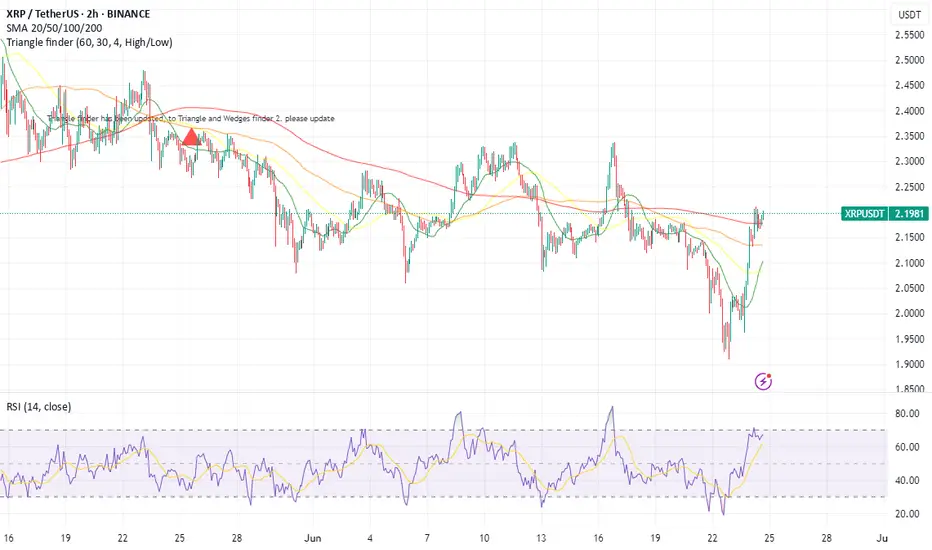
XRP Price Soars Past $2.15: Next Stop $2.38? XRP Price Prediction: What’s Next After Breaking $2.15 Resistance?
Ripple’s XRP has been making waves in the cryptocurrency market, recently breaking above the critical $2.15 resistance level and surging nearly 8% in the last 24 hours to trade at $2.18. With a further 9% climb in recent sessions and open interest jumping to $3.77 billion, the coin is showing strong bullish momentum. Analysts are now eyeing targets of $2.33 and even $2.38 in the near term. But what lies ahead for XRP after this breakout? Is this the start of a sustained rally, or could resistance at higher levels cap the gains?
________________________________________
XRP Price Action: Breaking Key Resistance at $2.15
XRP’s recent price surge has caught the attention of traders and investors alike. After trading in a consolidation range for weeks, the cryptocurrency initiated a fresh increase from the $1.92 zone, gaining momentum as it approached the $2.00 level. A significant development came when XRP broke above a key bearish trend line with resistance at $2.00 on the hourly chart of the XRP/USD pair (data sourced from Kraken). This breakout was followed by a decisive move past the $2.15 resistance, a level that had previously capped upward movements.
Currently, XRP trades above $2.18, sitting comfortably above the 100-hourly Simple Moving Average (SMA), a widely watched indicator of short-term trend direction. The price action over the last 24 hours shows an 8.2% increase, with some sessions recording gains as high as 14%, particularly following geopolitical developments like the Iran-Israel ceasefire, which boosted risk assets across markets. This recovery from the $1.90 low demonstrates strong buying interest and renewed confidence in XRP’s potential.
The immediate question for traders is whether XRP can sustain this momentum. The next resistance zone lies between $2.20 and $2.33, with some analysts even targeting $2.38 based on rising open interest and market volume. A close above $2.18 in the coming hours could signal the start of another leg up, while failure to hold this level might see a pullback toward $2.10 or lower.
________________________________________
Technical Analysis: Bullish Indicators and Key Levels to Watch
To understand XRP’s potential trajectory, let’s dive into the technical indicators and key levels shaping its price action.
Support and Resistance Levels
• Support: The $2.10 level, previously a resistance, now acts as a near-term support alongside the 100-hourly SMA. A break below this could see XRP test the $2.05 zone, with further downside potential to $1.92 if bearish pressure mounts.
• Resistance: The immediate hurdle lies at $2.20, a psychological barrier that has historically posed challenges. Beyond this, $2.33 emerges as a critical target, as breaking this level could confirm a short-term bullish continuation. Analysts also highlight $2.38 as a feasible target if momentum persists.
Moving Averages and Trend Indicators
XRP’s position above the 100-hourly SMA is a bullish sign, indicating that buyers are in control of the short-term trend. Additionally, the price recently crossed above the 50-hourly SMA during its 14% surge, further reinforcing the bullish outlook. The convergence of these moving averages suggests that a golden cross—a bullish signal where a shorter-term average crosses above a longer-term average—could be forming on lower timeframes, potentially attracting more buyers.
Relative Strength Index (RSI)
The RSI on the hourly chart currently sits around 65, indicating that XRP is approaching overbought territory but still has room to run before reaching extreme levels (above 70). This suggests that the current rally could extend further, provided no major negative catalysts emerge.
Volume and Open Interest
One of the most encouraging signs for XRP bulls is the surge in trading volume and open interest. Open interest in XRP futures has jumped to $3.77 billion, reflecting growing speculative interest and confidence in further price gains. High volume accompanying the breakout above $2.15 adds credibility to the move, as it indicates genuine market participation rather than a low-liquidity pump.
Symmetrical Triangle Pattern
On the longer-term charts, XRP has been forming a 334-day symmetrical triangle, a consolidation pattern often preceding major breakouts. Analysts predict that this pattern could resolve between July and September 2025, with potential targets ranging from $2 to $5 depending on the direction of the breakout. The recent move above $2.15 could be an early indication of bullish intent, though confirmation of a full breakout from the triangle remains months away.
________________________________________
XRP Price Prediction: Short-Term Outlook (Next 24-48 Hours)
Given the current momentum, XRP appears poised for further gains in the immediate term. Analysts predict a potential 7% move toward $2.33 within the next 24 hours if the price maintains its position above $2.18. This target aligns with the upper boundary of the recent trading range and represents a key Fibonacci retracement level from the prior downtrend.
However, traders should remain cautious of the $2.20 resistance zone, where selling pressure could emerge. A failure to close above this level on the hourly or 4-hour charts might trigger profit-taking, leading to a pullback toward $2.10 or $2.05. On the flip side, a decisive break above $2.20 with strong volume could pave the way for a test of $2.33 and potentially $2.38 in the coming days.
________________________________________
What XRP Users Are Talking About This Week: Rumors, Predictions, and Debates
The XRP community has been abuzz with discussions this week, fueled by the coin’s impressive price action and broader market developments. Here are some of the key topics dominating conversations on platforms like Twitter, Reddit, and crypto forums:
1. Geopolitical Impact on XRP: The recent Iran-Israel ceasefire has been credited with boosting risk-on sentiment across markets, including cryptocurrencies. Many XRP holders believe this event contributed to the 14% surge that saw the price reclaim $2.00, with some speculating that further de-escalation could drive additional gains.
2. Regulatory Clarity for Ripple: Ongoing debates about Ripple’s legal battle with the U.S. Securities and Exchange Commission (SEC) continue to influence sentiment. While a resolution seems closer than ever, with rumors of a potential settlement circulating, uncertainty remains a key concern. A favorable outcome could act as a major catalyst for XRP, potentially pushing it toward new highs.
3. Adoption and Utility: XRP users are excited about Ripple’s continued partnerships with financial institutions for cross-border payments. Recent announcements of pilot programs in new regions have fueled speculation that increased adoption could drive organic demand for XRP, supporting long-term price appreciation.
4. Price Predictions: Community predictions range from conservative targets of $2.50 in the near term to more ambitious forecasts of $5 or higher by the end of 2025. Much of this optimism hinges on the symmetrical triangle breakout expected next year, as well as broader market trends like the Bitcoin halving in 2024.
These discussions highlight the mix of optimism and caution within the XRP community. While the recent breakout has bolstered confidence, many users remain wary of external factors like regulatory developments and macroeconomic conditions that could impact the coin’s trajectory.
________________________________________
XRP Climbs 9% as Open Interest Jumps to $3.77B: Eyes $2.38 Target
XRP’s 9% climb in a recent session, coupled with open interest soaring to $3.77 billion, underscores the growing interest from both retail and institutional traders. Open interest represents the total value of outstanding derivative contracts, and its sharp increase suggests that market participants are betting on continued price movement—likely to the upside given the current trend.
This surge in open interest aligns with XRP’s break above $2.15, reinforcing the notion that the rally has strong backing. Analysts now eye a $2.38 target, which corresponds to the 61.8% Fibonacci retracement level from the previous major swing high to low. Achieving this target would require sustained buying pressure and a break above the $2.33 resistance, but the current market dynamics suggest it’s within reach if no major sell-offs occur.
However, high open interest also introduces the risk of volatility. If the price fails to break higher and sentiment shifts, a wave of liquidations could amplify downside moves. Traders should monitor funding rates on futures platforms to gauge whether speculative positions are becoming overly leveraged, as this could signal an impending correction.
________________________________________
Ceasefire Boosts XRP Recovery: Bullish Continuation
Above $2.33?
The geopolitical landscape has played a surprising role in XRP’s recent recovery. Following a low of $1.90 amid broader market uncertainty, the announcement of a ceasefire between Iran and Israel injected optimism into risk assets, including cryptocurrencies. XRP responded with a 14% jump to reclaim the $2.00 level, a move that has since solidified with the break above $2.15.
This recovery highlights XRP’s sensitivity to external catalysts. While technical factors like resistance levels and chart patterns drive day-to-day price action, macro events can act as significant tailwinds or headwinds. If the ceasefire holds and global markets remain stable, XRP could see continued buying interest from investors seeking exposure to high-growth assets.
The key level to watch now is $2.33. A break above this resistance with strong volume could confirm a short-term bullish continuation, potentially targeting $2.38 or higher. Conversely, if geopolitical tensions resurface or broader market sentiment sours, XRP might struggle to maintain its gains, with $2.10 acting as the first line of defense.
________________________________________
When Will XRP Price Hit All-Time High? Timeline Revealed
XRP’s all-time high (ATH) of $3.84, reached during the 2017-2018 bull run, remains a distant target for many holders. However, recent technical developments and market trends provide clues about when the coin might approach or surpass this level.
Symmetrical Triangle Breakout: July–September 2025
As mentioned earlier, XRP has been forming a 334-day symmetrical triangle on the weekly chart, a pattern characterized by converging trendlines as price swings narrow over time. Such patterns often precede significant breakouts, with the direction determined by market sentiment at the time of resolution. Analysts predict that this triangle could break between July and September 2025, offering a window for a major price move.
If the breakout is bullish, targets range from $2 (a conservative estimate based on prior resistance) to $5 (a more optimistic projection based on the triangle’s height). A $5 target would represent a new ATH, surpassing the 2018 peak by over 30%. This scenario assumes favorable market conditions, including a broader crypto bull run potentially triggered by the Bitcoin halving in 2024.
Factors Influencing an ATH
Several factors could influence whether XRP reaches a new ATH within this timeline:
• Regulatory Resolution: A positive outcome in Ripple’s SEC lawsuit could remove a major overhang, unlocking significant upside potential.
• Market Cycles: Crypto markets often follow cyclical patterns, with bull runs occurring every 3-4 years. If 2025 aligns with the next cycle peak, XRP could ride the wave to new highs.
• Adoption Growth: Increased use of XRP for cross-border payments through RippleNet could drive organic demand, supporting a higher price floor.
• Macro Environment: Favorable economic conditions, such as low interest rates or stimulus measures, could boost risk assets like XRP.
While predicting an exact date for an ATH is impossible, the July–September 2025 window provides a reasonable timeframe for a potential breakout. Investors should remain attentive to technical confirmation and external catalysts as this period approaches.
________________________________________
XRP Price Reclaims Key Resistance: Are More Gains on the Horizon?
XRP’s reclaiming of the $2.10 and $2.15 levels marks a significant milestone in its recovery from the $1.92 low. This move above key resistance zones suggests that bullish momentum is building, with the potential for further gains if higher levels are breached.
The price is now trading above $2.18, and a close above $2.20 could signal the start of a fresh increase. However, the $2.20-$2.33 range remains a critical battleground. Bulls will need to defend recent gains while pushing for a decisive break above these levels to confirm the next leg up. If successful, targets of $2.38 and beyond come into play, aligning with analyst predictions and Fibonacci extensions.
On the downside, a failure to hold $2.10 could see XRP retest lower supports at $2.05 or $1.92. Such a pullback would not necessarily invalidate the bullish trend but could delay the anticipated rally toward higher targets. Traders should use stop-loss orders and monitor volume trends to manage risk during this volatile period.
________________________________________
Long-Term XRP Price Prediction: $2 to $5 by 2025?
Looking beyond the immediate term, XRP’s long-term outlook remains optimistic, contingent on several key developments. The symmetrical triangle pattern, if resolved bullishly, could propel XRP toward $2-$5 by the end of 2025. This range accounts for both conservative and aggressive scenarios, with the higher end assuming a full market cycle peak and positive catalysts like regulatory clarity.
Even in a more cautious scenario, XRP appears well-positioned to reclaim its prior highs above $3 if adoption continues to grow and broader crypto sentiment remains favorable. Key drivers include Ripple’s expansion into new markets, potential listings on major exchanges post-SEC resolution, and technological upgrades to the XRP Ledger that enhance scalability and utility.
However, risks remain. Regulatory setbacks, competition from other payment-focused cryptocurrencies, and macroeconomic downturns could cap XRP’s upside. Investors with a long-term horizon should diversify their portfolios and remain adaptable to changing market conditions.
________________________________________
Conclusion: XRP’s Path Forward After $2.15 Breakout
XRP’s recent breakout above the $2.15 resistance has ignited optimism among traders and investors, with the coin now trading at $2.18 after an 8.2% surge in 24 hours. Technical indicators like the 100-hourly SMA and rising open interest of $3.77 billion support a bullish near-term outlook, with targets of $2.33 and $2.38 in sight if momentum holds. The geopolitical boost from the Iran-Israel ceasefire and ongoing community discussions about adoption and regulation further fuel the narrative of potential gains.
In the short term, XRP must overcome resistance at $2.20 to confirm the next leg up, while holding support at $2.10 to avoid a pullback. Looking further ahead, the symmetrical triangle pattern suggests a major breakout window between July and September 2025, with price targets ranging from $2 to $5—potentially marking a new all-time high if conditions align.
While challenges like regulatory uncertainty and market volatility persist, XRP’s current trajectory indicates that more gains could be on the horizon. Traders and investors should stay vigilant, monitoring key levels, volume trends, and external catalysts to capitalize on this evolving opportunity. Whether XRP sustains its rally or faces a correction, one thing is clear: the cryptocurrency remains a focal point of excitement and speculation in the ever-dynamic crypto market.
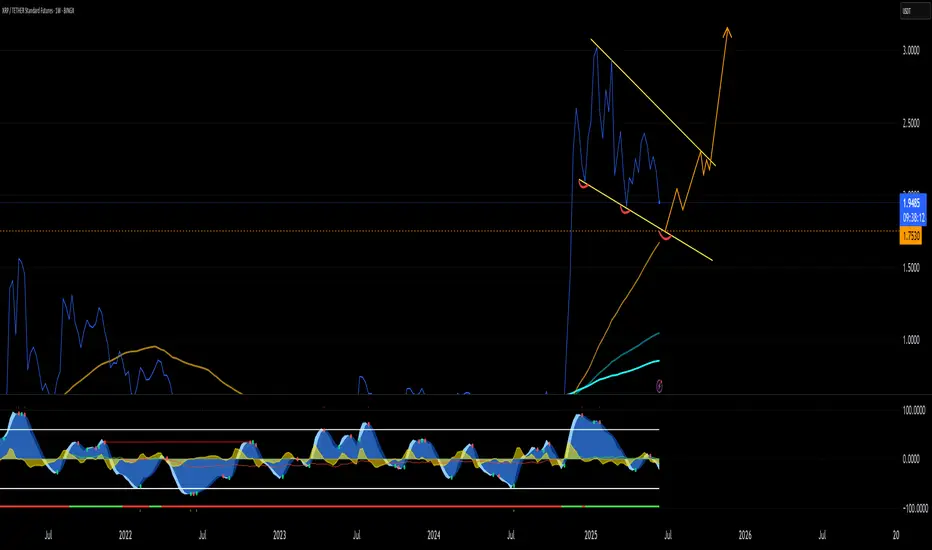
XRP Potential Wave 5Ripple could already be in the subwaves of gray 5. The gray descending trendline was broken and is serving as support for the correction.
In smaller timeframes, price is still making lower lows and lower highs. I´d wait for a clearer reversal in the 4H before taking long trades.
Invalidation is at 1.6134 (potential gray 4 low).

Weekly trading plan for XRPPrice showed a solid recovery after the weekend. At the moment, we can see a local bearish divergence on the hourly timeframe, so we might expect a short-term pullback toward the weekly pivot point level
Write a comment with your coins & hit the like button and I will make an analysis for you
The author's opinion may differ from yours,
Consider your risks.
Wish you successful trades ! mura

XRP — Triple Tap at Support or One More Low Before Lift-Off?🎯 BINANCE:XRPUSDT Trading Plan:
Scenario 1 (Support Holds):
Bullish above $1.90 — possible pre-breakout setup if structure improves
Look for volume/impulse above midrange to confirm move
Scenario 2 (Sweep Lower):
If $1.90 fails, set alerts at $1.39–$1.40 for reaction/reversal setup
Entry on strong reversal pattern at sweep zone
No Trade:
No action unless price at the range extremes or showing breakout structure
🔔 Triggers & Confirmations:
Only engage after confirmation: bullish SFP at $1.90 or $1.39–$1.40, or clear structure before breakout
📝 Order Placement & Management:
Buy: Only at $1.90 (on reclaim) or $1.39–$1.40 (on strong reversal)
Stop: Below range low ($1.90) or below sweep zone ($1.39)
Targets: $2.90 (range high), then $3.40 (liquidity sweep)
🚨 Risk Warning:
Wait for range extremes or breakout confirmation
Avoid chasing chop — patience until the setup is clean

XRP 3 Line Drive and Bull FlagXRP about to make 2 major chart patterns for a bullish move to $5 range. 3 Line drive and trendline hit on a bull flag.
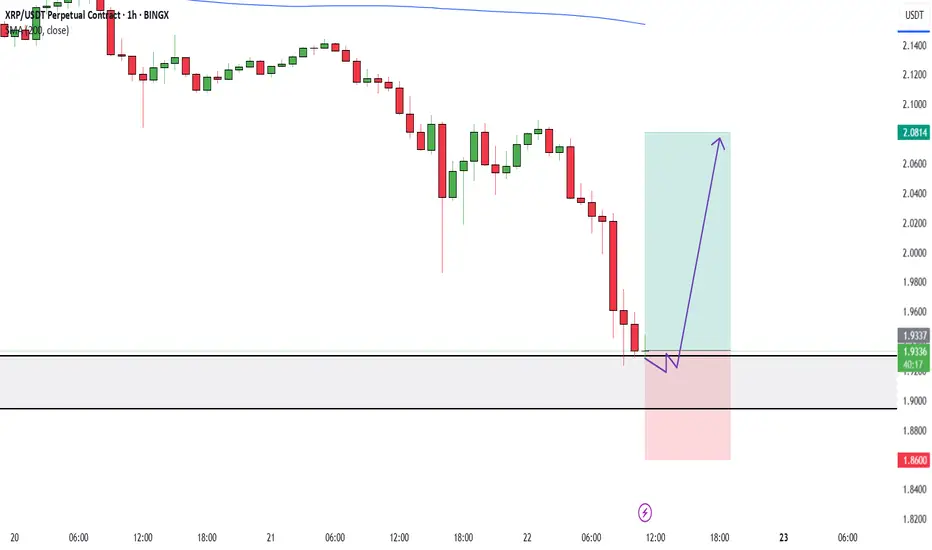
XRP should make a strong rejectionPrice is currently oversold and has eaten most the liquidity it could take for the current session. The 1.92 should hold and offer a bullish reversal in the short term.
My target is 2.0814
SL is 1.8600
XRPUSDT Has Breakout down channel bullish strong from bullish obXRPUSDT BREAKOUT ALERT!
4H Timeframe Analysis
XRP has officially broken out of its downward channel, confirming a strong bullish reversal from the key demand zone at 2.1600, where major buy orders were stacked. Momentum is building fast! 💥
🎯 Technical Targets Ahead:
🔹 1st Target: 2.3370 – Supply Zone
🔹 2nd Target: 2.4399 – Next Supply Zone
🔹 3rd Target: 2.6000 – Major Resistance
This breakout is showing solid volume and structure — keep an eye on these zones for potential reactions or continuations. 📈
🔥 Like, follow, comment, and join us for more premium crypto updates and real-time trade ideas.
By Livia 😜💎
#XRP #CryptoBreakout #TechnicalAnalysis #Altcoins #Bullish #CryptoSignals

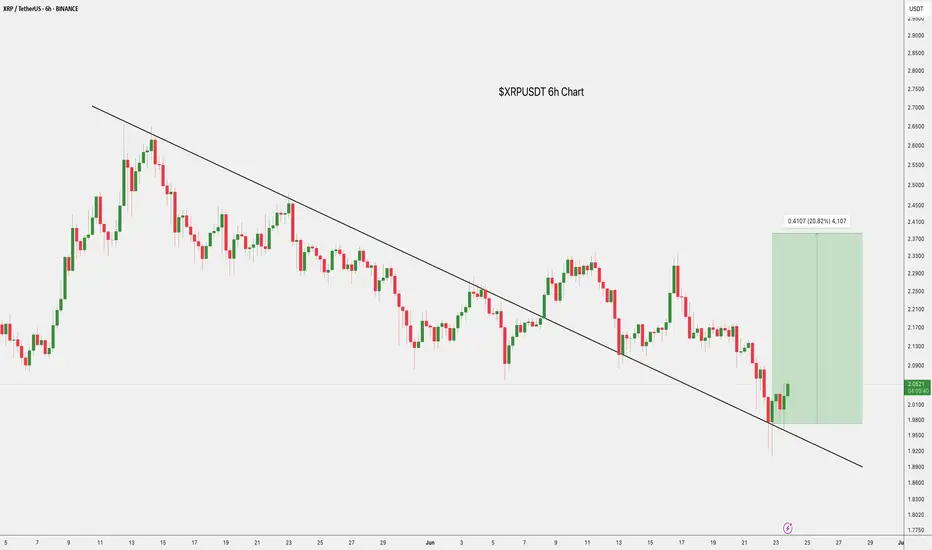
$XRP Trendline Breakout: +20% TargetCRYPTOCAP:XRP has broken out of a long-term descending trendline on the 6H chart, signaling a potential trend reversal.
Price is now holding above the breakout zone around $2.00, with a bullish target near $2.45, a potential 20% move.
Holding this support could fuel further upside.
DYRO, NFA