XRP: The Calm Before the ExplosionXRP has been in strong 100-day accumulation, with a few deviations along the way. Many altcoins have formed reversal patterns, and XRP is setting up for a sharp move upwards. Expecting a breakout from this consolidation phase, potentially propelling XRP to #2 in market cap. The stage is set for a major run!
Entry: NOW
TP: 4
XRPUST trade ideas

$XRP - Range Bound ConsolidationRanging:
Support: $1.9 to $2
Pivot: $2.45 to $2.5
Resistance: $3
Price is at PoC of Volume Profile
........
Bulls aiming for Breakout and Retest above $3 to lead towards Target Price $5
Bears aiming to Breakdown and Retest Failure of $2 support Band. Bears logical target are the Weekly MA50 at $1.20 and MA200 at $0.75
.......
Neutral stance. Expect further range bound Price Action between the Support-Pivot-Resistance Zones.
Operating with Tight Stop Loss at both extremes of the range seems logical.
Or maybe deploy counter hedges as well for studden upside or downside protection.

XRPUSDT after more range here more fall is ahead XRPUSDT is long-term still super bullish and we are looking for targets like 5$ and 10$ too but if the major resistance zone which is 3.1$ break to the upside else we are looking for more range here and even breakout of 2$ support zone to the downside and targets like 1.5$ and less and then we will update with long positions near that support zones mentioned on the chart too.
DISCLAIMER: ((trade based on your own decision))
<<press like👍 if you enjoy💚

XRP Update: Legal Battle Nearing End & Bullish DivergenceHey traders! 👋
Let’s talk about XRP, a coin that’s been fighting a legal battle with the SEC for years, but it looks like we might be approaching the end of this long-standing case. The lawsuit has been a major overhang, but the fight to get a favorable ruling could set the stage for big things ahead! Ripple is challenging the SEC's stance and aiming for a full win on all fronts, which would be massive for the future of the project. ⚖️
And it's not just about the lawsuit – XRP is making moves in the broader financial world with multiple ETF applications and strategic partnerships with banks. With all these developments, I’m starting to see a bright future for Ripple. Do you agree? 🌟
Looking at the chart, we’ve got a bullish divergence forming, which could signal a potential trend reversal. If XRP manages to break the current downtrend, we may target the supply zone next. However, if we break through that supply, we could be looking at new all-time highs. 🚀
What do you think? Are we about to see a breakout, or will XRP face more resistance? Let’s hear your thoughts in the comments below!
Happy trading, everyone! 💰📈

Ripple is Nearing Important SupportHey Traders, in today's trading session we are monitoring XRPUSDT for a buying opportunity around 2.35 zone, XRP is trading in an uptrend and currently is in a correction phase in which it is approaching the trend at 2.35 support and resistance area.
Trade safe, Joe.

Xrepusdt down trend Xrp downtrend And the fiest TP will be 2.279
The xrp now in W4 and the next wave 5 will be down

XRP starts a breakout for 2.84XRP caught a nice pattern for an exit. Even if it corrects, our direction is 2.84. not investment advice.
Xrpusdt 4hA bullish QAM is forming, and I think we can make a profit at 2.6, and 2.34 would be a good point to buy, with a target of 2.98.

My take on XRP for Vecino Peache.XRP is currently testing the 50 EMA on the daily time frame, a strong resistance level. Throughout February, it made multiple attempts to break above but failed. This suggests a possible correction. A confirmed break below the 200 EMA on the daily chart would further validate this bearish outlook.
My take; I have an OTZ (Optimal Trade Zone) on the 4-hour time frame, which acts as a strong support level. If price breaks below this zone, it signals a potential shift in market direction. As long as XRP respects this support, I will trade it conservatively.
Let me know what are your thoughts on my take.

XRP Triangle... again...
Ripple could be repeating the triangle pattern made in black 3-4 in a larger scale, for gray 3-4.
My primary count considers we're currently in black D.
Note that the resolution of the triangle could take a while.

XRP at $1.5 will be a good buyXRP at $1.5 will be a good buy
We made it to out $1.96 forecasted level. However, if the sell pressure continues, we may see this baby ride to $1.5.
I will load this asset if it makes mistakes down to $1.5 zone

BULLISH SCENARIOThis is the bullish case for XRP. I see a bullish cypher pattern for XRP. Buying area for XRP is below $1. Whales will accumulate in this region in preparation for the next cycle. XRP will have a good contribution in the Quantum Financial System.

XRP/USDTHello friends
Due to the recent decline, we have found two good support areas for you, which if reached, can be bought and moved to the specified targets.
*Trade safely with us*

Some analytics on XRP for youXRP is in triangles and we need to consider both upside and downside. In the video I pointed out an important level and possible targets
The author's opinion may differ from yours,
Consider your risks,
DYOR.

$XRP Soared 2.32% As Franklin Templeton Files for Spot $XRPThe [rice of CRYPTOCAP:XRP Soared 2.32% Amidst 1.5 trillion Franklin Templeton files for spot CRYPTOCAP:XRP ETF with CBOE. In another news, Ripple ( CRYPTOCAP:XRP ) receives approval from Dubai Financial Services Authority to provide crypto payments & services in the UAE.
Despite this fundamentals, CRYPTOCAP:XRP seems undeterred rather moving gradually with a steady momentum as indicated by the Relative Strength Index (RSI) at 48.
For CRYPTOCAP:XRP , the 78.6% Fibonacci retracement point is acting as support, should CRYPTOCAP:XRP break that level, it could lead to extreme selling pressure.
Similarly, a breakout above the 38.2% Fibonacci pivot, could spark a bullish renaissance for CRYPTOCAP:XRP as the RSI is well stipulated for that move.
What Is XRP / XRP Ledger?
Launched in 2012, the XRP Ledger (XRPL) is an open-source, permissionless and decentralized technology. Benefits of the XRP Ledger include its low-cost ($0.0002 to transact), speed (settling transactions in 3-5 seconds), scalability (1,500 transactions per second) and inherently green attributes (carbon-neutral and energy-efficient). The XRP Ledger also features the first decentralized exchange (DEX) and custom tokenization capabilities built into the protocol. Since 2012, the XRP Ledger has been operating reliably, having closed 70 million ledgers.
XRP Price Live Data
The live XRP price today is $2.29 USD with a 24-hour trading volume of $5,726,053,874 USD. XRP is up 5.48% in the last 24 hours, with a live market cap of $132,834,233,937 USD. It has a circulating supply of 58,043,299,826 XRP coins and a max. supply of 100,000,000,000 XRP coins.

the Head and Shoulders of the Month!Hello TradingView Family / Fellow Traders. This is Richard, also known as theSignalyst.
📈 This week, XRP rejected the $2 support level and has been trading higher.
Today, XRP formed an inverse head and shoulders pattern and broke its green neckline upward.
🏹 As long as the bulls hold, a movement towards the upper bound of the falling red channel would be expected.
📚 Always follow your trading plan regarding entry, risk management, and trade management.
Good luck!
All Strategies Are Good; If Managed Properly!
~Rich

XRP to 6.8$ !Sounds crazy? Well, let me break it down for you...
The last time XRP broke out from this accumulation zone, it did a 400% pump in just a few days . Right now, the chart is showing exactly the same pattern, and the liquidity is already loaded.
If we break the $2.98 resistance, the next target is $4.89, and after that... $6.8 is inevitable. 🚀
Don't sleep on this one. XRP is ready to surprise everyone.
💎 Like & Follow for more gems 🔥
🐺 KIU_COIN 🐺

$XRP Accumulation & Breakout Analysis
🔸 Key Support Zone at 2.22 - 1.92:
XRP is currently in an accumulation phase within this zone. Holding above this level could trigger a bullish reversal.
🔸 Upside Target: $5.00+
A successful breakout can lead to a strong rally towards $3.00 - $5.00+.
🔸 Risk Level at 1.92:
A breakdown below 1.92 may invalidate the bullish outlook and push XRP lower.
🔸 2nd Accumulation Zone: 1.60 - 1.30
If XRP loses the 1.92 support, the next strong demand area is between 1.60 - 1.30, where buyers may step in again.
🔸 Bullish Scenario:
Enter between 2.22 - 1.92, confirmation above 2.50 for an upside move.
Bearish Scenario: If price drops below 1.92, watch for accumulation in 1.60 - 1.30 for a new entry.
Targets: $3.00, $4.00, $5.00+
Stop Loss: Below 1.30 (if entering lower zone).
Overall Sentiment: Bullish on breakout, cautious below 1.92! 🚀

XRP - TOP ConfirmationIf I am correct price creates a low timeframe lower high in march followed by
devistating down price action.
This will take month. Patience.

XRP | Head and Shoulders Pattern.
Head: $3.4.
Left Shoulder: $2.9.
Right Shoulder: $3.0.
The Neckline: $2.00.
Components of the Pattern:
Left Shoulder: Represents the first peak at $2.9, where the price rose and then retreated to the neckline at around $2.00.
Head: The highest peak at $3.4, the topmost point of the pattern, followed by a retreat to the neckline at $2.00.
Right Shoulder: The second peak at $3.0, lower than the head, followed by a retreat to the neckline at $2.00.
Neckline: Remains at approximately $2.00, a horizontal support level connecting the lows after the left shoulder and the head and the right Shoulder.
Implications of the Pattern:
The pattern remains a bearish reversal pattern, indicating a weakening of bullish momentum after reaching the head at $3.4.
If the price breaks below the neckline ($2.00) with increased volume, this confirms the pattern’s completion and signals a significant decline.
Current Situation (March 2025):
The current price ($2.2) is very close to the neckline ($2.00), making a breakout likely in the coming days.
The potential crossover of the moving averages (blue and red lines) supports the possibility of a trend change.
NOTE:
If the price bounces off the neckline ($2.00) with increased volume, this invalidates the pattern.
In this case, the price might attempt to retest resistance at $3.0 (right shoulder peak) or even $3.4 (head peak).
Conclusion:
The Head and Shoulders pattern: indicates a strong potential for a bearish reversal, if the price breaks below the neckline ($2.00). Confirmation of the breakout with increased volume is essential, while considering fundamental news that might influence the market.

XRPUSDT: A Massive Move Is Coming – But Will It Be Up or Down?Yello, Paradisers! Are we about to see an explosive breakout in XRP, or is a deeper pullback lurking around the corner? Let’s break it down.
💎XRPUSDT has formed a falling wedge alongside a bullish divergence, signaling a potential upside move. Adding to the bullish case, we also see an inverse head & shoulders pattern forming underneath – a combination that significantly increases the probability of a breakout.
💎For a high-probability bullish confirmation, we need a breakout and candle close above the falling wedge.
💎That said, if price retraces deeper, we should be watching the major support zone for a potential bounce. A bullish I-ChoCH on lower timeframes will serve as the key confirmation for a reversal.
💎The invalidation level? If XRPUSDT breaks down and closes candle below the major support zone, this bullish setup will be completely invalidated.
🎖Stay sharp, Paradisers. The next move will decide everything! As always, discipline and patience will separate the winners from the crowd. Be strategic, trade smart, and wait for the highest probability setups.
MyCryptoParadise
iFeel the success 🌴

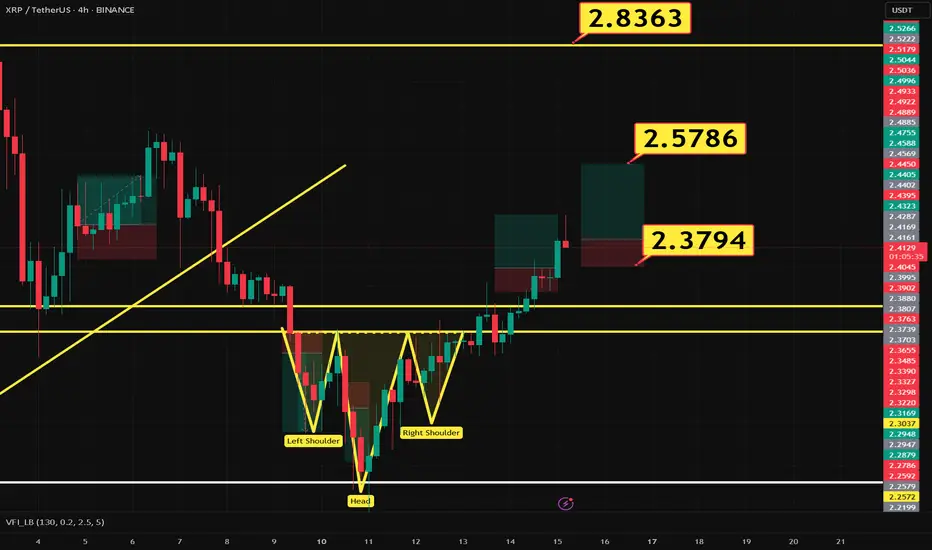
4 Hour showing a potential Inverse H$S setup...Let's see if this setup materializes and creates a measured move up to the next Volume Shelf. Indicators favoring this.

4 Hour Inverse H&S Potentially Setting Up...Let's see if this materializes and creates a nice measured move pop.
