$XRPUSDT 6h Chart. $XRP/USDT 6H chart shows a clean breakout above the descending trendline, followed by a successful retest at the key demand zone.
This confluence suggests bullish momentum is building up.
As long as price holds above the $2.1023 support, the setup points toward a potential 17% upside move targeting the $2.4873–$2.5035 range.
DYRO, NFA
XRPUST trade ideas

XRP LONG TRADE SETUPXRP/USDT is currently holding at a strong support zone , with a high probability of an upward price move.

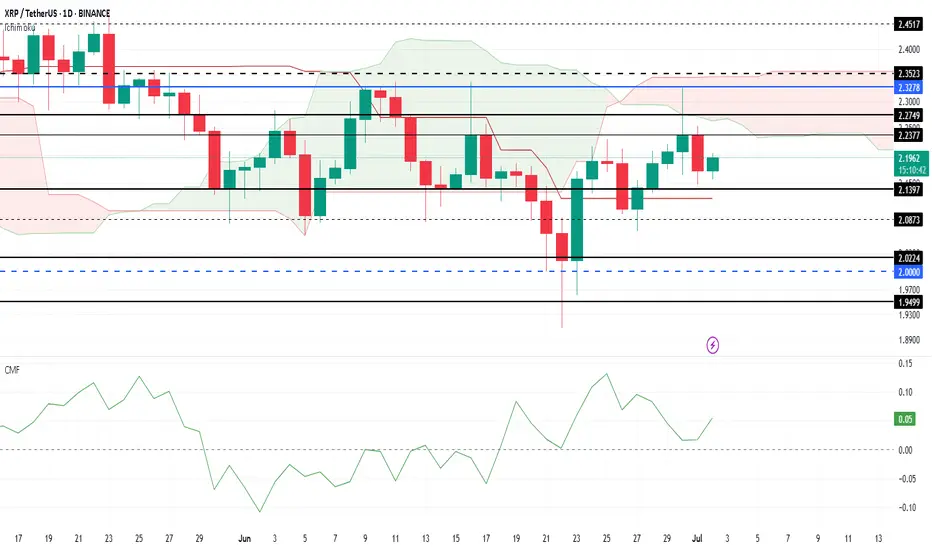
XRP Price Today: Rising Outflows Hinder RecoveryXRP has experienced notable volatility throughout June, with the altcoin failing to break through the $2.32 resistance level. Despite multiple attempts, XRP remains consolidated below this critical price point.
This price action indicates a lack of bullish momentum in the short term, making further gains challenging unless the resistance is breached.
The Ichimoku Cloud is turning negative , suggesting that bearish momentum could intensify for XRP. With the cloud positioned above the candlesticks, it signals further pressure on the price.
Additionally, rising outflows are visible on the CMF, as the indicator moves closer to the zero line, adding to the negative outlook.
If selling pressure continues to mount, XRP could fall below its support at $2.13 , potentially slipping to $2.02. This would mark a significant decline and invalidate the bullish thesis, signaling that XRP’s upward momentum could be at risk in the near future.

HolderStat┆XRPUSD before retest of the $2 levelBINANCE:XRPUSDT has rebounded from its 2.08 base and broken out of consolidation, aiming for the upper diagonal resistance near 2.40–2.60. With recurring bullish patterns and a history of strong follow-through after similar setups, momentum may build if 2.20 is cleared.

HolderStat┆XRPUSD consolidation of the assetBINANCE:XRPUSDT has bounced from the 2.02 level and is approaching the upper edge of a large consolidation structure. Multiple prior consolidation zones have led to breakouts, and the current bounce hints at continuation toward 2.30. A clean close above resistance would confirm bullish intent.

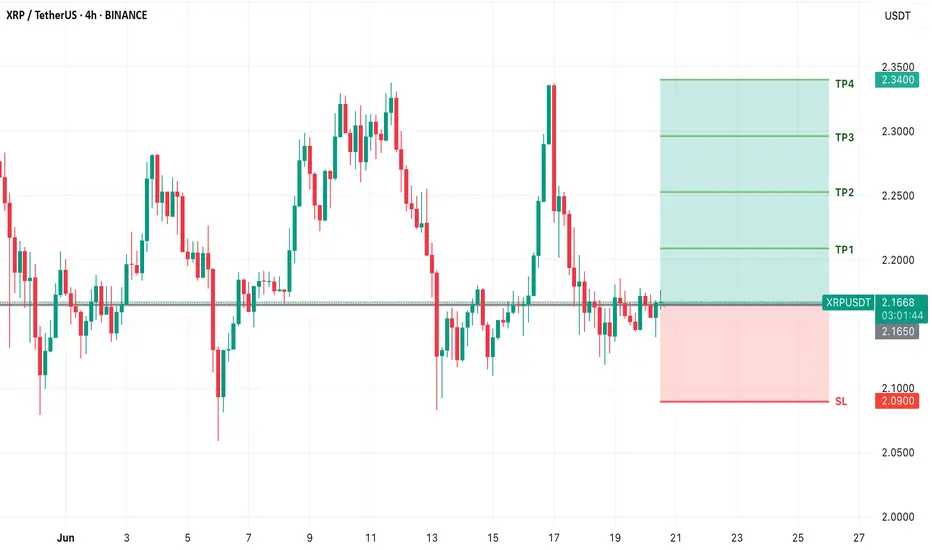
XRP Bears Ready to Feast? Short Setup Targets $1.93 With 1.6:1RROn the XRPUSDT 4-hour chart, price action shows a clear rejection of higher levels and a transition to a bearish tone. After rallying up toward the 2.19–2.18 USDT resistance zone, XRP failed to sustain momentum and rolled over sharply. The Supertrend indicator flipped to red, signaling renewed selling pressure.
Currently, the market is retesting the 2.09–2.10 USDT zone, which previously acted as strong support but is now functioning as resistance. This is a classic bearish retest structure, often confirming further downside if price fails to reclaim the level decisively. Beneath the current price, the most significant support area rests near 1.93 USDT, where buyers previously defended with strong volume.
This backdrop supports a short-biased trade setup. The ideal entry would be around 2.09–2.10 USDT, where the market is testing the broken support as resistance. The stop loss should be positioned just above the prior swing high and the top of Resistance Level 2, at 2.19 USDT. If the rejection holds, the take profit target aligns with the clear structural support around 1.93 USDT. This setup offers a risk of roughly 0.10 per XRP and a potential reward of about 0.16, maintaining a sound risk-reward profile near 1.6:1.
While a bullish reversal is possible if XRP can reclaim 2.19 USDT on a strong daily close, current price action and trend signals favor sellers in the near term.

XRP ANALYSIS🔮 #XRP Analysis - Update 🚀🚀
💲 As we said earlier #XRP performed the same. Resistance1 achieved easily. Now we can see that there is a formation of Falling Wedge Wedge Pattern in #XRP and we can see a more retest before a bullish movement again.
💸Current Price -- $2.1729
📈Target Price -- $2.5964
⁉️ What to do?
- We have marked crucial levels in the chart . We can trade according to the chart and make some profits. 🚀💸
#XRP #Cryptocurrency #Breakout #DYOR

Possible outcome for $xrp 🚀 XRP Set for a Major Breakout: Bullish Outlook on XRP/USDT
The XRP/USDT chart on the daily timeframe presents an exciting bullish setup that could see XRP rally towards significant highs in the coming months. Let’s break down the key technical insights and what they could mean for traders and investors.
📊 Current Price Action
At the time of analysis, XRP is trading around $2.15. The price has been consolidating in a wide range after an explosive move that took XRP beyond the $3 mark earlier in the year. This consolidation reflects market indecision but also builds up potential energy for a strong directional move.
🏗 Key Levels
Support Zone: $1.70 - $1.85
This zone has been identified as a strong demand area where buyers previously stepped in, preventing further decline. The chart suggests XRP might revisit this area, forming a solid base before a rally.
Immediate Support: ~$2.00 - $2.05
There’s a minor support level here, but the major bullish reversal is expected closer to the deeper support zone.
Resistance Zone: $3.20 - $3.50
This is the target region for the next bullish leg. Historically, this area has capped XRP’s upward movements, but a breakout could open the door to higher prices.
🔑 Bullish Scenario
The chart outlines a potential move where XRP could: ✅ Dip into the lower support range between $1.70 and $1.85, trapping late sellers and inducing demand.
✅ From this accumulation zone, XRP could launch a powerful upward rally.
✅ The rally could target the $3.20-$3.50 resistance area — a key zone that aligns with prior highs.
💡 Why This Setup Looks Bullish
Clear structure of higher timeframe accumulation: The long consolidation phase suggests that XRP may be preparing for a large move, typical after prolonged sideways price action.
Liquidity grab potential: A dip below minor support would shake out weak hands, before a sharp reversal.
Room for upside: Once $3.20 is tested and broken, FOMO (fear of missing out) could drive prices higher, possibly beyond prior highs.
⚠ Risk to Monitor
While the setup points to a bullish move, traders should keep an eye on:
The strength of the $1.70-$1.85 zone. If this level fails, deeper downside could occur.
External factors such as regulatory news or broader crypto market sentiment that might impact XRP’s price action.
🌟 Conclusion
The XRP/USDT daily chart hints at an imminent bullish opportunity as price approaches a key support zone. If the outlined path unfolds, XRP could see significant upside towards the $3.20-$3.50 area in the coming months. For traders, patience and careful risk management at the support levels could position them to ride the next wave of XRP’s move.

HolderStat┆XRPUSD correction from the trend lineOKX:XRPUSDT found footing at 2.09 and now grinds beneath descending resistance. Regaining 2.18 should unlock a glide toward 2.25-2.35 inside the larger bull channel, whereas failure to defend 2.05 risks a trip to 1.95 reload territory.

XRPUSDT Forming 2017-Style Flag — Major Breakout Loading! BINANCE:XRPUSDT is currently forming a classic bullish flag pattern, a setup that looks strikingly similar to what we saw back in 2017 before CRYPTOCAP:XRP went on a massive run. The price has been consolidating within a tight range, and this could be the calm before a powerful breakout.
Back in 2017, a similar flag formation led to a parabolic uptrend once the resistance was broken. While history doesn’t repeat exactly, this pattern suggests the potential for a significant upside move if the breakout confirms. Traders and investors should keep a close eye on this structure — a breakout from this flag could reignite bullish momentum and open the door for a sharp rally.
This is a buy and hold scenario for those who believe in XRP’s potential, but remember — risk management is key. Always use a stop loss below the flag support to protect your capital. Momentum could build quickly, so stay alert and watch for volume confirmation on the breakout.

3 weeks of breakoutJust put on a long position, looking to hold till Monday open.3 weeks of breakout and false break

XRP Still in Buy Zone – Eyes on $2.50+our chart clearly marks that XRP has bounced off a strong buy zone (around the $2.10–$2.15 range), aligning well with a classic setup: price hitting support, creating a small base, and starting an upward rotation. 👇
Support area respected – The highlighted circle shows XRP revisiting the demand zone and quickly rebounding, very bullish behavior.
Lower wicks & volume spike – Indicate absorption of selling pressure and possible institutional interest.
Green arrow projection – Suggests a break above the immediate resistance (~$2.17 EMA/Ichimoku levels) could trigger a rally toward the next resistances around $2.22, $2.47, and potentially $2.63.
“Still in buy zone” annotation – Absolutely valid: as long as XRP stays above that key base ($≈$2.10), the bullish case holds.
🔍 Market Context
Range consolidation between ~$2.10–$2.30 has been the dominant theme, awaiting a breakout catalyst (e.g., ETF approvals or legal clarity)
thecryptobasic.com
+14
fxempire.com
+14
crypto.news
+14
.
Analysts highlight a falling wedge and support zone between $2.00–$2.20—if price holds, a move toward $3–$4 is plausible .
A range-bound weekly outlook anticipates a push toward $2.50 resistance before exploring higher targets .
✔️ Summary
Buy zone holding: Bullish pattern confirmed with rebound from support.
Key resistance levels: Watch for a breakout above $2.17/EMA and then $2.22–$2.30/$2.50.
Ideal strategy: Maintain position above support; add on breakout, targeting $2.50–$3.00.
Risk points: A drop below $2.10 could test $2.00 or even $1.85 support.

Your Liquidation can be Exchanges Business & Profit Ever feel like the market is designed to move against you ?
That your stop-loss is a magnet for price action?
What if it’s not just in your head? Behind every liquidation wave lies a structure and maybe even a strategy.
In this post, we dive deep into how exchanges might be benefiting from your losses and most importantly, how to flip the script in your favor.
Hello✌
Spend 3 minutes ⏰ reading this educational material.
🎯 Analytical Insight on XRP:
XRP is approaching a major daily support zone, aligned with the psychological level of $2.00. This area has historically provided strong buying interest. A potential rebound from this level could lead to a minimum upside of 16%, with a medium-term target around $2.50 . 📈
Now , let's dive into the educational section,
💣 Liquidation as a Business Model
In crypto derivatives markets, liquidation isn’t just a risk it’s a revenue stream. When your position gets liquidated, your funds don’t just vanish into thin air they become someone else’s gain. Often, the exchange itself.
Remember, exchanges control:
Price data
Order book matching
Access to retail trading behavior
That means they can anticipate and even design market conditions that favor liquidations . Especially from retail traders who overleverage or place their stops in obvious spots.
Scary? Maybe.
Avoidable? Absolutely.
📊 Why TradingView Is Where Your Survival Starts
When it comes to defending yourself against liquidity traps, your best weapon is data real data. Not gut feelings, not Telegram signals. TradingView offers a range of tools that help you detect the footprints of large players before they run over your position. Here’s how to use them:
Liquidity Zones: These zones highlight areas where most stop-losses cluster perfect for identifying where big players are likely to push price. Use community indicators like “Liquidity Grab Zones” or manually plot key levels.
Volume Profile: Shows you exactly where the highest traded volumes occurred. These “high interest” areas often become magnets for price and are favorite playgrounds for liquidity raids.
Order Blocks: Smart money often enters the market through order blocks. Tools like “SMC Tools” or custom scripts in TradingView help you mark these institutional footprints.
Open Interest & Funding Rates (via external data plugins): Watch for spikes in funding or sudden OI drops these can be early signs of liquidation sweeps.
Replay Tool: Rewind the market to any date and simulate price movement in real time. An amazing way to train your eyes on how liquidity hunts usually play out.
Bottom line? TradingView isn’t just a charting tool it’s your radar system in a market full of traps. But only if you use it the right way.
🧠 Market Psychology: Your Fear Is Their Fuel
Exchanges and the whales who partner with them thrive on predictable retail emotion:
Fear of missing out (FOMO)
Fear of liquidation
Greed for fast gains
They don’t need to fake anything your emotions are enough. They just need to let the herd run into the slaughterhouse. Your best defense? Awareness, logic, and a data-first mindset.
⚠️ How to Avoid Becoming Their Target
Stop following noise; start tracking smart data.
Never use stop-losses at obvious round levels or under candle wicks these are classic sweep zones.
Watch funding rates if it looks too bullish or bearish, get cautious.
Don’t enter trades when you feel too confident that’s often when traps are most effective.
Aim for higher-timeframe setups and avoid scalping in manipulated zones.
Most importantly: Treat every chart as a trap until proven otherwise.
🧭 Final Take
In crypto, knowledge isn’t power it’s protection. If you’re still hoping the market plays fair, it’s time to change perspective. Use TradingView to out-think and outlast the systems designed to exploit you. You don’t have to be a genius just informed.
✨ Need a little love!
We put so much love and time into bringing you useful content & your support truly keeps us going. don’t be shy—drop a comment below. We’d love to hear from you! 💛
Big thanks ,
Mad Whale 🐋
📜Please remember to do your own research before making any investment decisions. Also, don’t forget to check the disclaimer at the bottom of each post for more details.

#XRP/USDT#XRP
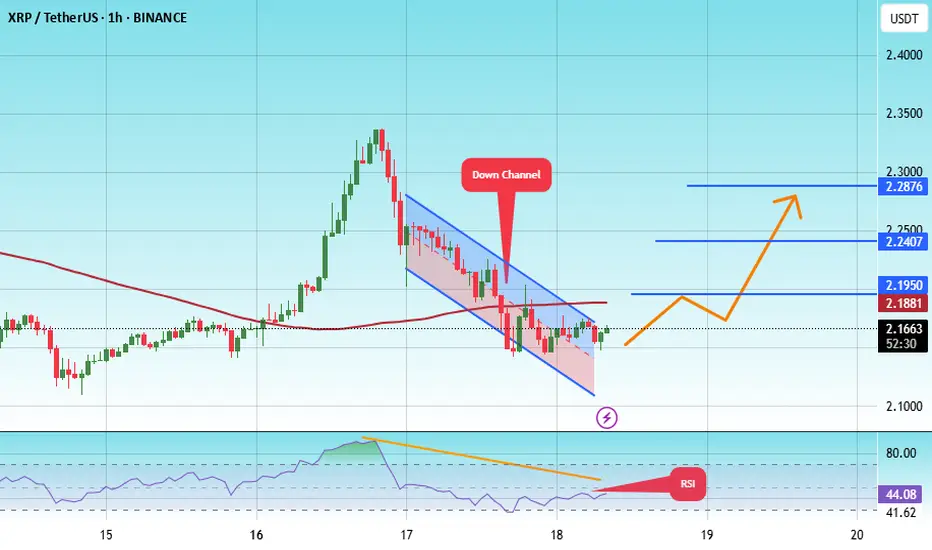
The price is moving within a descending channel on the 1-hour frame, adhering well to it, and is heading towards a strong breakout and retest.
We are experiencing a rebound from the lower boundary of the descending channel, which is support at 2.11.
We are experiencing a downtrend on the RSI indicator that is about to be broken and retested, supporting the upward trend.
We are looking for stability above the 100 Moving Average.
Entry price: 2.16
First target: 2.20
Second target: 2.24
Third target: 2.28
DeGRAM | XRPUSD out of the triangle📊 Technical Analysis
● XRP has retested the long-term purple trend-line it broke in May and bounced at the $2.05–2.15 support, locking in a higher-low on the new rising base.
● Price is coiling inside an ascending triangle capped by $2.44; the pattern’s 1 : 1 swing and the channel roof intersect at $2.81. RSI stays above 50, showing buyers still control momentum.
💡 Fundamental Analysis
● In the remedies brief the SEC trimmed its disgorgement request, and the judge set a July settlement check-in, reducing tail-risk.
● Santiment notes whale wallets (>10 M XRP) accumulated ~60 M XRP since 14 Jun, hinting at renewed institutional demand.
✨ Summary
Buy $2.10–2.20; sustained break above $2.44 targets $2.60 then $2.81. Invalidate on a 16 h close below $1.98.
-------------------
Share your opinion in the comments and support the idea with a like. Thanks for your support!

#XRP/USDT#XRP
The price is moving within a descending channel on the 1-hour frame, adhering well to it, and is heading towards a strong breakout and retest.
We are experiencing a rebound from the lower boundary of the descending channel, which is support at 2.21.
We are experiencing a downtrend on the RSI indicator that is about to be broken and retested, supporting the upward trend.
We are heading for stability above the 100 Moving Average.
Entry price: 2.24
First target: 2.27
Second target: 2.30
Third target: 2.35

XRP: You Have What it Takes, Success is Yours!It seems XRP has been trading at the same price for more than 7 months. The mean price since XRP broke above $2 back in December 2024.
Can you see what I am referring to? Good if you do.
If you don't, continue reading, everything will be clear in a few seconds.
Price action
Is neutral price action at this point bearish or bullish?
Bullish.
Most of the action has been happening above $2 and this is clearly bullish.
The upswings are bigger than the down-swings.
Buy volume is higher than sell volume.
The main move is an advance that started in November 2024.
The bigger picture and major trend is bullish.
The fundamentals are getting better everyday; there is nothing bearish on this chart.
Where to next?
New all-time high and higher prices.
How to approach the market
Start with 3-5X. When the bullish action is fully confirmed, the market starts to move higher supported by high volume and marketwide wide action, go all-in. That's the only way to win.
Make the winners pay big. Keep the losers small.
If you don't take risk you can't win in this or any other game.
Thanks a lot for your continued support.
Trading tips
Only risk money you can afford to lose and make sure to do a calculated risk. Not crazy risk nor gamblers risk. 2-3X. As the market advances, 3-5X. When the trend is confirmed, go higher and continue to increase until you max everything out. When our target hits sell everything and never look back. You can buy again when there is a crash or a retrace. Opportunities are endless.
If you secure profits and the pair continues to grow; who cares! Buy one that is safe and secure. Buy a new one that is trading low. Don't go back to the same pair just because you won. Detach. Take some time out. Secure profits. Comeback refreshed and the market will bless you with endless opportunities, it is not going away.
Motivation
Just make sure to win-win-win.
If you can win small, you will eventually win big.
Win, win, win. Make a habit of winning.
Go step by step.
Many people overestimate what they can do in a year but underestimate what they can achieve in a decade. Think long-term.
Instead of tomorrow, next week or next month, think how much money you are going to make in a decade if you start preparing now. What if everything you are doing does not need to yield an instant result? Now you can relax your mind. It will all come to you, but let it come, there is no rush.
Even if you hurry, life will continue to give you what you need, what you earned and not what you think is best. Whatever situation you are in right now is the result of past action. Take responsibility and watch everything grow.
Your future can change if you make the right choices today. You can change everything, start now; what can I do today to make my day better? What is the best action to take? Should I go out and get drunk, sniff a bunch of drugs, or, should I exercise and eat clean, do what it takes to reach my goals?
Choose wisely and watch your profits grow.
Whatever results you get when trading is just a reflection of your mind and the choices you make in your day to day live. Belief and take control.
You have what it takes.
Success is yours.
Namaste.

XRP - Straight HorseSight!XRP Vision is quiet clear - The two areas are areas of hold and from this side straight up move can be seen, though slow death move can be seen on the line marked, but its mostly due to liquidity sweeps!

XRP - Trade The Range!Hello TradingView Family / Fellow Traders. This is Richard, also known as theSignalyst.
📈XRP has been trading within a range between $2 and $2.35 in the shape of a flat rising broadening wedge pattern in red.
🏹 The highlighted blue circle is a strong area to look for buy setups as it is the intersection of the green support and lower red trendline acting as a non-horizontal support.
📚 As per my trading style:
As #XRP approaches the blue circle zone, I will be looking for bullish reversal setups (like a double bottom pattern, trendline break , and so on...)
📚 Always follow your trading plan regarding entry, risk management, and trade management.
Good luck!
All Strategies Are Good; If Managed Properly!
~Rich

HolderStat┆XRPUSD reboundBYBIT:XRPUSDT is carving higher lows off 2.03 support through a wedge break, morphing base into bullish momentum. Holding the rising line sustains upside tilt; clearing 2.35 unlocks 2.55 and breakout buzz 🌊

Weekly trading plan for XRP BINANCE:XRPUSDT Price has reached the weekly pivot point, so now it is important to understand the further reaction. Several trend lines can be seen on the chart. If the lower trend line and the level of 2.18 are broken, the price will probably continue its downward movement to the support zone, but it will already renew the local bottom.
Write a comment with your coins & hit the like button and I will make an analysis for you
The author's opinion may differ from yours,
Consider your risks.
Wish you successful trades ! mura
