$XRP CRITICAL ALERT🚨 CRYPTOCAP:XRP CRITICAL ALERT! 🚨
XRP holders, the next 48 hours are pivotal! Key developments are underway that could shape the future of this crypto powerhouse. Here’s the breakdown:
---
⚡ The Situation:
1️⃣ Whale Activity: Huge XRP transactions detected—major price action could be brewing.
2️⃣ Market Pressure: Global regulatory news is shaking the crypto world. XRP could either surge or face a sharp decline.
3️⃣ Technical Signals: XRP is hovering at a critical support level of $3.00. A breakdown might trigger a bearish spiral, but a rebound could ignite a rally.
---
💥 What It Means for Investors:
Risk: Breaching $3.00 might send XRP down to $2.75.
Reward: A rebound could push targets to $3.50 (+15%) or $3.80 (+26%).
---
🔑 Suggested Game Plan:
🎯 Targets:
Target 1: $3.50 (+15%)
Target 2: $3.80 (+26%)
🔻 Stop-Loss: $2.90 (-4%)
🛑 Action: Keep a close eye on the market and use tight stop-losses to minimize risks during volatility.
---
🔥 Key Takeaway:
XRP is at a make-or-break point. Be vigilant, act decisively, and seize opportunities—or protect yourself from potential losses.
💬 Your Move: What’s your XRP strategy? Share your insights below!
---
💡 Pro Tip: "In moments of uncertainty, discipline and a clear strategy win the game." Stay sharp, XRP fam!
XRPUST trade ideas

Skyrexio | Ripple XRP Has Almost Finished The Bull Run!Hello, Skyrexians!
I hope you remember our legendary article about BINANCE:XRPUSDT analysis where we pointed out that it will reach $3.8 in this 11 year supercycle. Recently this asset has almost reached the target and the bull market is almost done.
Let's take a look at the weekly time frame. We can see the clear Elliott waves structure. Wave 3 now is in progress, but it's even above the extended target area between 2.61 and 3.61 Fibonacci, this can be the case for altcoins for sure. Moreover Multilayer AC Strategy confirmed the true pump on XRP this time with the signal.
Anyway we suppose that wave 4 can start anytime now. This is not going to be the fast drop, more likely to see the distribution during 2025. The target for correction, which is reachable is 0.38, approximately $2.
Best regards,
Skyrexio Team
___________________________________________________________
Please, boost this article and subscribe our page if you like analysis!

xrp ripple long longterm"🌟 Welcome to Golden Candle! 🌟
We're a team of 📈 passionate traders 📉 who love sharing our 🔍 technical analysis insights 🔎 with the TradingView community. 🌎
Our goal is to provide 💡 valuable perspectives 💡 on market trends and patterns, but 🚫 please note that our analyses are not intended as buy or sell recommendations. 🚫
Instead, they reflect our own 💭 personal attitudes and thoughts. 💭
Follow along and 📚 learn 📚 from our analyses! 📊💡"

Ripple is back for the last shot.
XRPUSDT ;
You can enter the position right now
or wait for the upper resistance to break
or enter lower
at 3.11
but I don't think it will reach that point
but the long position is confirmed


$XRP sellers missing gains. Don’t fall for the “sold my XRP I’m done” posts..
Look at the RSI we’re in an over sold area heading up into the over brought area.
So really you buy the over sold and sell the over brought areas aka sell high RSI buy lower RSI.
That’s just one way to note potential entry or exit points.
CRYPTOCAP:XRP isn’t done why? CRYPTOCAP:ETH and CRYPTOCAP:BTC aren’t done.

XRP 4400% @ 10x LevXRP (RIPPLE) Massive Long Trade Caught with 4400%+ open P&L (running trade)
This XRP long trade has been one of the biggest winner so far from 2024 and 2025.
Was a bit skeptical taking the trade at 10X leverage, I usually do 5x
Took a small trade of $500 which is currently at $22k odd open P&L
Let me tell you, XRP is still looking super bullish, the steam isnt over.
So, I am gonna stick around and see how it goes, or wait for the reversal on the Risological Options Trading Indicator that I have used to catch this MASSIVE trade!

There seems to be a problem with XRPMy TA1 Wave 3 got invalidated with recent price action, I revised my elliot wave theory with 3 options above what do you think it is?
TA 1: Invalidated Impulse Wave
Initially, Wave 1 was completed with a high of $2.9043, retraced into Wave 2, and confirmed the beginning of Wave 3 when the price exceeded the high of Wave 1. However, Wave 3 retraced into the price level of Wave 1, which violates Elliott Wave rules for an impulse structure.
While some might argue "it was just a wick," strict Elliott Wave analysis considers this invalidated. As such, the wave count needs to be revisited.
TA 2: Currently in Wave 5
We may instead be in Wave 5, which would explain the recent movements. Using Fibonacci retracement tools, I’ve outlined the typical price zone where Wave 5 might conclude - we are in the Zone. Although it is uncommon for Wave 5 to retrace into Wave 4, it’s not impossible.
This scenario aligns with the broader market, as Bitcoin is in its fifth wave, and XRP could be following suit. If correct, the price target for XRP seems short of the expected $7–$10 range people are expecting.
TA 3: Larger Wave 1 in Progress
An alternative interpretation is that we’re in the process of forming a larger Wave 1, with the high at $3.4031 marking its completion. XRP could now be entering a corrective phase.
This scenario suggests a macro Elliott Wave cycle and implies a longer-term correction before future impulsive waves. While less likely in the short term, it remains plausible if XRP’s recent movements fail to align with a complete impulsive structure.

XRP - 1D Elliott Wave AnalysisGreetings, this is my update for the daily Elliott Wave count for XRP.
We broke out of the Elliott Wave Triangle that was communicated in the last posts.
We assume that the green Wave 4 has finished with this Elliott Wave Triangle and we started the green Wave 5 which could be the last rally of this bull market.
Today we want to discuss first upsides targets for this green Wave 5.
The first targets we have are the 1 to 1 FIB ratio at 3.7898 USD, the 1.236 FIB at 4.3088 USD, the 1.382 FIB at 4.6649 USD and the 1.618 FIB at 5.3037 USD.
We did add an additional higher timeframe target at the 1 to 1 FIB which sits at 5.5736 USD.
Noteworthy is that this additional target at the 1 to 1 FIB at 5.5736 USD is relatively close to the 1.618 FIB at 5.3037 USD. We also added the ATH which sits at 3.5505 USD which could function as short term resistance.
After we get more clarity in the short term we can calculate further targets to the upside.
Additionally we wouldn't be surprised if we get extensions and hit higher targets at 5$+ but we'll see how it develops and take it step by step.
Thanks for reading.
NO FINANCIAL ADVICE.

Xrpusdt So tomorrow trump takes power and the wait should be over in the 2 months after annoucement , coins 5x olmost 6 times in expectations of what trump would do as soon as he takes office . i think we would see a correction now i think xrp retraces to to lower supports around 2.20 . I sold the other day but didnt short and i will jump back in the market when the macd crosses on the 4hr or a solid close above 3.30 i think long term this coin has room for further gains.

XRP/USDTKey Level Zone: 2.7400 - 2.8700
HMT v4.1 detected. The setup looks promising, supported by a previous upward/downward trend with increasing volume and momentum, presenting an excellent reward-to-risk opportunity.
HMT (High Momentum Trending):
HMT is based on trend, momentum, volume, and market structure across multiple timeframes. It highlights setups with strong potential for upward movement and higher rewards.
Whenever I spot a signal for my own trading, I’ll share it. Please note that conducting a comprehensive analysis on a single timeframe chart can be quite challenging and sometimes confusing. I appreciate your understanding of the effort involved.
Important Note :
Role of Key Levels:
- These zones are critical for analyzing price trends. If the key level zone holds, the price may continue trending in the expected direction. However, momentum may increase or decrease based on subsequent patterns.
- Breakouts: If the key level zone breaks, it signals a stop-out. For reversal traders, this presents an opportunity to consider switching direction, as the price often retests these zones, which may act as strong support-turned-resistance (or vice versa).
My Trading Rules
Risk Management
- Maximum risk per trade: 2.5%.
- Leverage: 5x.
Exit Strategy
Profit-Taking:
- Sell at least 70% on the 3rd wave up (LTF Wave 5).
- Typically, sell 50% during a high-volume spike.
- Adjust stop-loss to breakeven once the trade achieves a 1.5:1 reward-to-risk ratio.
- If the market shows signs of losing momentum or divergence, ill will exit at breakeven.
The market is highly dynamic and constantly changing. HMT signals and target profit (TP) levels are based on the current price and movement, but market conditions can shift instantly, so it is crucial to remain adaptable and follow the market's movement.
If you find this signal/analysis meaningful, kindly like and share it.
Thank you for your support~
Sharing this with love!
HMT v2.0:
- Major update to the Momentum indicator
- Reduced false signals from inaccurate momentum detection
- New screener with improved accuracy and fewer signals
HMT v3.0:
- Added liquidity factor to enhance trend continuation
- Improved potential for momentum-based plays
- Increased winning probability by reducing entries during peaks
HMT v3.1:
- Enhanced entry confirmation for improved reward-to-risk ratios
HMT v4.0:
- Incorporated buying and selling pressure in lower timeframes to enhance the probability of trending moves while optimizing entry timing and scaling
HMT v4.1:
- Enhanced take-profit (TP) target by incorporating market structure analysis

combined guide for both the **Regime Classifier** and **kNN Here’s the combined guide for both the **Regime Classifier** and **kNN (k-Nearest Neighbors)** indicators with emojis, tailored for your TradingView chart description:
---
### **🔑 Individual Lesson Steps**
#### **Lesson 1: What is a Regime Classifier?**
👽 **Defining Market Regimes**
- A **market regime** refers to distinct market conditions based on price behavior and volatility.
- **Types of Market Regimes:**
- 🚀 **Advance** (Uptrend)
- 📉 **Decline** (Downtrend)
- 🔄 **Accumulation** (Consolidation)
- ⬆️⬇️ **Distribution** (Topping/Bottoming Patterns)
👾 **Why it Matters:**
- Identifying market regimes helps traders tailor their strategies, manage risk, and make more accurate decisions.
---
#### **Lesson 2: Anatomy of the Regime Classifier Indicator**
👽 **Core Components**
- **Median Filtering:** Smooths out price data to capture significant trends.
- **Clustering Model:** Classifies price trends and volatility into distinct regimes.
- **Volatility Analysis:** Analyzes price volatility with rolling windows to detect high and low volatility phases.
👾 **Advanced Features:**
- **Dynamic Cycle Oscillator (DCO):** Tracks price momentum and cyclic behavior.
- **Regime Visualization:** Color-coded display of market conditions to make trends and patterns clearer.
---
#### **Lesson 3: Configuring the Regime Classifier Indicator**
👽 **Customization Settings**
- **Filter Window Size:** Adjusts sensitivity for detecting trends.
- **ATR Lookback Period:** Determines how far back the volatility is calculated.
- **Clustering Window & Refit Interval:** Fine-tunes how the indicator adapts to new market conditions.
- **Dynamic Cycle Oscillator Settings:** Tailors lookback periods and smoothing factors.
👾 **Why It’s Useful:**
- Customizing these settings helps traders optimize the indicator for different trading styles (e.g., scalping, swing trading, long-term investing).
---
#### **Lesson 4: Using the Indicator for Regime-Based Trading Strategies**
👽 **Adapt Strategies Based on Regimes**
- **Advance Regime:** Focus on long positions and trend-following strategies.
- **Decline Regime:** Prioritize short positions or hedging strategies.
- **Accumulation Regime:** Watch for breakout opportunities.
- **Distribution Regime:** Look for trend reversals or fading trends.
👾 **Using the Dynamic Cycle Oscillator for Confirmation:**
- 🌡️ **Overbought/Oversold Conditions:** Identify potential reversals.
- 🔄 **Trend Momentum:** Confirm if the trend is gaining or losing strength.
---
#### **Lesson 5: Combining Volatility and Price Trends for High-Confidence Trades**
👽 **Interpreting Volatility Clusters**
- 🔥 **High Volatility:** Indicates caution, risk management, or hedging opportunities.
- 🌿 **Low Volatility:** Suggests consolidation or trend continuation.
👾 **How Volatility Clusters Interact with Price Trends:**
- Combine trend direction with volatility analysis to refine trade entries and exits for more precise decisions.
---
#### **Lesson 6: Backtesting and Live Application**
👽 **Validate Using Historical Data**
- Guide traders on **backtesting** strategies using historical data to see how the indicator would have performed.
👾 **Real-Time Application:**
- Implement the Regime Classifier in **live markets** to monitor ongoing price conditions and gain actionable insights.
---
### **🔑 kNN (k-Nearest Neighbors) Indicator Lesson Steps**
#### **Lesson 1: What is kNN?**
👽 **Defining kNN**
- **k-Nearest Neighbors** is a machine learning algorithm that makes predictions based on the proximity of data points.
- It identifies the nearest neighbors of a data point and classifies it according to the majority class of those neighbors.
👾 **Why it Matters:**
- **kNN** helps traders forecast price movement, trends, and potential reversals by analyzing historical data.
---
#### **Lesson 2: Anatomy of the kNN Indicator**
👽 **Core Components**
- **Training Data:** Historical price data used to identify the neighbors of a point.
- **Distance Metric:** Determines the closeness of data points (e.g., Euclidean distance).
- **k Parameter:** The number of nearest neighbors to consider for predictions.
👾 **Advanced Features:**
- **Distance Calculation:** Helps assess how similar current price movement is to historical patterns.
- **Prediction:** The majority of the nearest neighbors determines the expected price movement (up or down).
---
#### **Lesson 3: Configuring the kNN Indicator**
👽 **Customization Settings**
- **k (Number of Neighbors):** Adjust to control how many historical data points influence predictions.
- **Distance Metric:** Choose from Euclidean, Manhattan, or other metrics based on data characteristics.
- **Window Size:** Defines how many data points (e.g., time periods) are used for analysis.
👾 **Why It’s Useful:**
- Tuning these settings allows traders to adjust the sensitivity and precision of predictions, optimizing for various trading styles.
---
#### **Lesson 4: Using the kNN Indicator for Predictive Trading Strategies**
👽 **Predicting Price Movements**
- Use **kNN** to identify trend directions and price reversals based on historical proximity.
- **Uptrend Prediction:** Identify moments where the nearest neighbors suggest a continuation of the trend.
- **Downtrend Prediction:** Signal when the majority of neighbors point toward price decline.
👾 **Using Predictions to Enhance Trade Entries:**
- Use **kNN** signals in conjunction with **Regime Classifier** regimes to validate and enhance entry and exit points.
---
#### **Lesson 5: Combining kNN Predictions with Regime Classifier for Precision**
👽 **Refining Trade Confidence**
- Cross-reference **kNN predictions** (uptrend/downtrend) with **Regime Classifier’s** regime identification for higher precision trades.
- **Example:** If **kNN** predicts an uptrend and the **Regime Classifier** signals an **Advance** regime, you can confidently go long.
---
#### **Lesson 6: Backtesting and Live Application**
👽 **Validate Predictions with Historical Data**
- Backtest using **kNN** on past price data to measure accuracy in predicting trends and reversals.
- **Real-Time Application:** Implement **kNN** in live markets alongside **Regime Classifier** for comprehensive decision-making.
---
### **🔄 Combined Lessons for Advanced Mastery**
#### **Combo 1: Regime Identification and kNN Predictions for Strategy Optimization**
💡 **Objective:** Combine market regime identification with kNN predictions to refine trading strategies.
- Merge **Lesson 1 (Understanding Regimes)** and **Lesson 1 (What is kNN?)**.
- **Practical Exercise:** Use both indicators to identify regimes and predict price trends in live charts.
---
#### **Combo 2: Customization, Practical Usage, and Enhanced Predictions**
💡 **Objective:** Equip traders to fine-tune both indicators for their unique strategies.
- Merge **Lesson 3 (Settings Configuration for Regime Classifier)** and **Lesson 3 (kNN Indicator Configuration)**.
- Walkthrough: Customize settings and combine both indicators to predict price trends and adjust strategies accordingly.
---
#### **Combo 3: Comprehensive Trading Strategy with Regime Classifier and kNN**
💡 **Objective:** Build a full-fledged trading system using both indicators for market regime analysis and predictive signals.
- Combine **all lessons** for a complete, systematic trading approach:
- 🔍 **Identify market regimes**
- 🔄 **Use kNN predictions** to assess potential price movements
- 📈 **Combine with Dynamic Cycle Oscillator** for entry/exit timing
- 💥 **Execute trades** with a comprehensive strategy
---
These lessons and combos provide traders with the essential tools to master both the **Regime Classifier** and **k-Nearest Neighbors** indicators, from understanding the fundamentals to implementing advanced strategies and refining predictions for more accurate market analysis.

Xrp to retest $3.4Just now opened an Xrp long.
I anticipated that before a major selloff that might signal local top that we'll retest $3.4>
Took my chances and buy while it was breaking back above the $3.14 support area after bouncing aggressively/sharply.
Tps are on chart and potential early close area. I noticed with xrp recent price action that every time it dips it gets bought back up to the nearest resistance on the 4hr tf, expect similar price action today if the current 4hr candle manages to close back above $3.14 area.

TRUMP-UMP - $4.300 / $4.500 NEXTAs illustrated, I'm trying to visualize a potential path to ATHs between $4.250 and $4.400 price range.
Once there, we could see a sell-off of short term traders liquidating their long positions near the $4.500 psychological price level + long term holders closing a small amount of their profits to secure some cash.
That being said, keep an eye for a potential psychological barrier at the $4.000 - $4.100 price range, and a KEY PIVOT AREA range of $3.050 and $3.1800.
First major support should be just below $3.000 and above $2.800
Extended buying area would be previous ATH range between $2.800 and $2.700
Invalidation Level: $2.300
--
GOOD LUCK!

XRP macro analysis ⏰ ripple ✴️As predicted case win to bottom everything got completed 🚀
BITSTAMP:XRPUSD from 2021 announced everything on track 😏
Here macro analysis on RIPPLE ✴️ BINANCE:XRPUSDT ....... Long term 📌 #DYOR
Buy :: $0.35 - $0.55 ( use only 70-80% liquid 💰 )
Sell :: $3 - $6 - $9 ( I am not expecting more than these )
#imo ( in my opinion ) -->> my personal target is $6
Let's talk about TECHNICAL ANALYSIS there n number of charts 📉 avilable with me to provide but simple way i provided here 😃 different ways of working charts will be provided below 👇
26 BARs from top 🔝 bull 🐂 run trend line formation was broken 😂 same still going 3rd time
But there was negative sign bcs still price doesn't breach $1
This is the main reason I said used only 70-80% liquid 💰
Here my backup plan on BITSTAMP:XRPUSD using remaining liquid 💰 30-20%
BUY :: $0.045 - $0.0856
Sell :: $0.4 - $0.6 ( i will close when it shows my liquid )
Very less chances are there to get active negative scenario 📌
Note 📌 i will update under post any news 🗞️ or qucik move on price & every time crucial update
Chart updates every 3-6 months
So make shure following article also update you whenever I am updating it 🤍
Giving boosting 🚀 is ur responsibility updating is my responsibility 😏
I keep wave , liquid supply and demand etc ... Charts 📉 🧵 👉

The last bullish chance of RIPPLE in Mid term!The price has formed a bullish flag on the 4-H time frame, and if it breaks out, it can drive the price up to around $2.9. I don't know why this coin reminds me of BNB!!!
Give me some energy !!
✨We spend hours finding potential opportunities and writing useful ideas, we would be happy if you support us.
Best regards CobraVanguard.💚
_ _ _ _ __ _ _ _ _ _ _ _ _ _ _ _ _ _ _ _ _ _ _ _ _ _ _ _ _ _ _ _
✅Thank you, and for more ideas, hit ❤️Like❤️ and 🌟Follow🌟!
⚠️Things can change...
The markets are always changing and even with all these signals, the market changes tend to be strong and fast!!

XRP What will happen in the future?The price has formed a bullish flag on the daily time frame, and if it breaks out, it can drive the price up to around $2.9. I don't know why this coin reminds me of BNB!!!
Give me some energy !!
✨We spend hours finding potential opportunities and writing useful ideas, we would be happy if you support us.
Best regards CobraVanguard.💚
_ _ _ _ __ _ _ _ _ _ _ _ _ _ _ _ _ _ _ _ _ _ _ _ _ _ _ _ _ _ _ _
✅Thank you, and for more ideas, hit ❤️Like❤️ and 🌟Follow🌟!
⚠️Things can change...
The markets are always changing and even with all these signals, the market changes tend to be strong and fast!!

XRP/USDT
I am bullish on CRYPTOCAP:XRP , with its breakout aligning with strong fundamentals and technical structure.
CRYPTOCAP:XRP is breaking out of the descending channel pattern, signaling the start of a bullish continuation phase 🧐. After a long period of consolidation, XRP is showing strength and momentum 🚀.
Targets:
🎯 Long-Term Target: $4.8338

XRP NEEDS your MONEy!While all memers are putting money on the trump coin, Latter they know xrp is also there! stances marked

correction phase on XRP !#XRP has is going to make a correction in 3 waves like ABC this correcion phase can make this coin go down to under 2 $
check out our analysis on xrp few weeks ago 👇👇👇

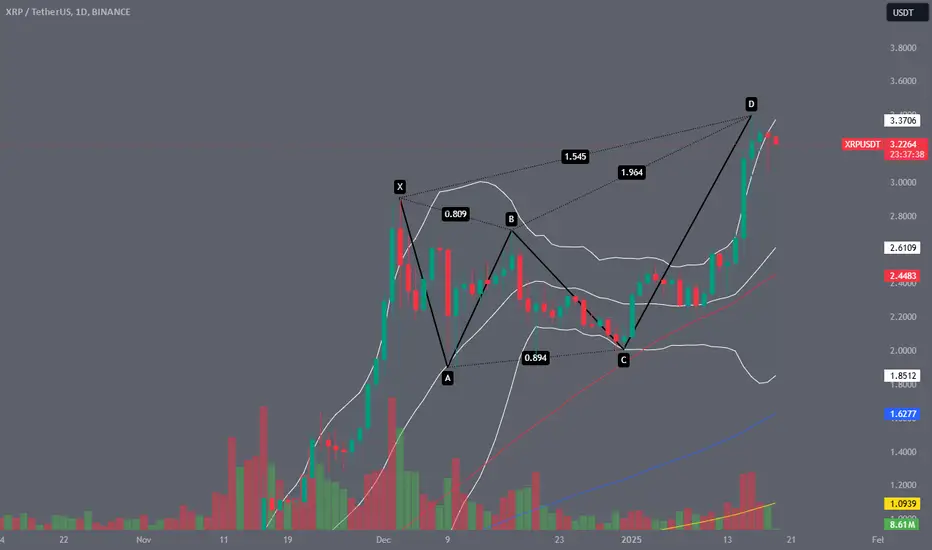
Small test with a Bearish Cypher on XRPSmall test with a Bearish Cypher on XRP.
No Trade whatsoever and no targets, testing out the harmonics
XRP . Ready For Last Round
XRPUSDT :
If the price can hold the channel and break the trend to the upside,
we will see a good move to the top of the channel.
So We will wait for it.

XRP - 1D Elliott Wave AnalysisGreetings, this is my primary Elliott Wave Count for XRP on the daily timeframe.
XRP has been recently looking strong and we expect some more upside for the moment.
It seems the XRP is forming the E Wave of an Elliott Wave Triangle which usually is followed by a breakout with strong momentum. This Elliott Wave Triangle would finish the green Wave 4 and be followed by the green Wave 5.
The support area of Wave E is marked on the chart between the 0.382 FIB at 2.3007 USD and the 0.886 FIB at 2.0259 USD. Worthwhile watching is the 0.5 FIB at 2.2364 USD and especially the golden pocket between the 0.618 FIB at 2.1720 USD and the 0.66 FIB at 2.1491 USD.
Be aware that a Wave E often doesn't strictly follow the support areas and likes to under- or overshoot. Key is that the price doesn't break below the blue C Wave of the triangle which sits at 1.9601 USD as it is the invalidation point of the triangle.
If you are interested in the back-up scenario in case we break below 1.9601 USD check out my next analysis which we will like below as a note! :)
Additionally I recommend checking out the smaller timeframe analysis to get further targets for the blue E wave which will be linked as note too.
Thanks for reading.
NO FINANCIAL ADVICE.
