Xrpusd 15m correction Gives good sell signal to 2.11-2.09 before it's journey to 2.4-2.6
This correction risk reward really good
Happy Sunday:)
XRPWCRO_E83FFA.USD trade ideas

XRP Bull Flag Hints at Potential BreakoutXRP is currently showing a weekly bull flag pattern, a technical consolidation phase that often precedes a significant upward price movement.
This formation suggests strong underlying bullish momentum, and a breakout from this pattern could propel XRP to new yearly highs.
Earlier in the year, in March 2025, the SEC dropped its appeal in the Ripple Labs lawsuit.
Later in the year, in June 2025, decisions regarding an XRP ETF to be announced

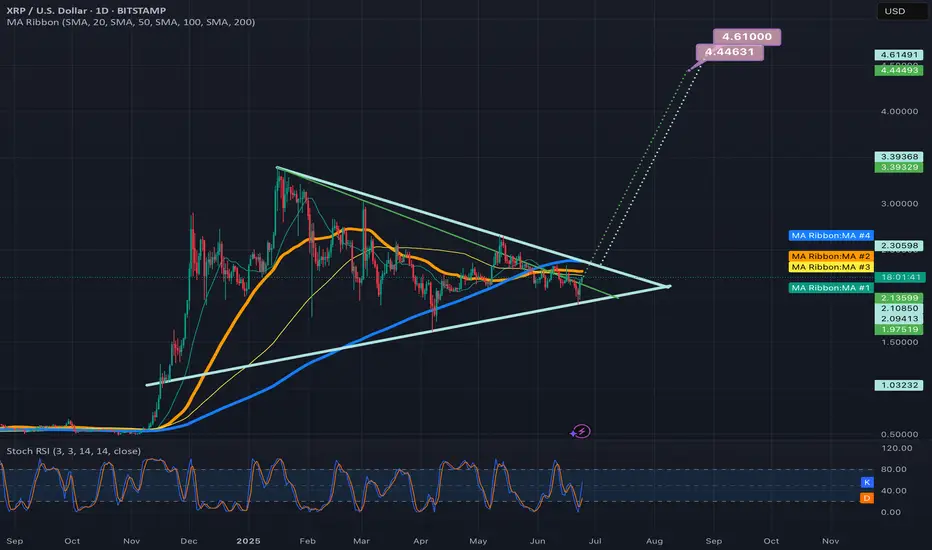
2 potential breakout targets for the symmetrical triangle on xrpDepends on if the green trendline is the more valid top trendline or the light blue one is. *not financial advice*

XRPI'm expecting a $1.80 tap before we take off.
We should begin moving up around the second week of July, after peace talks with Iran end. LOCK IN. 🔐

XRPUSD BUY 1.7310On the daily chart, XRPUSD has a short-term shock and retreat, and the bears have the upper hand. At present, you can pay attention to the support near 1.7310 below, which is a potential buying position for the bullish bat pattern.

Is this the bottom?This maybe the bottom of a long 6 month wedge up till now. This needs to go up from here... If the bottom falls out now its over.

Get Ready To Load Up For The Upcoming Institutional Altseason! Since the explosive high of $3.40 on Jan 16, 2025 📈, XRP has been sliding inside a persistent downward channel 📉. The trend remains bearish, with bulls struggling to break resistance at every turn.
Today, XRP trades near $2.04, but momentum is weak and the channel shows no signs of reversal yet. If this bearish pressure continues, a drop toward the $1.49 level is on the table—a zone that could offer a textbook buying opportunity for patient bulls! 🛒🔥
🔻 Key Chart Signals:
Downward channel intact since Jan 16, 2025 📆
Lower highs & lower lows dominate the structure 📉
$1.49 is a major support & potential reversal zone 🛑
👀 Strategy: Let the bears do their work. If XRP dips to $1.49, get ready to load up for the upcoming Institutional Altseason! 🚀

XRPUSDBearish Flag valid , Instant entry! Plan shared in chart EP SL TP
Open two trades tp1 1:1, tp2 1:1.5

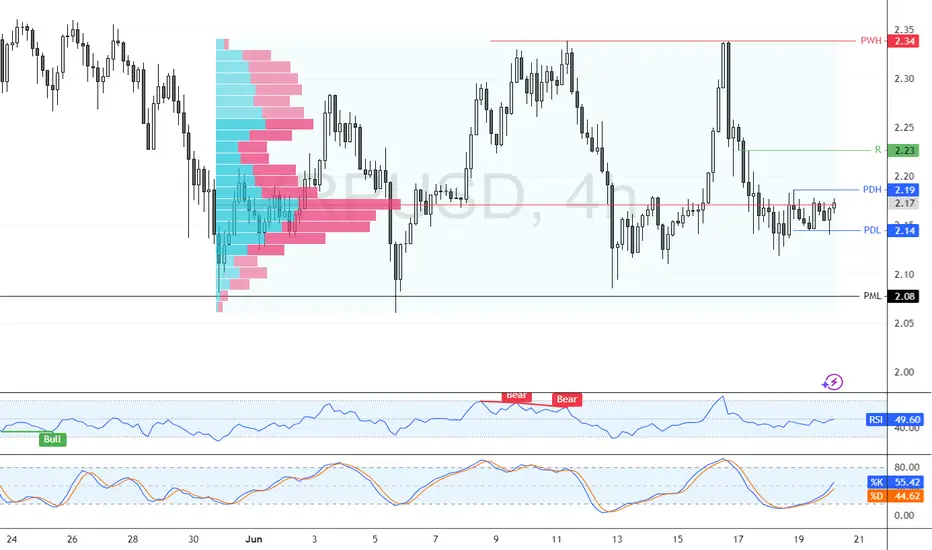
Bearish Setup Forms for XRP Below $2.21FenzoFx—XRP trades around $2.18 after forming a long-wick bearish candlestick above $2.17 support.
Stochastic reads 83.0, indicating overbought conditions. A close below $2.16 with a bearish engulfing candle could lead to $2.08. A close above $2.21 would invalidate the bearish outlook and open the door to $2.33.

XRP LongOverall the coin is sideways but bullish div in 4H and holding the support suggest upside move from here. Also there is bullish Hammer at this support level.

XRP Builds Bullish Outlook as $2.08 Support Holds StrongFenzoFx—XRP bounced from $2.14 and trades near $2.17, approaching resistance at $2.19. The market remains bullish above the $2.08 critical support. A close above $2.19 could lead to targets at $2.23 and $2.24.
The bullish outlook is invalidated if XRP/USD closes below $2.08.
XRPUSD – Squeeze After SurgeXRP exploded out of a compression base near $2.04 and surged to $2.19 before stalling. Price has since gone flat in a very tight $2.17–$2.19 band, suggesting strong distribution or a bullish flag. Expect a big move: breakout above $2.195 could re-ignite the trend; a break below $2.165 opens downside retrace toward $2.12.

Ripple Stock Chart Fibonacci Analysis 062325Trading Idea
1) Find a FIBO slingshot
2) Check FIBO 61.80% level
3) Entry Point > 1.96/61.80%
Chart time frame:B
A) 15 min(1W-3M)
B) 1 hr(3M-6M)
C) 4 hr(6M-1year)
D) 1 day(1-3years)
Stock progress:A
A) Keep rising over 61.80% resistance
B) 61.80% resistance
C) 61.80% support
D) Hit the bottom
E) Hit the top
Stocks rise as they rise from support and fall from resistance. Our goal is to find a low support point and enter. It can be referred to as buying at the pullback point. The pullback point can be found with a Fibonacci extension of 61.80%. This is a step to find entry level. 1) Find a triangle (Fibonacci Speed Fan Line) that connects the high (resistance) and low (support) points of the stock in progress, where it is continuously expressed as a Slingshot, 2) and create a Fibonacci extension level for the first rising wave from the start point of slingshot pattern.
When the current price goes over 61.80% level , that can be a good entry point, especially if the SMA 100 and 200 curves are gathered together at 61.80%, it is a very good entry point.
As a great help, tradingview provides these Fibonacci speed fan lines and extension levels with ease. So if you use the Fibonacci fan line, the extension level, and the SMA 100/200 curve well, you can find an entry point for the stock market. At least you have to enter at this low point to avoid trading failure, and if you are skilled at entering this low point, with fibonacci6180 technique, your reading skill to chart will be greatly improved.
If you want to do day trading, please set the time frame to 5 minutes or 15 minutes, and you will see many of the low point of rising stocks.
If want to prefer long term range trading, you can set the time frame to 1 hr or 1 day.

Resistance roads with price points indication Can XRP break out?…….. Do you think XRP has a liquidity pool under its whale’s belly already?……. The foolish think it might happen but the inclination of a savvy veteran say: Where’s the location to the on-demand-liquidity? But that population must level up swiftly and efficiently because they know stagnant equals tardiness! No Resistance roads with price points indication analyzation necessary.! You either see the walls gardens or you don’t …………….. #ODL <swift

XRPUSD tested the Support line 2.1215 👀 Possible scenario:
XRP tested support at $2.12 and is now consolidating below $2.20. The price briefly bounced above the 23.6% Fib level from the $2.335 swing high but remains under pressure.
Despite the dip, XRP's fundamentals remain strong. It’s widely recognized for fast, low-cost cross-border payments and gained major institutional interest—including from the UN. Regulatory clarity after Ripple’s legal win against the SEC boosted investor confidence. XRP has surged 330% in the past year, and analysts see a bullish flag pointing to a potential breakout above $3.50 this summer.
✅ Support and Resistance Levels
Support level is now located at 2.1215
Now, the resistance level is located at 2.3370.

ripple TRADE 4 absultley smashed it with this trade i have had published late again but i do belive you could get into it now and catch the retracment back down bearish again this shit like clock work up down up down up down

XRP at Critical Support After a DropXRP has declined 4.37% and is now trading at a major technical confluence zone near $0.209. This level includes the value area low, 200-day moving average, and a key daily support/resistance flip, making it a pivotal zone for short-term price action.
While the presence of strong support increases the probability of a bounce, it’s important to note that price has been consolidating at this level for some time. The more often a support is tested, the weaker it becomes — raising the risk of a potential breakdown. A loss of this zone would likely trigger a liquidity sweep, targeting lower levels unless quickly reclaimed.
For bulls, a clean defense of this level with volume and a move back above recent local highs would indicate a potential rotation toward the next resistance. For bears, a breakdown without a reclaim increases the likelihood of continuation to the downside.
This current zone is an inflection point, and traders should wait for confirmation — either a strong bounce or decisive breakdown — before taking positions.

XBRUSD is moving within the 65.95 - 76.55 range👀 Possible scenario:
Oil prices eased on June 18, with Brent trading near $75.15 per barrel, as traders awaited the U.S. Fed’s rate decision and monitored Iran-Israel tensions.
The Feed is expected to hold rates steady, but concerns over slowing global growth and Middle East instability could influence future cuts. Analysts warn that conflict-driven price spikes may fuel inflation, complicating policy moves. Markets are also watching the Strait of Hormuz, a key route for 20% of global oil. While a full Iranian export hell could be offset by OPEC+ spare capacity, a blockade would severely disrupt flows, especially to Asia. Despite risks, Commerzbank noted the market remains well supplied, with slow demand growth and rising OPEN+ output. However, ongoing trade disputes may weigh on future demand.
✅ Support and Resistance Levels
Now, the support level is located at 65.95.
Resistance levels are now located at 76.55 .

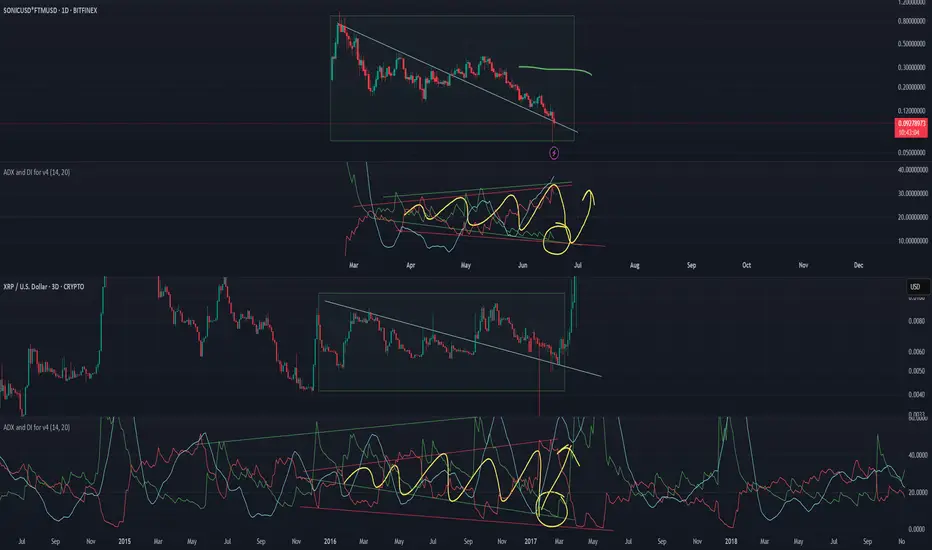
XRP folks, Sonic / Fantom is nextADX reading is identical, just on different frame. This is one of those alts that normally holds its price instead of doing classic dump.
XRP still BULLISH and on track to $8Chart speaks for itself. Huge bull flag. Consolidation! Holding $2 support. RSI looking good with plenty of room to run up!!! Price coiling up for further discovery and ATHs. LFG!!!

ripple trade 4 i actully had my set up perfectly at my surport line but i forgot to upload it but this looks like its on track anyway belive it will test the highjer resistance level lets keep watching

