XRPUSD - BEARISH DIVERGENCE DESPITE STRONG BULLISH PRESSUREXRPUSD SIGNALS BEARISH DIVERGENCE DESPITE STRONG BULLISH PRESSURE. WHAT TO EXPECT?👀
Ripple has been moving bullish since July 9, the same as the ETHUSD, reaching the 3.60600 resistance level. Strong bearish divergence on RSI is observed.
What is the bearish divergence?
Bearish divergence is a technical analysis pattern where the price makes higher highs in an uptrend, but a momentum indicator (e.g., RSI, MACD) forms lower highs, signaling weakening bullish momentum and a potential downward reversal. To trade, identify the divergence in a clear uptrend with the indicator showing lower highs (e.g., RSI above 70). Sell or short when the price confirms a reversal (e.g., breaks below a support level or trendline) with increased volume. Set a stop-loss above the recent high. Target the next support level.
Here the closest support level is local support 3.00000. is the price drops below the EMA20 on 4-h chart, there are high chances of reaching this level.
XRPWPLS_331B71.USD trade ideas

XRP Cup & Handle Pattern on the Daily Chart.XRP is now forming the handle on a very nice cup-and-handle pattern on the daily chart, starting at the previous all-time high set on January 16th, 2025.
But this pattern isn’t all sunshine and rainbows. The price of XRP could drop down into the $2.50 range—toward the bullish fair value gaps I’ve outlined at the bottom of the handle—before making any credible gains or a major breakout to higher levels.
I do believe we’ll see much higher prices in XRP in the coming years as we continue moving into the new global digital financial system. However, for this pattern to fully play out, there will likely be some pain before the pleasure.
I’d keep a close eye on the pink area marked on the charts—spanning from August 23rd through September 8th—as a potential zone for bearish price action.
Luckily for me, my XRP bags have been filled since before the Trump election pump, so I don’t personally need to buy more—unless I see a clear buying opportunity.
Good luck, everyone!
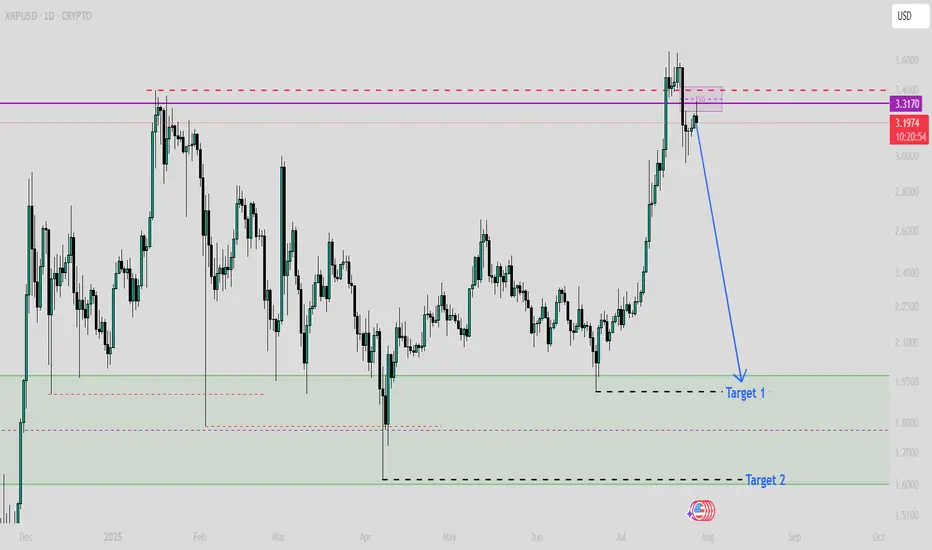
XRPUSD Technical Analysis — Bearish Retracement in PlayXRPUSD Technical Analysis — Bearish Retracement in Play
Overview:
XRPUSD is currently exhibiting signs of bearish momentum after failing to break through a key resistance zone. Price action suggests a potential retracement towards the marked target level of 3.39519, supported by multiple technical indicators and price structure.
Key Technical Levels:
Immediate Resistance: 3.70 – 3.75 (strong supply zone; price rejected here multiple times).
Support Zone: 3.30 – 3.39 (prior demand zone and EMA confluence).
Target: 3.39519 (short-term bearish target as marked on chart).
Current Price: 3.50 (as of chart time).
Indicators & Price Action:
EMA Analysis:
EMA 20/50 (red/orange) are flattening out, indicating weakening short-term momentum.
EMA 100 (cyan) acts as current dynamic support.
EMA 200 (blue) is far below, suggesting room for deeper retracement if sentiment weakens.
Price Structure:
XRPUSD formed a double top near resistance, followed by lower highs.
Recent candle patterns show indecision and possible distribution.
Projected bearish leg toward 3.39519 suggests sellers are in short-term control.
Conclusion:
XRPUSD is likely to retest the 3.395 support level after rejecting the upper resistance zone. The bearish structure is supported by EMA alignment, price action, and repeated failure to break resistance. A break below 3.395 could open further downside towards 3.31. However, a strong bounce from support could invalidate this setup.
Trade Bias: Short-term bearish toward 3.395, watching for reaction at support.

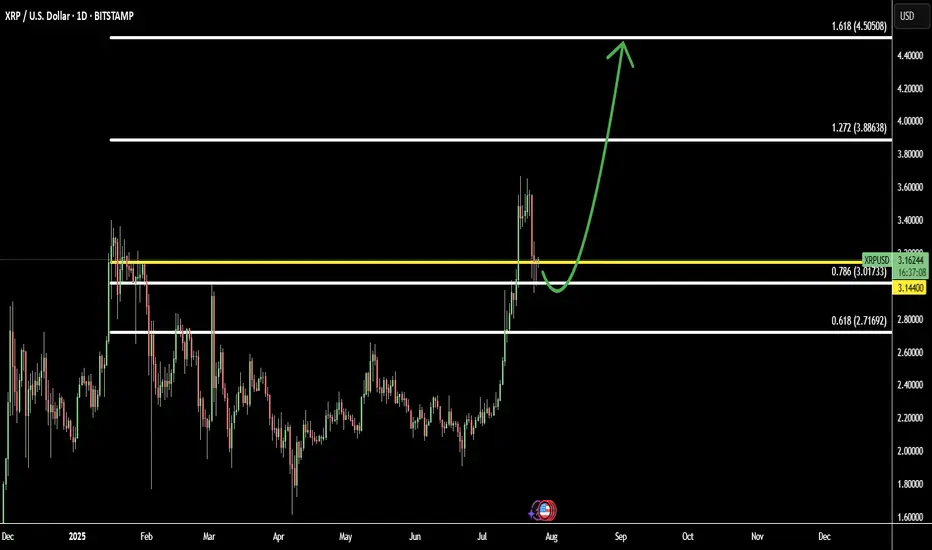
XRP Pullback Complete: Bulls Step In Toward Fibonacci TargetsAfter a healthy pullback, XRP (XRPUSD) is showing signs of renewed strength as new buyers re-enter the market. This correction phase appears to have attracted smart money, setting the stage for the next bullish leg.
The chart structure suggests XRP is now in a re-accumulation phase, with price aiming for mid-term Fibonacci targets:
Target 1: 1.272 Fib – 3.88 - continuation zone after breakout
Target 2: 1.618 Fib – 4.50 - strong extension level aligned with prior highs
If momentum holds and volume builds, XRP may resume its upward trajectory toward these targets in the coming weeks.
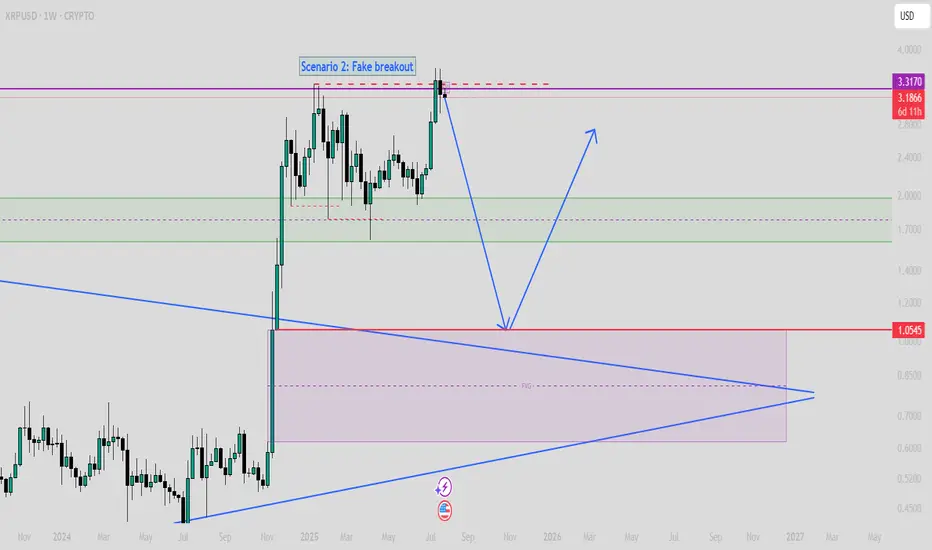
$XRP SCENARIO 2: Fake Breakout (Read caption)If XRP can't close strongly upper than $3.5 on the weekly time frame, then we must consider this scenario!
In this scenario, the first target will be $1.6, and then, based on time, even value around $1 is achievable.
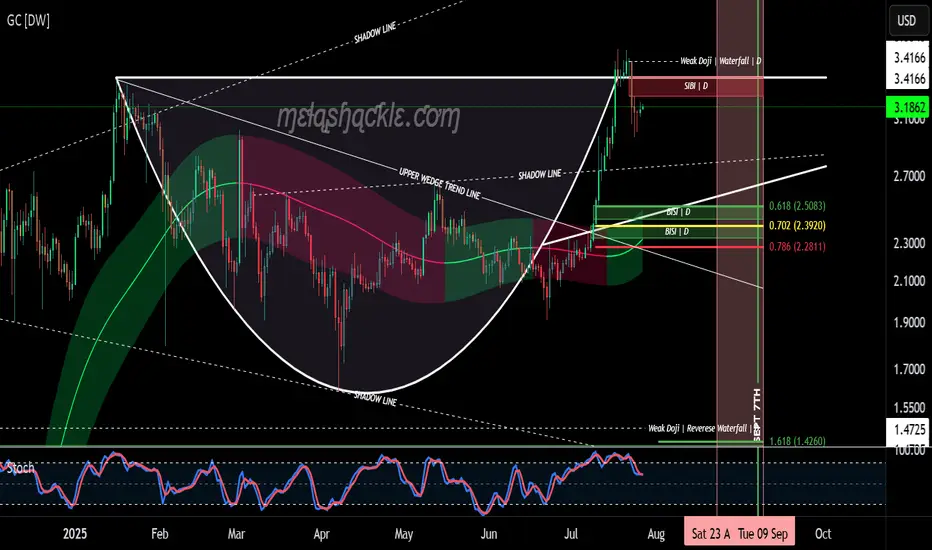
XRP CRYPTOCAP:XRP price discovery will be there sooner or later
2021 I think the current accumulation process on the ath price will be the trigger for an upward movement

$XRPBullish Bias: The chart suggests a bullish outlook with a breakout from a multi-year wedge and Fibonacci targets as high as ~$16.8.
Current Pullback: The price is pulling back after breakout (possibly retesting previous resistance as support).
Risk Area: Orange box shows a potential invalidation or pullback zone before another rally.
Descending Broadening Wedge (Pattern)
A large wedge spans from 2017–2025, marked by two converging black trendlines.
XRP has broken above the wedge (bullish breakout).
Fibonacci Levels (Orange horizontal lines on the right)
0.618: ~$5.91
0.786: ~$17.87
0.88: ~$32.06
These levels are likely drawn from the ATH (All-Time High) to a major low.

$XRP on Daily TF is not bullish!! (Read Caption)Need a Strong Weekly breakout candle to invalidate this scenario!
XRP: $10 Breakout? Watch These Algorithmic Windows!This XRP analysis highlights "algorithmic departure windows" (blue circles) where explosive price moves can occur.
Whenever price enters a blue circle, XRP can launch to $10 or higher instantly or within 33 days—no matter the news.
**Key Dates to Watch:
**Possible Departure: July 10, 2025 (fundamentals align)
**Other Windows: May 19 - August 11, 2025; October 22 – November 18, 2025
**Major Target Zone: $8.50–$11.50 (December 25, 2025 – January 26, 2026)
History shows that once price breaks out from these departure windows, XRP can reach its upper targets rapidly—sometimes in a single day, but almost always within 33 days or less.
News is the excuse for the moves—algorithms deliver the predetermined price.

XRP bearish divergence XRP 4hr showing bearish divergence on RSI as price breaks down from trendline support.

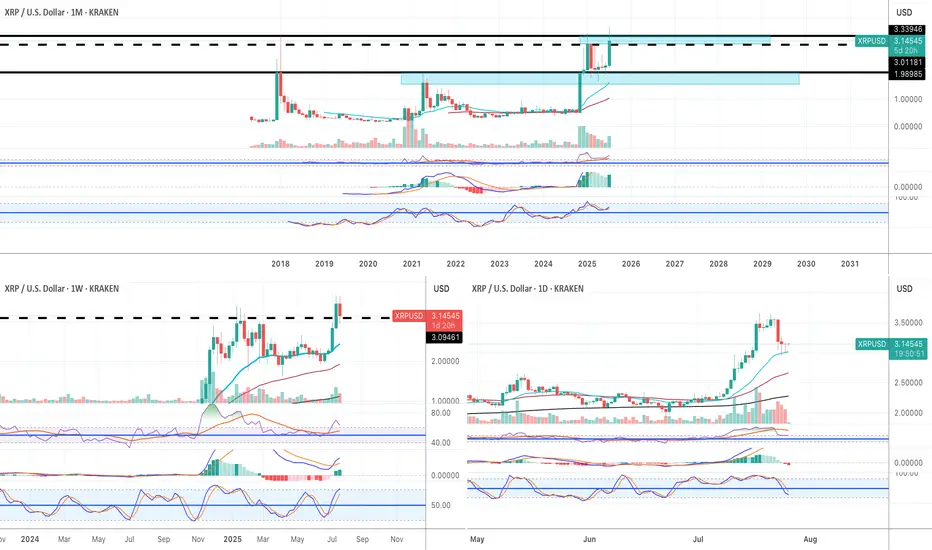
Super bullish!! (I am not a XRP fan, but still) XRP is one of those cryptocurrencies that attract cult-like followers. I am not one of them.
Fundamentally I have no idea about the long term potential of XRP. HOWEVER, purely based on technicaly analysis, it looks very bullish to me.
Monthly:
1) the price finally broke above the 2018 historical ATH.
2) All momentum indicators in the bull zone.
3) Both RSI and MACD are in the overbought territory but they can remain in the OB territory for weeks and weeks when the macro bull trend begins.
4) Stochastic lines have crossed to the upside in the bull zone.
Weekly:
1) all momentum indicators are in the bull zone.
2) The price broke above the historical ATH. It is going through pull back now, but, there is a strong buying pressure around $3.15.
Daily:
1) all momentum indicators have reached the overbought territory. The lines are now rolled to the downside, however, it is likely to be a corrective move.
2) the price is hovering above EMA21 where the recent price breakout happened on Thurs 17th July. I have been monitoring price action in lower time frames such as 5 and 15 minutes, and it looks like the price does not want to go below the previous historical high at this stage.
I am not very familiar with XRP, but purely based on the current price action, it looks very bullish. For the very first time as a trader/investor, I deployed my capital to buy XRP last Wed (just under $3.00).
I have already took some profit when it hit $3.60. But I am planning to sell 90% of my XRP when it reaches $4.50 and $5.00, and let the rest run just in case it goes to the moon😅.
6month log chart on xrpusd suggests crazy potential targetsThe bull pennant we are in shown here on the 6month time frame seems to have a symmetrical triangle for its flag. The breakout target for just the symmetrical triangle is in the $33 range. Factor in the pole of the flag and the potential target skyrockets to 1.2k. Definitely not financial advice and certainly no guarantee it will hit either target as it’s still up in the air if log chart targets reach their full target as reliably as linear chart patterns do. Even if it does hit these targets you can see the apex of the pennant in its current trendline trajectories doesn’t occur until 2026. The only way I see price remaining inside this triangle for that long is indeed if the SEC ripple case is extended through appeal and taken to the Supreme Court. Hopefully not but it isnt impossible. If this were to occur I would simply keep dollar cost average accumulating until it was to break out from the triangle which would give me more opportunity to take some profit at the first target but then also hold onto some of the asset in case it does indeed reach the full bullflag breakout somehow all the way up at 1.2k. Simply posting this hear so I can see how well price action chooses to follow this pattern over the next year or few. Once again *not financial advice*

XRP 1H Cup and HandleCOINBASE:XRPUSD COINBASE:XRPUSD
On the 1H time frame XRP has broken all time highs to $3.66, then dropped $0.30, forming a perfect cup and handle. XRP is now gaining momentum to break the neckline, heading into to an explosive equal move up to $4.

XRP - Ready for Next LegXRP recently made a new all time high at $3.66. But what we are seeing could give credit to even higher highs about to be developed.
What we have seen over the last few days of price action is market structure respecting our old 2025 ATH.
Any dips we have seen have developed lows between $3.30-$3.40. Creating this in to what seems to be a new level of support.
In this post we outlined how that yellow dotted line (key level) would play a role in future price action. So far that is what has happen and we are seeing beautiful market structure develop.
If XRP is to break the $3.66 level we are likely to see a rapid increase in price. Some of the levels that could end up becoming key levels for the future are these:
$3.90
$4.20
$4.50
$5.30

XRPUSD broke the trendline resistance likely will go upXRPUSD was trading in down ward and recently formed the double bottom and broke the resistance and will likely to go up.

xrp correction time rsi indicates oversold RSI is oversold on the 1 day daily correction happening next stop $285 ish good luck
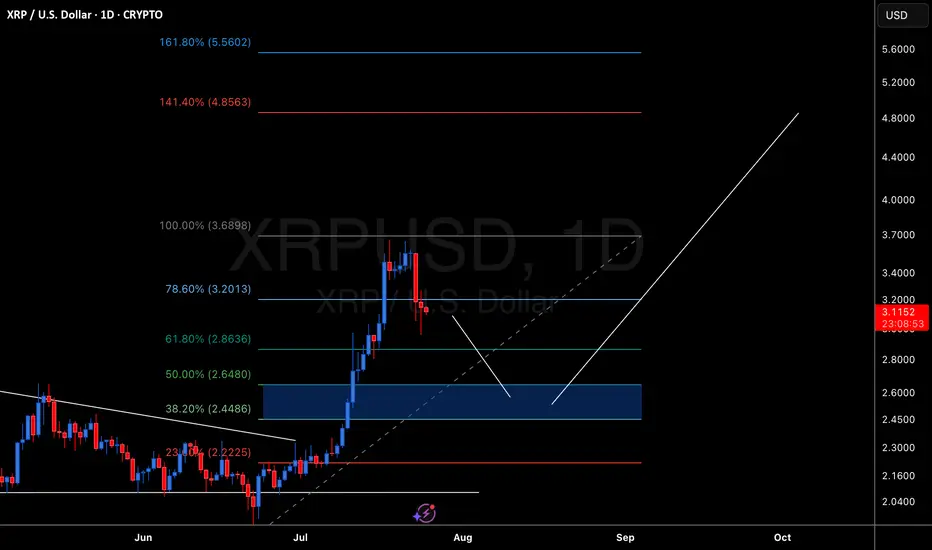
XRP Temporary Pull Back Followed Bu Move Up To $4.00XRP Created a new high. Looking for a pull back to the 50% retracement level. Followed by a move up to the 141 fib level of around $4.00
XRP: Double zigzag correction scenario for Jun/July 2025 impulseA possible double zigzag pullback scenario correcting June & July's impulsive breakout, upon which normies & bears might say "head & shoulders" but then it climbs the wall of worry for a massive Wave 3 parabola.

xrpusd monthlyjust woaw,
who will not like when the chart speaks itself and here it speaks itself
target is very logical, reasonable
we ll see in the future we would be there or not

XRP to $10? 🚨 XRP to $10? Here's What No One Is Telling You 💣
XRP is quietly being tested as a global liquidity bridge by BRICS & Gulf nations. If Ripple powers the rails of future CBDCs…
$6.50 to $10 XRP becomes a math problem — not a fantasy.
✅ Ripple IPO incoming
✅ U.S. relisting possible
✅ Token supply shrinking
✅ Wall Street quietly watching
This isn’t hype. It’s the sleeper setup of the decade.
Would you hold XRP if it replaced SWIFT?

Ripple analysis, long-termAccording to the latest analysis, Ripple's price rose from $0.50 to $2. Further, the price is analyzed to be likely to decrease to the $1 range with a dark $4 and $3.50, which in the long term can be expected to increase Ripple to this price range.
Sasha charkhchian

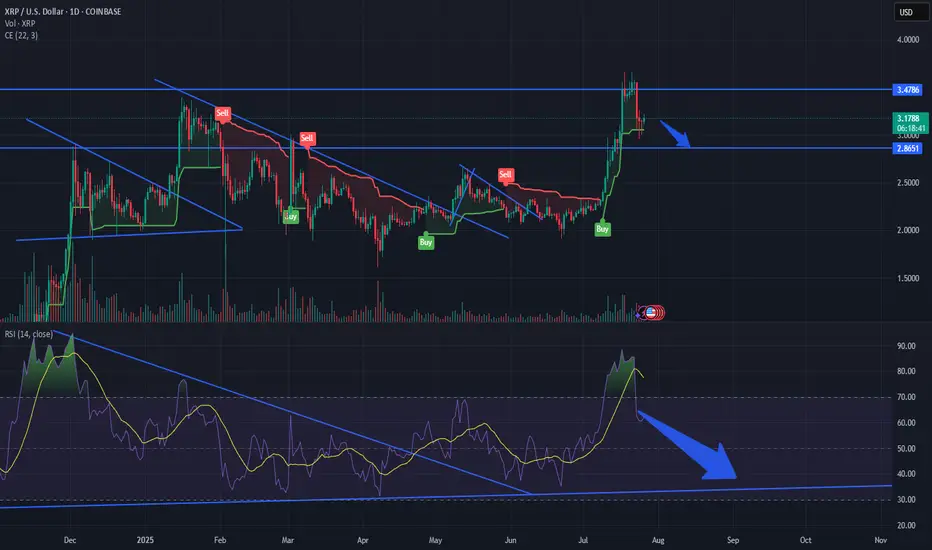
XRP Confronts Daily SMA ResistanceFenzoFx—XRP remains bearish, trading below the 50-period daily SMA at around $3.18. The SMA acts as resistance. Immediate support lies at $2.96. A break below this level may trigger further downside toward the $2.66 demand zone.
On the upside, a close and stabilization above $3.27 would invalidate the bearish outlook. In that case, momentum could push prices toward the previous highs at $3.65.

XRPUSD Long, short, longWhole market is manipulated every minute... My prediction can be wrong but I see things this way right now ... Would be grateful for you to share your point of view ...
