XRP Approaches Judgment Day – Resistance Retest or Breakout?XRP is flying into a major historical resistance zone just under $3. Last time we were here, price was swiftly rejected — but this time, it’s backed by strong momentum, a bullish structure, and a cluster of Fib levels below. With Stoch RSI cooling off from overbought and buy signals dominating the recent trend, this is a make-or-break level to watch. A confirmed flip of this zone could open the door to new highs. 📊
🧠 Built using the Hull Suite Strategy+ Fibonacci + Stoch RSI
XRPWPLS_331B71.USD trade ideas

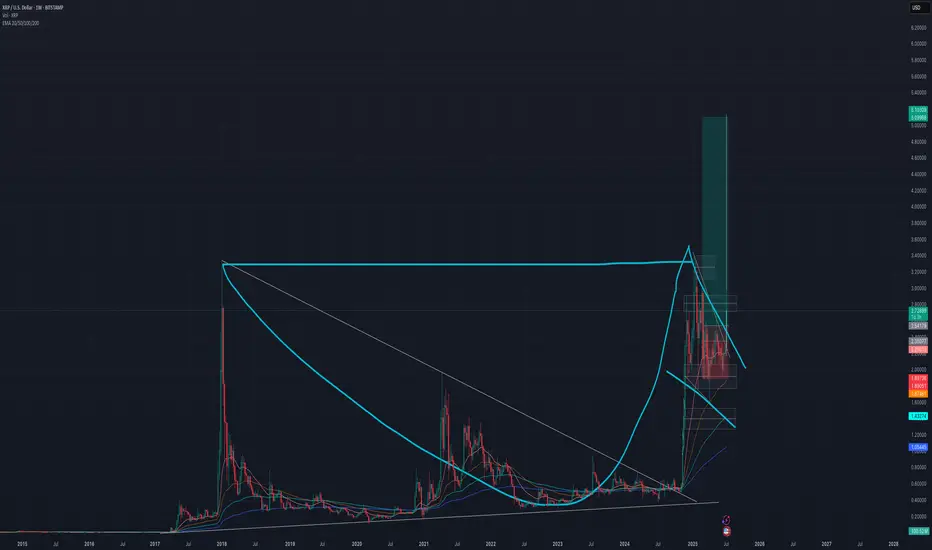
huge cup and handle pattern target: 5$
The cup and handle pattern is a bullish continuation chart pattern that signals a potential upward price movement. It resembles a teacup with a handle, where the "cup" is a rounded bottom and the "handle" is a smaller downward drift. A breakout above the handle's resistance level suggests a continuation of the prior uptrend.
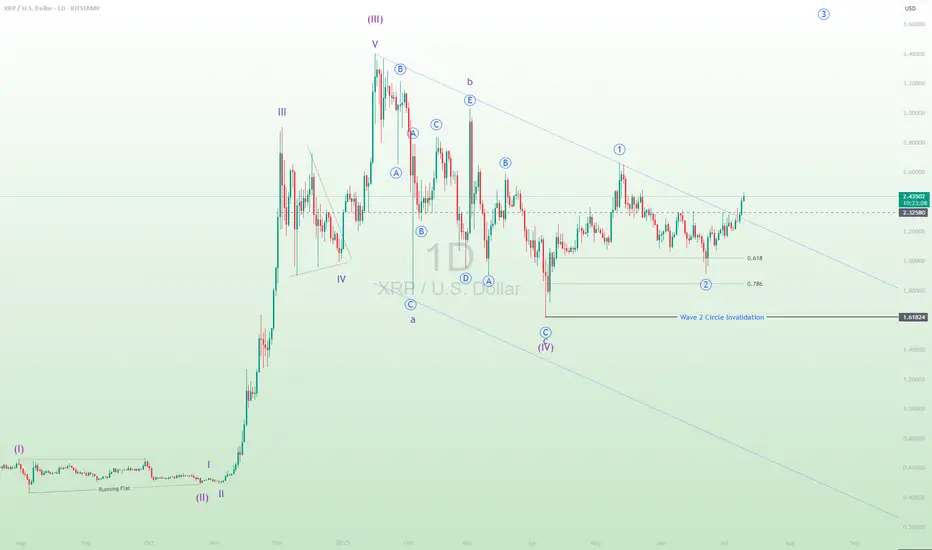
Xrp wave countXrp wave count to see where this bull run is going to take us.
Please be realistic and don’t miss out on massive profits by being greeedy!!! Xrp will not be $100 this year.
Probably have to wait a while, like years. So take your profits at $7-10, and then buy back in after the corrective phases.
Be smart.

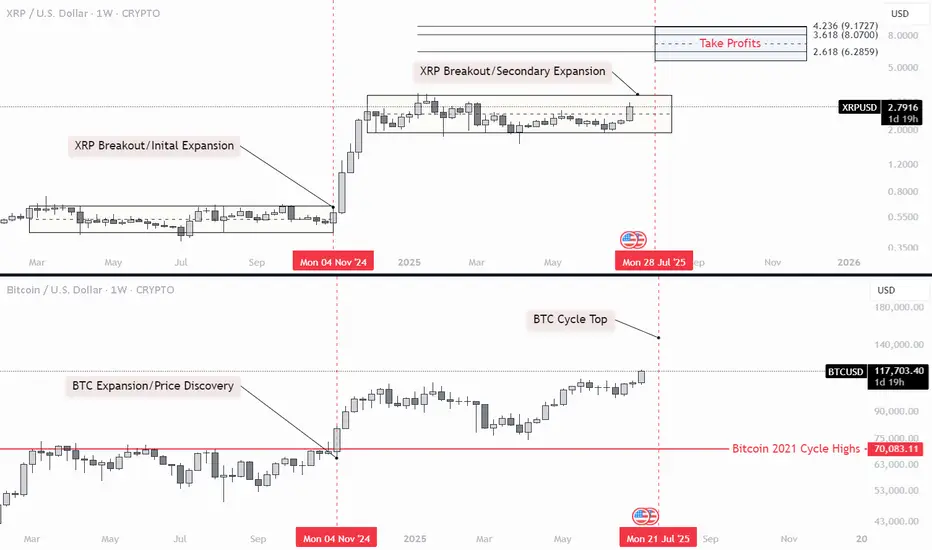
2025 - XRP Two MovesXRP typically moves twice during the cycle: once when BTC breaks its previous cycle highs, and again when BTC tops out at the end of the cycle. These moves often occur in waves of equal length within a 365-day window.
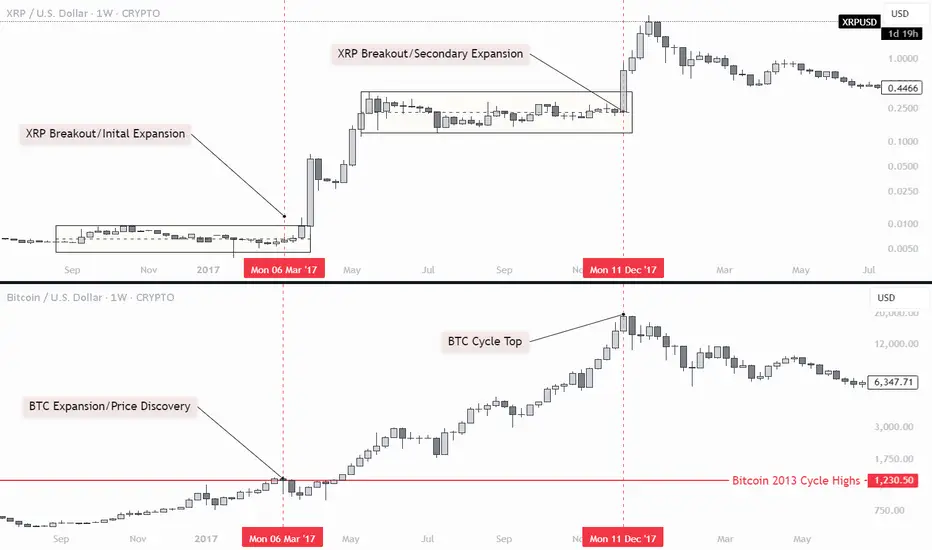
2017 - XRP Two Moves XRP typically moves twice during the cycle: once when BTC breaks its previous cycle highs, and again when BTC tops out at the end of the cycle. These moves often occur in waves of equal length within a 365-day window.
XRP Bull Flag Hints at Potential BreakoutXRP is currently showing a weekly bull flag pattern, a technical consolidation phase that often precedes a significant upward price movement.
This formation suggests strong underlying bullish momentum, and a breakout from this pattern could propel XRP to new yearly highs.
Earlier in the year, in March 2025, the SEC dropped its appeal in the Ripple Labs lawsuit.
Later in the year, in June 2025, decisions regarding an XRP ETF to be announced

XRP Weekly ChartMoving up within this range since recent highs.
See if it breaks above $2.50 again or if it rejects and continues lower.
Breaking above last weeks candle already.

SHORT TERM PREMIUMGeopolitical risks weigh heavily on risk assets at the moment. Anticipating a continued move lower to discount before ALT season pick up at the end of the year

XRP SKYROCKETS AND BREAKSOUT PRICE RANGE! ⭐️In a pretty crazy twist and turn of events we're seeing XRP absolutely skyrocket and breakout with this morning's announcement on behalf of President Donald Trump with his Truth Social media platform announcing it had filed for a Crypto Blue Chip ETF with the SEC.
⭐️ The Blue Chip ETF proposal includes 70% holdings in Bitcoin, 15% in Ethereum, 8% in Solana alongside 5% in XRP and 2% in CRO which is from Crypto.com. This notably has led to the breakout with XRP that we're currently seeing with the crypto already up 12% since the day started and news broke out. It's still early morning too so we'll see how the market reacts as the day continues and traders wake up to the news.
⭐️The past few weeks have seen XRP stuck within this horizontal channel and constant tug a war between $1.90-$2.30 with this breakout and the last week signaling bullish optimism towards the crypto alongside news of the BNY-Mellon deal with BNY Mellon set to become the Custodian for Ripple's RLUSD Stable coin. And for those that don't know BNY-Mellon is America's oldest bank having been founded in 1784 and with an estimated $45.7 trillion in assets under custody and/or administration. To say in the least this is a big step for Ripple showing more institutional growth.
⭐️To note also is this as I'll show below on Bitcoin's chart:
⭐️ It's crazy to say but we've just seen Bitcoin form a new All-Time High at $118,100 alongside the Crypto Blue Chip announcement, more than likely with investors and institutions flocking to buy in before the ETF get's approved and likely in anticipation of a bullish shift.
⭐️ We've already seen the crypto space weather the storm through the last few weeks and months with everything that's happened from global escalations to all the new bills and changes in the government. Through thick and thin the crypto space has proved resilient and investors are taking note.
⭐️ Have to run for work but wanted to get a quick idea out there, especially since this news just broke out. Some pretty crazy stuff and I'll be watching these levels here to see if things continue or if the news has simply given us a breakout, regardless it's a win-win with all this news only pushing the directive and story towards crypto and digital assets for many. I'll attach a link below to an article on the Blue-Chip ETF for reference as well.
⭐️ Thanks so much as always and all the best till then, feel free to keep posted for more updates and ideas as we continue on this journey we've been riding the last few years already. It's been a lot but it's got much more to go. Let's keep at it and keep our heads up.
⭐️ Reference on Crypto Blue Chip ETF:
apnews.com
Best regards,
~ Rock'

XRP/USDT Monthly Chart: History Repeating Itself?Hey traders! Let’s dive into this monthly XRP/USDT chart. I’ll be honest — I’m skeptical about this outcome, but let’s break it down because it could actually happen!
The chart screams déjà vu, with XRP’s price action mirroring the 2014-2018 period. Back then, XRP broke out from its 2014 ATH in 2017, leading to a massive rally. Fast forward to now, and we’re seeing a similar setup, but with a twist. XRP is struggling to break through the 2018 ATH resistance zone around $3.31, which reminds me of the Breakout Consolidation phase we saw in 2017. Historically, this consolidation led to a breakout, and the chart hints at a potential repeat!
If XRP breaks out soon, we could see a parabolic move, potentially targeting much higher levels. However, the current resistance is a tough hurdle, and if it fails, we might see a pullback to lower supports.
Key Levels to Watch:
Resistance: $3.31 (2018 ATH)
Support: $1.643 (previous consolidation low)
Breakout Target: To be determined (potentially parabolic)
Breakdown Risk: $0.650
I’m not fully convinced, but the setup is intriguing — could this be XRP’s moment to shine? What do you think? Let’s discuss below!

XRP $1.95DISCLAIMER:
This analysis is for educational and informational purposes only and does not constitute financial advice. I am not a licensed financial advisor or professional trader. Always do your own research and consult with a qualified financial professional before making any trading decisions.
XRP is showing clear signs of weakness as price approaches the long-term descending trendline. Back on May 14th, we saw a strong bearish reaction — a thick-bodied candle rejecting directly off the trendline. Since then, price has struggled to revisit the trendline, failing to even tap it again.
Most recently, XRP has been leaving repeated upside wicks, suggesting aggressive sell orders are filling around the 1.27 extension, which I believe is being defended by a hidden bearish order block. Price action confirms that buyers are being absorbed before a full retest of the trendline.
This reinforces the short bias with a setup targeting a break below $1.95.
• Entry: Below $2.22
• Stop Loss: $2.2675
• Take Profit: $1.95

$1.21.... 0.702fib retestdont hate, but xrp didnt break out of the flag pole yet and potentially building a C leg down to $1.21 to retest the 0.702fib.
$1.21 being a wick grab if youre an xrp crackhead buying at 3am.
BUT, if xrp does breakout of the flag pole, buy the C leg on the backtest of the top of the pole.

XRPUSD moves toward Wave 3 uptrendXRPUSD, in my opinion, has completed the wave 2 uptrend and is now moving toward wave 3 in 5 minor waves. Traders are advised to do their own technical analysis prior to placing a trade.
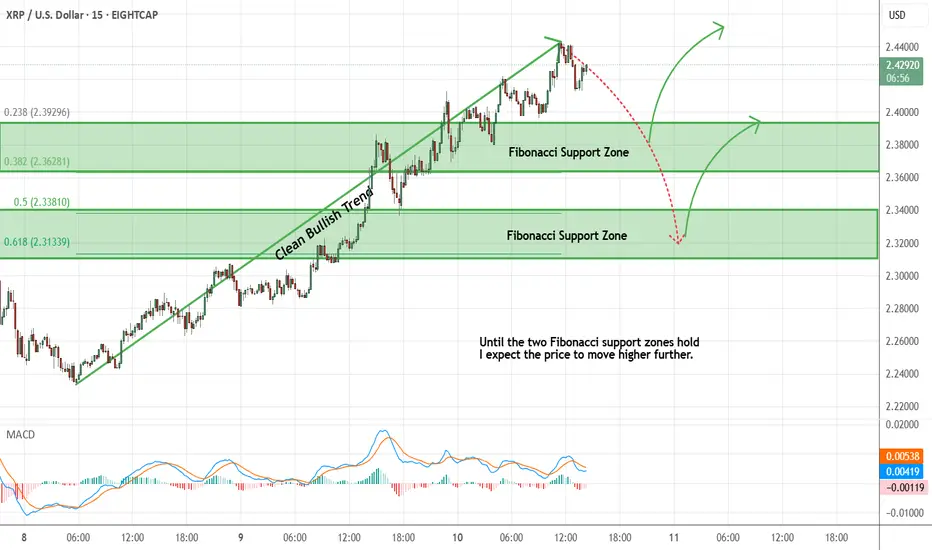
Ripple - Expecting Bullish Continuation In The Short TermH4 - We have a clean bullish trend with the price creating a series of higher highs, higher lows structure.
This strong bullish momentum is followed by a pullback.
No opposite signs.
Until the two Fibonacci support zones hold I expect the price to move higher further.
If you enjoy this idea, don’t forget to LIKE 👍, FOLLOW ✅, SHARE 🙌, and COMMENT ✍! Drop your thoughts and charts below to keep the discussion going. Your support helps keep this content free and reach more people! 🚀
--------------------------------------------------------------------------------------------------------------------
XRP Breakout with Target at $4.80XRP just broke out of a typical complex wave 4 Elliott wave formation by completing the last 2D-candle. Consider taking profits in steps as wave 5 is often surprisingly short and disappointing. A $5–6 target is possible if bullish momentum persists, but monitor for early reversal signs.

$XRP Bias Change: Bullish Elliot Wave CountCRYPTOCAP:XRP is breaking out the descending resistance causing me to take another look at my WXYXZ corrective Eliot Wave count expecting lower. I have adjusted the count to WXY and a 1-2 new motif wave with a target of $3.8
Price is well above the daily 200EMA and daily pivot after testing both as support including the High Volume Node. Closing above the descending resistance today will be a bullish signal but a retest of that resistance as support before continuing onwards its what to look out for.
Analysis is invalidated below $1.8
Safe Trading

XRP - First ConfirmationPlease refer to our previous post:
After pointing out the gravestone doji in the last post that was likely to send price downwards, we also listed the way this major bearish signal could be reversed. We stated "The only way this can be negated in the short term is if we print a green daily candle tomorrow negating the confirmation of the gravestone doji."
That is exactly what we saw. We printed a green daily candle the next day that negated the bearishness of that gravestone doji. Now we are seeing the early signs of a massive XRP breakout.
Now we want to watch for the second confirmation to confirm the breakout. This could come in two forms. Either price drops back down to the orange trendline and confirm that level of old resistance as new support or price continues its rally to the upside and breaks our previous LTF high around $2.65.

XRP ($15-$22) (Might Overextend to $27-$33)XRP ($15-$22) (Might Overextend to $27-$33). I am not sure about the next bear market bottom, my numbers have been coming to $4.50-$6.50

ABC Correction to 0.702FIB?The B Leg might be in, UNLESS it breaks the ATH, this chart is invalid.
IMO, the real C leg WILL hit $0.94 -$0.74 hitting the 0.702FIB to hit the back test and $13/$17 narrative.

Bullish time on December this year 2025be ready for a price drop and bearish volume, the chart showing how it keep reject that down trend (green line) I don't think we will break through this time, just be ready for the market tricks.

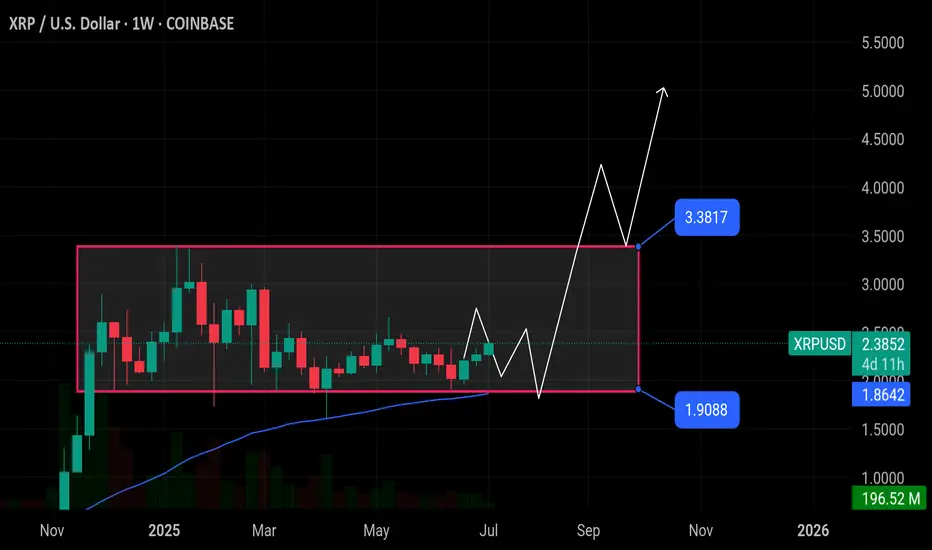
$XRP Breakout Watch! Stuck in a range between $1.90–$3.38 — breCRYPTOCAP:XRP Breakout Watch!
Stuck in a range between $1.90–$3.38 — breakout above resistance could launch it toward $5+. Fundamentals are turning bullish. Accumulate smart near support#Bitcoin #altcoin #btc #memecoin CRYPTOCAP:BTC NYSE:FET GETTEX:WOO CRYPTOCAP:INJ GETTEX:QNT $tsuka $azero NEWCONNECT:MLT EURONEXT:RNDR LSE:ROSE BIST:LINK CRYPTOCAP:XRP CRYPTOCAP:PEPE #iran #qatar #usa #IsraelIranConflict #aespa CRYPTOCAP:BTC
Wait for XRPXRP has been consolidating above the $2 level for nearly seven months.
The current resistance is defined by a descending trendline that originates from mid-January 2025.
A breakout above this trendline would signal renewed bullish momentum—and could present a strong entry opportunity.
Disclaimer:
This analysis is based on my personnal views and is not a financial advice. Risk is under your control.

XRP: Ripple Ready to Unleash a Tsunami?Ripple (XRP) is coiling like a spring—ready to explode. After five clean re-tests of a powerful demand zone, buyers have repeatedly stepped in to defend key levels, launching 40–75% swings each time. Is this the moment it unleashes the wave?
🔍 Technical Breakdown:
✅ Demand Zone Strength
XRP is bouncing from a long-tested demand zone (5+ re-tests). Each bounce led to substantial upside momentum.
✅ Bull Flag Retest
XRP previously broke out of a large bull flag and has been holding the flag’s top trendline for over 40 days—acting as strong support.
✅ Higher Low Structure
Price formed a higher low (H/L) and has climbed steadily for two weeks—building bullish structure.
✅ Volume Profile
Price reclaimed ground above the high-volume node, signaling accumulation strength.
✅ Market Cipher B Divergence
A weekly hidden bullish divergence is present—not massive, but notable—hinting at momentum shift.
⚠️ What to Watch:
Volume is key: Current consolidation shows a decline in volume—a surge could ignite the breakout.
Confirmation for conservative traders: Wait for a break and hold above $2.33 with volume, or a retest of that level.
If past demand zone reactions repeat, a breakout could be imminent.
What do you think?
📈 As always—this is not financial advice. Do your own research.
🧭 Happy Hunting!
