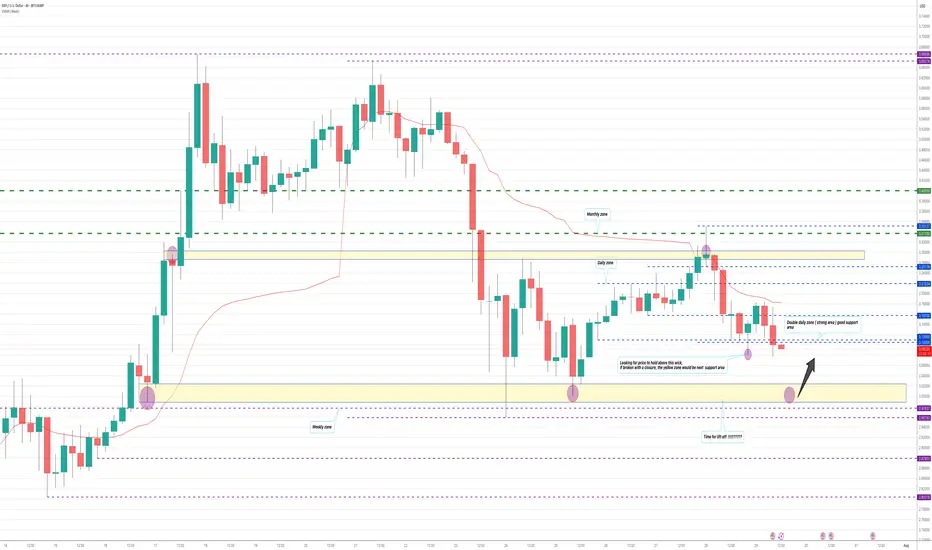
XRPUSD Chart Outlook It's nice to finally say we made it back to the All Time High. Here is what I can see with the current movement we have. It's holding nicely above the double daily but there could be a chance to bottom at the 3.00 to 3.02 range. then push out strong. We have a monthly closure this week & normally we can get some movement at the end of months. just depends. I trade wicks so my zones are on the wicks of previous candle closure, if that helps understand my chart. Happy Tuesday
XRPWPLS_B8CB1B.USD trade ideas
XRP: Support at $2.960 Holds the Bullish SetupFenzoFx—XRP dipped from $3.666 but stabilized near the monthly anchored VWAP at $2.960. It now trades at $3.142 above the ascending trendline.
Immediate resistance lies at $3.332, aligned with the descending trendline. A close above this level may propel XRP to $3.432. Strong buying could extend gains to the recent high of $3.666.
The bullish outlook stands while XRP/USD holds above key support at $2.960. A drop below this level would invalidate the bullish scenario.

Xrp's next low (T2)5 days ago on my first post (July 23rd), xrp was $3.22.
I suggested that Xrp would continue to drop into T1 around $3. That target was hit at $2.96.
My chart also showed that Xrp could continue to drop to T2 and go as low as $2.75.
Based on price action, I believe my T2 ($2.75 - $2.80) may also be hit. This will be my ideal entry.

Bullish Signals Mount for XRP as Price Holds Weekend GainsXRP at a Crossroads: Technical Strength Meets Fundamental Catalysts in a High-Stakes Market
July 28, 2025 – In the volatile and ever-evolving world of digital assets, few tokens command as much attention, debate, and fervent community support as XRP. The digital asset, intrinsically linked with the fintech company Ripple, is currently navigating a period of intense market focus. After a period of consolidation, XRP is demonstrating renewed strength, holding onto recent gains and pressing against critical technical resistance levels. This price action is not occurring in a vacuum; it is the culmination of powerful undercurrents, including bullish chart patterns, significant accumulation by large holders, and a shifting landscape of regulatory clarity and institutional interest that could define its trajectory for years to come.
As of Monday morning, XRP has shown stability, trading around the $3.16 to $3.24 range. This follows a period where the token has been building momentum, with analysts closely watching key resistance zones between $3.30 and $3.40. A decisive break above these levels could signal the start of a new upward trend, while the ability to hold support, particularly around $3.15 to $3.20, is seen as crucial for maintaining the current bullish structure. This delicate balance has traders and long-term investors alike on high alert, as a confluence of technical indicators and fundamental developments suggests that XRP may be poised for its next significant move.
________________________________________
Chapter 1: Decoding the Charts: Bullish Patterns Emerge
For technical analysts, the recent XRP charts are a compelling study in bullish potential. Several classic patterns and indicators have emerged, suggesting that the path of least resistance may be upwards. These signals, watched closely by traders globally, are fueling a narrative of an imminent breakout.
One of the most discussed formations is the "Cup and Handle" pattern. This is a bullish continuation pattern that resembles a teacup on a chart. The "cup" is a U-shaped or rounded bottom that forms after a price run-up, indicating a period of consolidation and accumulation. This is followed by the "handle," a shorter and shallower downward drift in price, representing a final shakeout before a potential major upward move. Analysts have identified a large cup formation developing on XRP's long-term charts, with some pointing to a breakout zone around $3.64. A confirmed move above the handle's resistance could, according to technical theory, trigger an explosive rally, with some analysts projecting targets as high as $5.18, $7, or even a staggering $30 based on the pattern's depth.
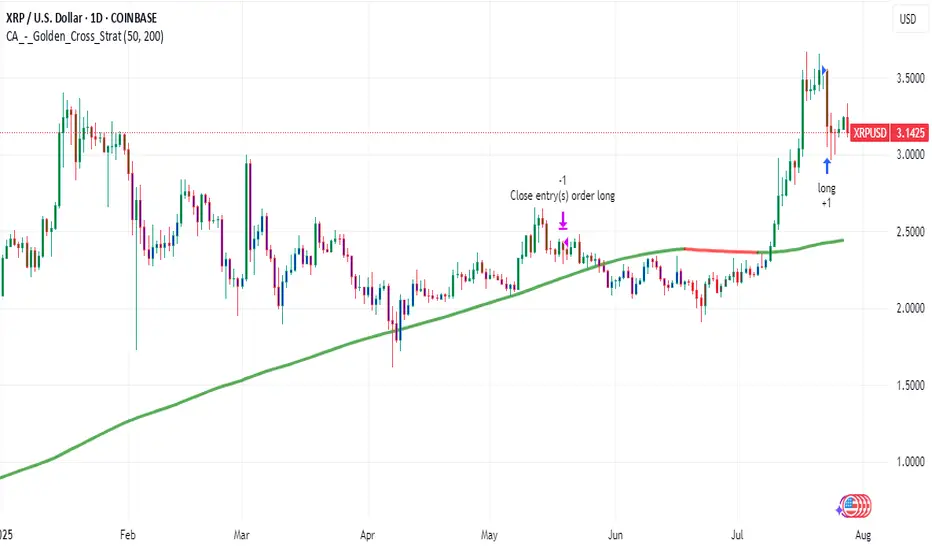
Adding to this bullish thesis is the appearance of a "Golden Cross." This occurs when a shorter-term moving average (like the 50-day) crosses above a longer-term moving average (like the 200-day) on a price chart. It is widely regarded as a signal of a potential long-term uptrend. A golden cross was recently confirmed on XRP's daily chart around July 23, 2025, an event that historically has preceded significant price runs. The last major golden cross in late 2024 was followed by a rally of over 460% in two months. While past performance is not indicative of future results, the reappearance of such a powerful signal has undoubtedly bolstered investor confidence.
Furthermore, a rare golden cross has also been observed on the XRP/BTC trading pair, where XRP's price is measured against Bitcoin. This specific event, where the 23-day moving average crossed the 200-day, previously preceded a 158% surge in the pair's value in just two weeks. The near-identical structure of the current pattern has led analysts to suggest that XRP may be poised to outperform Bitcoin in the near term, especially as Bitcoin's price has been consolidating, shifting investor focus toward promising altcoins.
These technical signals—from the broad Cup and Handle to the precise Golden Cross—are painting a picture of a market coiling for a significant move. They suggest that underlying buying pressure is quietly building, setting the stage for a potential breakout if the market's fundamental drivers align.
________________________________________
Chapter 2: The Whale Effect: Following the Smart Money
Beyond the lines on a chart, the actions of the market's largest players—colloquially known as "whales"—provide another critical layer of insight. These are individuals or entities holding vast amounts of a cryptocurrency, and their trading activity can significantly influence market trends and sentiment. Recently, on-chain data has revealed a clear and compelling trend: XRP whales are accumulating.
In a remarkable show of force, wallets holding between 10 million and 100 million XRP have been steadily increasing their holdings, adding over 130 million XRP in a single day recently. These large-scale investors now control approximately 14% of the circulating supply, a historic high for this cohort. This accumulation is significant because it suggests that sophisticated, well-capitalized market participants are confident in XRP's future prospects and are positioning themselves for a potential price increase.
Simultaneously, the flow of XRP from whale wallets to exchanges has plummeted by over 93% since early July. This is a crucial indicator, as large transfers to exchanges often signal an intention to sell. The sharp decline suggests that whales are not only buying more XRP but are also holding onto their existing assets, reducing the available supply on the market and removing significant sell-side pressure. This behavior, often described as a "supply shock," can create a powerful tailwind for the price if demand continues to rise.
This intense accumulation has not gone unnoticed. In one instance, two identical transactions moved a combined 306.4 million XRP, worth nearly $1 billion, from an exchange to a private wallet within 60 seconds. Such large, coordinated movements are often interpreted as strategic positioning ahead of anticipated positive news or a market-wide rally. This activity, combined with reports of over 2,700 wallets now holding at least 1 million XRP each, paints a picture of broad-based accumulation among the asset's most significant backers. This "smart money" activity often provides a psychological boost to retail investors, reinforcing the belief that a major move could be on the horizon.
________________________________________
Chapter 3: The Fundamental Pillars: Regulation, ETFs, and Utility
While technicals and whale movements drive short-to-medium-term sentiment, the long-term value of any digital asset rests on its fundamental pillars. For XRP, these pillars are its evolving regulatory status, the tantalizing prospect of a spot Exchange-Traded Fund (ETF), and its core utility within Ripple's global payments network.
Regulatory Clarity on the Horizon:
The most significant overhang on XRP for years has been the lawsuit filed by the U.S. Securities and Exchange Commission (SEC) in December 2020, which alleged that Ripple conducted an unregistered securities offering. This legal battle has been a focal point for the entire crypto industry. However, recent developments have shifted sentiment dramatically. Key court rulings, including a partial victory for Ripple where a judge determined that some of its XRP sales did not qualify as securities, have bolstered institutional confidence.
Currently, the case is in a delicate phase, with both Ripple and the SEC having paused their respective appeals. While rumors of a final settlement swirl, legal experts caution that the process is subject to the SEC's internal bureaucratic procedures and a formal vote is still required. Nevertheless, the prevailing belief is that the worst of the legal uncertainty is over. A final resolution, which many hope will come before the end of the year, would remove the primary obstacle to XRP's full-scale adoption in the United States and could pave the way for its relisting on major exchanges and inclusion in institutional products.
The Race for a Spot XRP ETF:
Following the landmark approvals of spot Bitcoin and Ethereum ETFs, the crypto market is buzzing with anticipation for what comes next. XRP is widely considered a prime candidate for its own spot ETF. Asset management giants like Grayscale, Bitwise, Franklin Templeton, and WisdomTree have already filed applications with the SEC.
The approval of a spot XRP ETF would be a watershed moment, providing a regulated, accessible, and insured investment vehicle for both retail and institutional investors in the U.S. to gain exposure to XRP. The launch of XRP futures-based ETFs has been seen as a positive precursor, following the same playbook that led to the spot Bitcoin ETF approvals. Market analysts and prediction markets have placed the odds of a spot XRP ETF approval in 2025 as high as 92-95%, contingent on a favorable resolution of the SEC lawsuit. Such an approval could unlock billions of dollars in institutional inflows, dramatically increasing demand and market legitimacy for the asset.
Core Utility in Global Payments:
At its heart, XRP was designed for utility. It serves as the native digital asset on the XRP Ledger, a decentralized blockchain engineered for speed and efficiency. Its primary use case is powering Ripple's payment solutions, which are now part of the broader Ripple Payments suite.
Ripple's network is designed to challenge the legacy correspondent banking system, exemplified by SWIFT, which can be slow and costly for cross-border payments. By using XRP as a bridge currency, financial institutions can settle international transactions in seconds for a fraction of a cent, without needing to pre-fund accounts in foreign currencies. This utility is not merely theoretical. Ripple has forged partnerships with over 300 financial institutions across more than 45 countries, with a significant portion utilizing XRP for liquidity. In 2024 alone, over $15 billion was transacted via Ripple's liquidity solutions, and the XRP Ledger is now processing over 2 million transactions daily. This growing, real-world adoption provides a fundamental demand for XRP that is independent of market speculation and forms the bedrock of its long-term value proposition.
________________________________________
Chapter 4: The Retirement Dream: Audacious Predictions and Future Outlook
The convergence of bullish technicals, strong fundamentals, and growing market optimism has led to a wave of bold price predictions from analysts. While highly speculative, these forecasts illustrate the immense potential that many see in XRP, fueling a narrative that significant holdings could lead to life-changing wealth.
Price targets for the current cycle vary widely, reflecting different models and timelines. Short-term targets frequently center around the $4 to $7 range, with some analysts suggesting a move to $9 or $15 is possible if momentum continues. One analyst, citing a rare bullish chart pattern, sees a potential 60% rally to around $4.47.
Looking further out, the predictions become even more audacious. Projections based on historical cycles and technical models, such as Elliott Wave theory, have put forth long-term targets of $16, $24, and even $27. Some AI-driven prediction models forecast that XRP could reach the $10-$20 range by the end of 2025, especially if an ETF is approved. Longer-term forecasts extending to 2030 suggest prices could potentially climb to between $19 and $48, depending on the level of global adoption.
These predictions have given rise to the "retire on XRP" dream among its community. For instance, if XRP were to reach one analyst firm's high-end forecast for 2030 of $32.60, an investment of 10,000 XRP could be worth over $326,000. While tantalizing, it is imperative for investors to approach such forecasts with extreme caution. The cryptocurrency market is notoriously volatile, and such high-reward potential is invariably accompanied by high risk. Regulatory setbacks, macroeconomic downturns, or a failure to achieve widespread adoption could all significantly impact XRP's future price.
Conclusion: A Confluence of Forces
XRP currently stands at one of the most fascinating junctures in its history. The digital asset is being propelled by a powerful confluence of forces: bullish technical patterns are signaling a potential breakout, on-chain data shows undeniable accumulation by its largest holders, and its fundamental value proposition is being strengthened by increasing regulatory clarity, the imminent possibility of a spot ETF, and steadily growing real-world utility.
The journey ahead is fraught with both immense opportunity and significant risk. A decisive break above its current resistance could unleash the momentum that analysts and investors have been anticipating for months. However, the market remains sensitive to legal news and broader macroeconomic trends. For now, XRP remains a bellwether asset, its story a microcosm of the broader struggle and promise of the digital asset industry—a high-stakes battle for legitimacy, adoption, and a permanent place in the future of finance
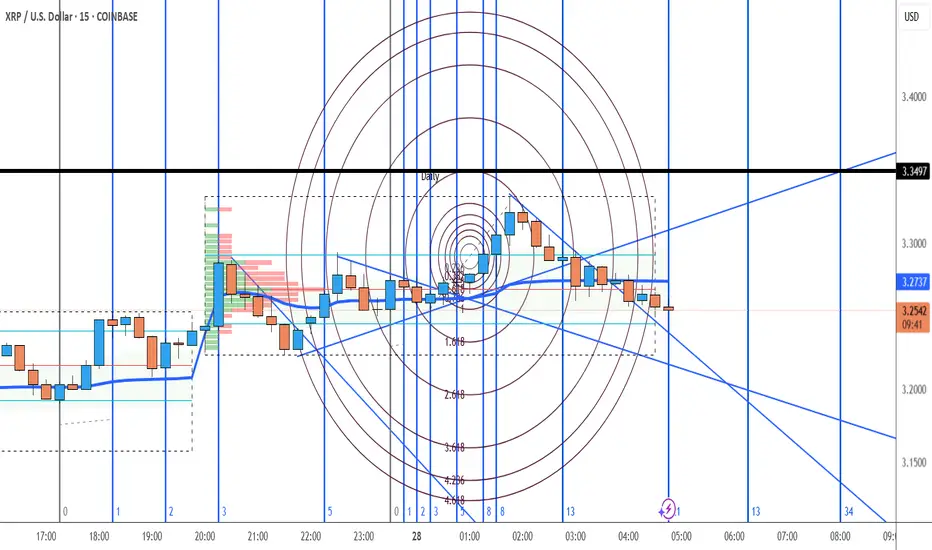
Possible Trend change to the mid 3.30'sAt mid 3.30's is a possible target for the next 48 hours. Let's see if we get a trend change from the 3.25 level.
XRP/USD Chart Hack – Rob the Market Before the Bears Do🏴☠️💸 XRP/USD Crypto Market Heist Plan: Thief Trader Style 💰📈
"Break the Vault, Rob the Trend – One Candle at a Time!"
🌍 Hi! Hola! Ola! Bonjour! Hallo! Marhaba! 🌍
To all fellow money makers, day robbers & chart thieves... welcome to the vault!
We’re diving into the XRP/USD (Ripple vs. U.S. Dollar) with a bold Thief Trading™ Strategy, blending technical mastery and market intuition.
📊 THE PLAN: Rob the Resistance – Swipe the Highs
🔥 Based on Thief Trading-style TA & FA combo, here's the master heist setup:
Long Bias ⚔️
Target: The High Voltage Resistance Zone
Status: Overbought + Trap Level = High Risk, High Reward
Market Mood: Bullish but risky – consolidation & reversal zones ahead
Crowd Behavior: Bearish robbers strong above, but we strike below
🧠 Thief Wisdom:
“The vault's open, but not every vault is unguarded. Wait, plan, attack with strategy.”
📥 ENTRY PLAN
The Heist Begins at the Pullback...
Use Buy Limit Orders (Thief Style: DCA / Layering)
Entry Zones: Near recent swing lows or within 15–30 min pullbacks
Let the price come to your trap – precision is our weapon
🛡️ STOP LOSS STRATEGY
Guard Your Loot – Always Secure Your Exit
SL Example: 2.8500 (3H TF swing low)
Customize SL based on:
⚖️ Your lot size
🎯 Risk tolerance
🔁 Number of entry layers
Remember: We don’t chase losses – we protect capital like it's gold
🎯 TARGET
Final Take-Profit: 4.0000
But hey… Thieves escape before alarms ring!
💡 If momentum slows, don’t be greedy. Exit smart, exit rich.
📡 FUNDAMENTAL + SENTIMENTAL OVERVIEW
The bullish bias is supported by:
📰 Macro Events
📊 On-Chain Signals
📈 COT Reports
🔗 Intermarket Correlations
📢 Sentiment Analysis
👉 Stay updated with the latest data — knowledge is the thief’s ultimate tool.
⚠️ TRADING ALERT – News Can Wreck the Heist
To survive news spikes:
🚫 Avoid entries during high-impact releases
📉 Use trailing SL to protect your open profits
🛑 Adjust exposure during uncertain volatility
❤️ SUPPORT THE CREW – BOOST THE PLAN
If this plan added value, hit the 🔥BOOST🔥 button.
It helps grow the Thief Trading Team, and together we rob smarter, not harder.
💬 Drop your feedback, thoughts, or charts below – let’s build the crew!
💎 Every candle tells a story. We don’t follow the trend – we rob it.
💣 Stay alert, stay rogue, and I’ll see you at the next market heist.
💰 Until then… chart smart, trade savage. 🐱👤💵

You Are Getting Ripped Off On XRP Contd.... Once again for all the hype on xrp it still can not break the all time high.
Like I said 2 weeks ago when the price was at 3.60, I will see you at $3.00 by August 1st..
Its fading and the death nail will come 5-8 days from now.
The whole crypto market will crash. The slide starts in August.
I will be buying XRP for 55 cents in 2027.
Also Silver will outgain XRP in the next 2 years by 400 percent.
Laugh and mock all you want.
Come see me August 1st.

The trend is your friend!Still respecting the trend. Maybe this week a push to the upside of 3.80 maybe 4.00

XRP bearish divergence XRP 4hr showing bearish divergence on RSI as price breaks down from trendline support.

XRPUSD - BEARISH DIVERGENCE DESPITE STRONG BULLISH PRESSUREXRPUSD SIGNALS BEARISH DIVERGENCE DESPITE STRONG BULLISH PRESSURE. WHAT TO EXPECT?👀
Ripple has been moving bullish since July 9, the same as the ETHUSD, reaching the 3.60600 resistance level. Strong bearish divergence on RSI is observed.
What is the bearish divergence?
Bearish divergence is a technical analysis pattern where the price makes higher highs in an uptrend, but a momentum indicator (e.g., RSI, MACD) forms lower highs, signaling weakening bullish momentum and a potential downward reversal. To trade, identify the divergence in a clear uptrend with the indicator showing lower highs (e.g., RSI above 70). Sell or short when the price confirms a reversal (e.g., breaks below a support level or trendline) with increased volume. Set a stop-loss above the recent high. Target the next support level.
Here the closest support level is local support 3.00000. is the price drops below the EMA20 on 4-h chart, there are high chances of reaching this level.

XRPUSD – Trend Bent, Bias BearXRP broke structure on the downside after failing to hold $3.59, slicing through the 200 SMA. Momentum flipped bearish with RSI stuck under 50, signaling distribution phase. Support rests at $3.42. Bulls need a fast reclaim of $3.50 to regain control — until then, lower highs dominate.

$XRPBullish Bias: The chart suggests a bullish outlook with a breakout from a multi-year wedge and Fibonacci targets as high as ~$16.8.
Current Pullback: The price is pulling back after breakout (possibly retesting previous resistance as support).
Risk Area: Orange box shows a potential invalidation or pullback zone before another rally.
Descending Broadening Wedge (Pattern)
A large wedge spans from 2017–2025, marked by two converging black trendlines.
XRP has broken above the wedge (bullish breakout).
Fibonacci Levels (Orange horizontal lines on the right)
0.618: ~$5.91
0.786: ~$17.87
0.88: ~$32.06
These levels are likely drawn from the ATH (All-Time High) to a major low.

XRP 1H Cup and HandleCOINBASE:XRPUSD COINBASE:XRPUSD
On the 1H time frame XRP has broken all time highs to $3.66, then dropped $0.30, forming a perfect cup and handle. XRP is now gaining momentum to break the neckline, heading into to an explosive equal move up to $4.

$XRPUSD: Limits of Expansion🏛️ Research Notes
Documenting interconnections where historic area and coordinates of formations are used to express geometry of ongoing cycle.
If we scale out the chart back starting from roughly 2016, we can see more pretext like how the price was wired before decisive breakout from triangle.
Integrating fib channel to the angle of growth phase of the previous super-cycle, so that frequency of reversals match structural narrative.

xrpusd monthlyjust woaw,
who will not like when the chart speaks itself and here it speaks itself
target is very logical, reasonable
we ll see in the future we would be there or not

XRP - Ready for Next LegXRP recently made a new all time high at $3.66. But what we are seeing could give credit to even higher highs about to be developed.
What we have seen over the last few days of price action is market structure respecting our old 2025 ATH.
Any dips we have seen have developed lows between $3.30-$3.40. Creating this in to what seems to be a new level of support.
In this post we outlined how that yellow dotted line (key level) would play a role in future price action. So far that is what has happen and we are seeing beautiful market structure develop.
If XRP is to break the $3.66 level we are likely to see a rapid increase in price. Some of the levels that could end up becoming key levels for the future are these:
$3.90
$4.20
$4.50
$5.30

XRP to $10? 🚨 XRP to $10? Here's What No One Is Telling You 💣
XRP is quietly being tested as a global liquidity bridge by BRICS & Gulf nations. If Ripple powers the rails of future CBDCs…
$6.50 to $10 XRP becomes a math problem — not a fantasy.
✅ Ripple IPO incoming
✅ U.S. relisting possible
✅ Token supply shrinking
✅ Wall Street quietly watching
This isn’t hype. It’s the sleeper setup of the decade.
Would you hold XRP if it replaced SWIFT?

Based on real-world utility and institutional integrationXRP is evolving from a speculative asset into a strategic tool for global finance. If Ripple continues to convert partnerships into active XRP usage and ETFs gain traction, XRP could be a strong long-term play. But like all crypto investments, it demands careful risk management and a watchful eye on regulatory shifts
Hex on PulseChain mirrors XRP over time, $0.003 -> $3.40 (5yrs)Attention Poverty Investors 💀
While you were crying about your Hex bags at $0.003, XRP holders were getting absolutely REKT for 4-5 years straight. "Dead project!" they laughed. Then those same clowns FOMO'd in at $3 when XRP went nuclear in 2017.
1,133x gains for the psychopaths who didn't paperhand like little babies.
Now HEX sits at the EXACT same $0.003 graveyard for 5 years. Same high supply. Same "ngmi" energy. Same braindead price action that makes moonboys rage quit.
But here's the thing, anon: Alt-season is coming and history doesn't give a %$@! about your feelings. When high supply coins pump, they pump VIOLENTLY. Ask the XRP OGs who went from eating ramen to driving Lambos.
Translation for smoothbrains:
HEX at $0.003 for 5 years = XRP at $0.003 for 5 years.
If you can't see the pattern, stay poor.
$3.40 HEX incoming? Maybe. Maybe not. But if you're not at least considering it, you're ngmi.
This is not financial advice, it's a reality check for all you $0.003 stablecoin holders 🤡
WAGMI or cope forever. Your choice.

XRP 1H Chart Analysis - Breakout PotentialThe price is currently testing the 0.702 resistance level on the 1H chart, a key zone with historical rejections. A decisive break above 0.702, confirmed by a strong bullish candle and higher volume, could target 1.363. If the price breaks above 1.000 with solid confirmation, XRP might enter price discovery, pushing toward uncharted highs.
Key Levels:
Resistance: 0.702 (current), 1.000 (major), 1.363 (next target)
Support: 0.469, 0.382, 0.236
Strategy:
Enter long on a confirmed break above 0.702, aiming for 1.363, with a stop-loss below 0.469 (1:2 risk-reward).
For a 1.000 breakout, go long with a stop-loss below 0.702, using a trailing stop as prices extend.
Watch for volume spikes to validate moves.
Alerts:
Set an alert at 0.702 for a 1% break above.
Add an alert at 1.000 for a 1% break above to catch price discovery.
Stay cautious of false breakouts and monitor real-time data for confirmation.

XRP consolidation close to done, 10$ next- update on this analysis, made more than half a year ago:
- since then Ripple has been consolidating at a high level
- history doesn´t repeat but it does rhyme is the famous saying - in case of XRP it looks like price action is literally repeating the 2017 playbook with an initial impulse - consolidation - followed by another impulse
- target of the macro triangle pattern is north of 10$ per XRP, likely to get reached by the end of the year

Ripple analysis, long-termAccording to the latest analysis, Ripple's price rose from $0.50 to $2. Further, the price is analyzed to be likely to decrease to the $1 range with a dark $4 and $3.50, which in the long term can be expected to increase Ripple to this price range.
Sasha charkhchian

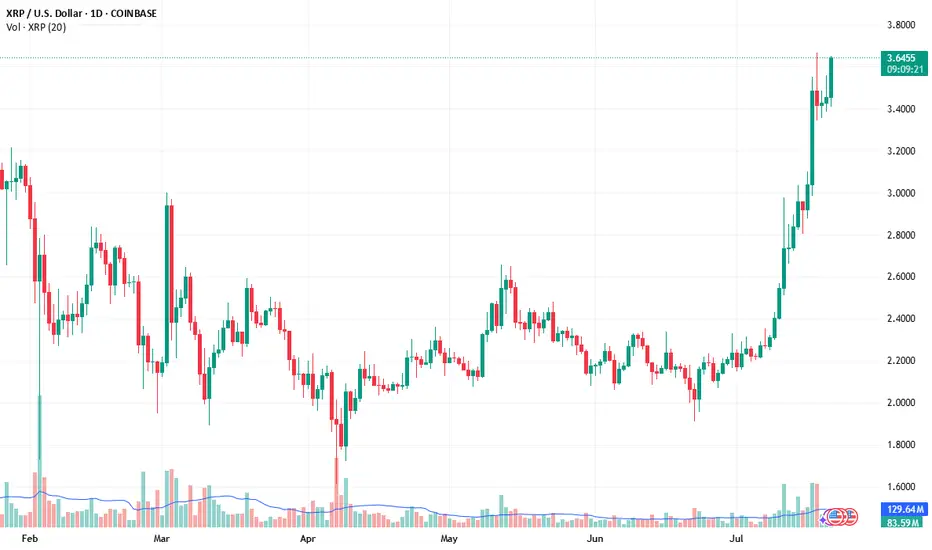
XRP Weekly ChartPrice made new ATHs on Friday went as high as $3.66, taking out the previous high at $3.39.
See if this week closes above, the monthly candle would give a stronger confirmation.
Anything could take price to $5+ or back down to $1.
