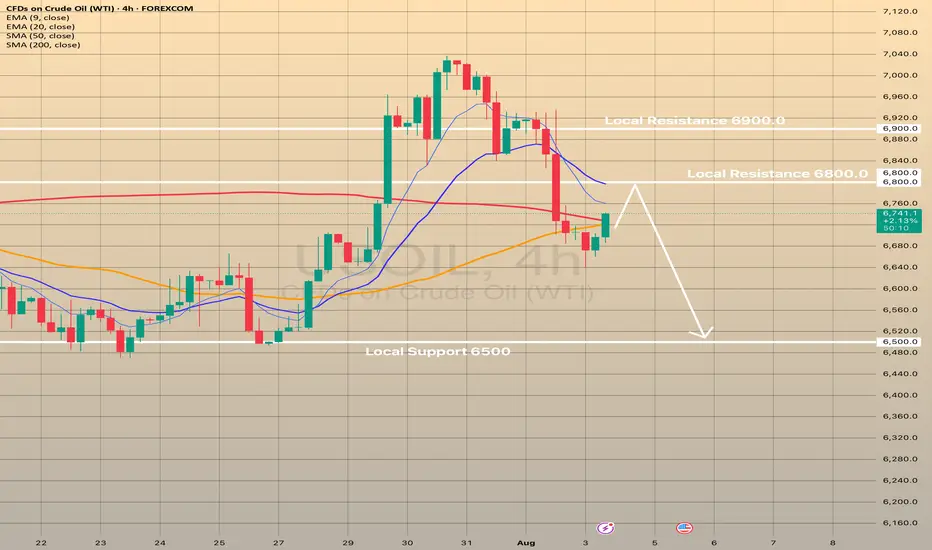
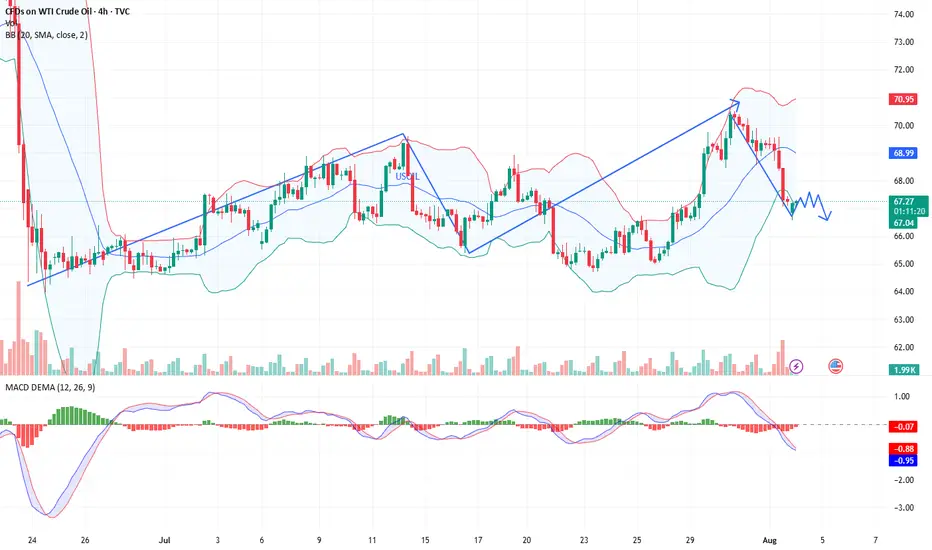
USOIL declines for the 3 days in a row. What's next?USOIL declines for the 3 days in a row. What's next?
Since the last post the USOIL has already declined on 2.5%, currently rebounding from SMA50 on 4-h chart. 2 main reasons are behind this.
On August 3, the Organization of the Petroleum Exporting Countries and their partners, collectively known as OPEC+, decided to increase oil production by 547,000 barrels per day in September, the latest in a series of swift production boosts aimed at regaining market share. They cited a robust economic outlook and low inventories as the reasons for their decision. However, Friday NFP report may signal of a potential recession risk in the United States, the biggest oil consumer in the world. Here is what the Goldman Sachs writes down in x.com: "The decline in employment growth over the previous two months in the July report was one of the largest since 1960 and was accompanied by several months of similar revisions earlier. Corrections of this magnitude are extremely rare outside of the recession period."
So, fundamentals don't favor oil and despite the current rebound from SMA50, there are low chances of developing some bullish momentum here. The pullback from 6,800.00 is expected with the following decline towards 6,500.00
XTIUSD trade ideas
Hellena | Oil (4H): SHORT to support area of 65.944.Colleagues, I previously recommended moving trades to break-even, and for good reason. It is always necessary to hedge and reduce losses—this is part of professional work.
(Breakeven=Risk Free: Move Stop loss to the entry level).
The price has nevertheless shown a stronger correction, and I now believe that the medium-term “ABC” waves have not yet formed, nor has the large “Y” wave.
This means that I expect the completion of wave “B” and then a continuation of the downward movement in wave “C.”
I consider the support area of 65.944 to be the minimum target.
Manage your capital correctly and competently! Only enter trades based on reliable patterns!

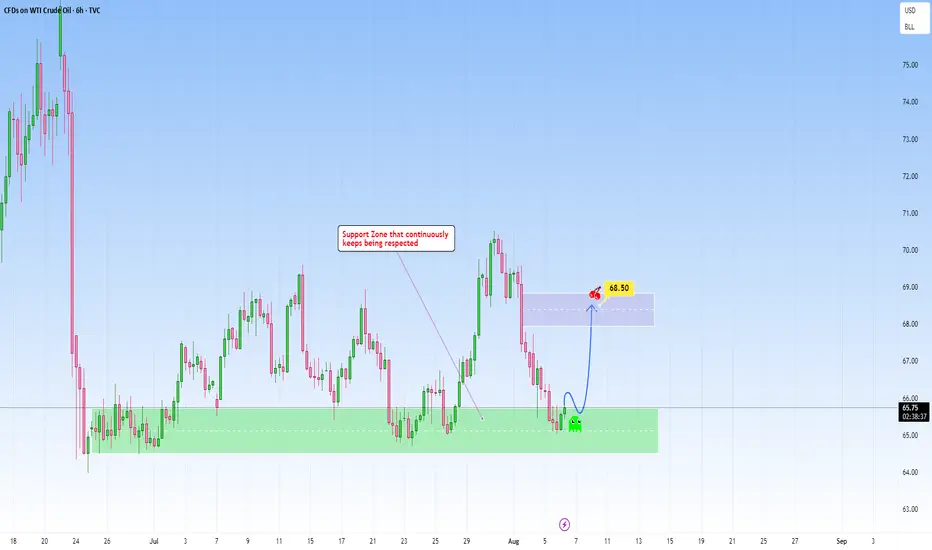
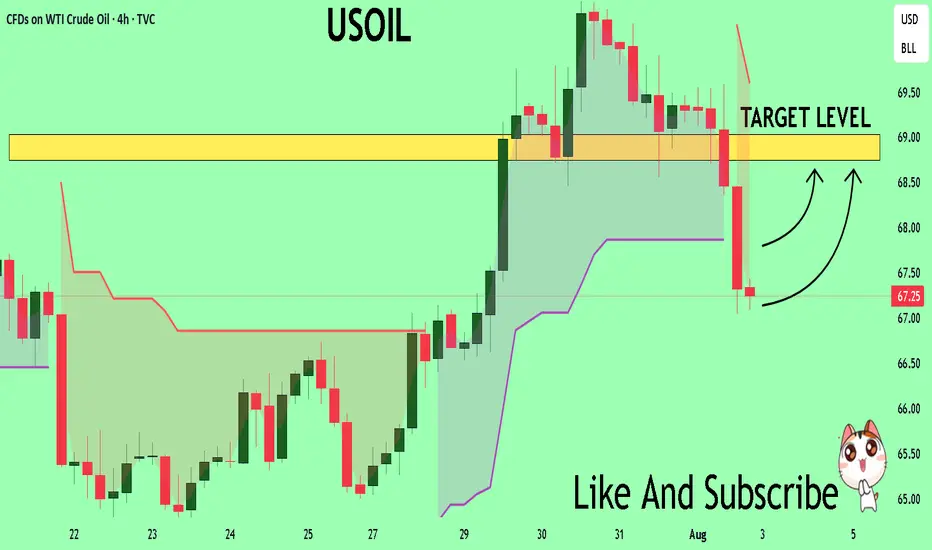
USOIL: Respecting support, repeating opportunity The chart on USOIL presents a compelling technical setup that blends structure, behavioral dynamics. The core technical analysis here lies in this support zone that is well-defined area that has been tested multiple times and consistently held, suggesting strong demand.
The narrative structure is one of rebound. Every time price approaches the support zone, the reaction is not only immediate but also structured, price responds with conviction.
So I am recognizing the strength of the reaction and forecasting an upward move to the 68.50 level.
The target at 68.50 is achievable, acting as both a profit objective and a psychological level, round enough to attract attention and previously strong enough to cause a drop. If momentum sustains, a breakout from there would depend on volume confirmation and structure shifts, but for now, the play back into that range makes sense and respects both the chart’s geometry and price action logic.
Not reacting to noise, but to repeatable high-probability zones.
Oil Faces Bearish Turn After Speculative SpikeOil Faces Bearish Turn After Speculative Spike
Since June 24, 2024, when oil prices reached $64 entered a 38-day bullish correction. Based on the chart, this move appears to be forming an ABC corrective pattern, which may now be nearing completion.
From here, a renewed decline is likely, with potential downside targets at $65, $60, and $56.
Geopolitical Speculation Oil prices jumped in recent days following President Donald Trump's heightened rhetoric toward Russia. His announcement of a tighter deadline to end the war in Ukraine, along with tariff threats targeting countries trading Russian oil, stirred market reactions.
However, this rally seems driven more by speculation, and oil may soon resume the bearish movement again.
You may find more details in the chart!
Thank you and Good Luck!
PS: Please support with a like or comment if you find this analysis useful for your trading day

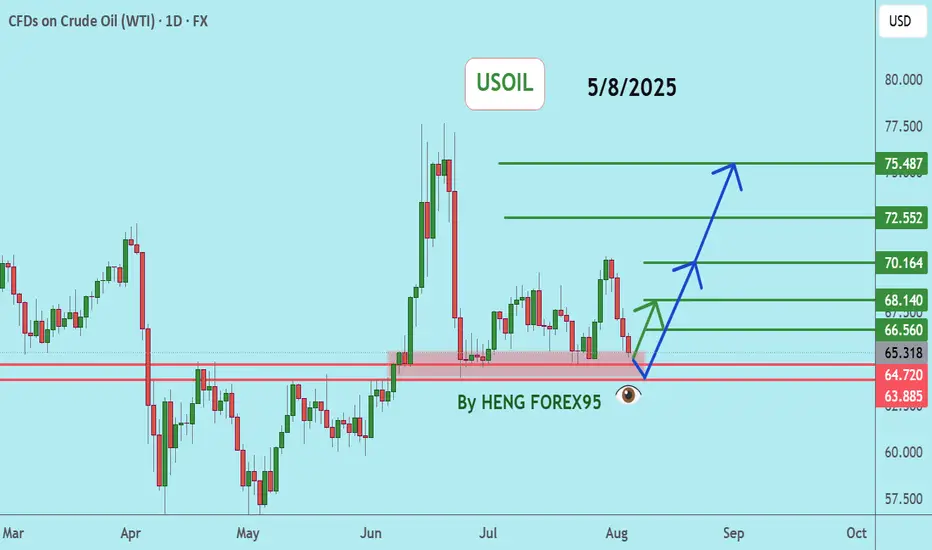
USOILUSOIL price is now testing the support zone of 64.72-63.88. If the price cannot break through the 63.88 level, it is expected that the price will rebound. Consider buying in the red zone.
🔥Trading futures, forex, CFDs and stocks carries a risk of loss.
Please consider carefully whether such trading is suitable for you.
>>GooD Luck 😊
❤️ Like and subscribe to never miss a new idea!
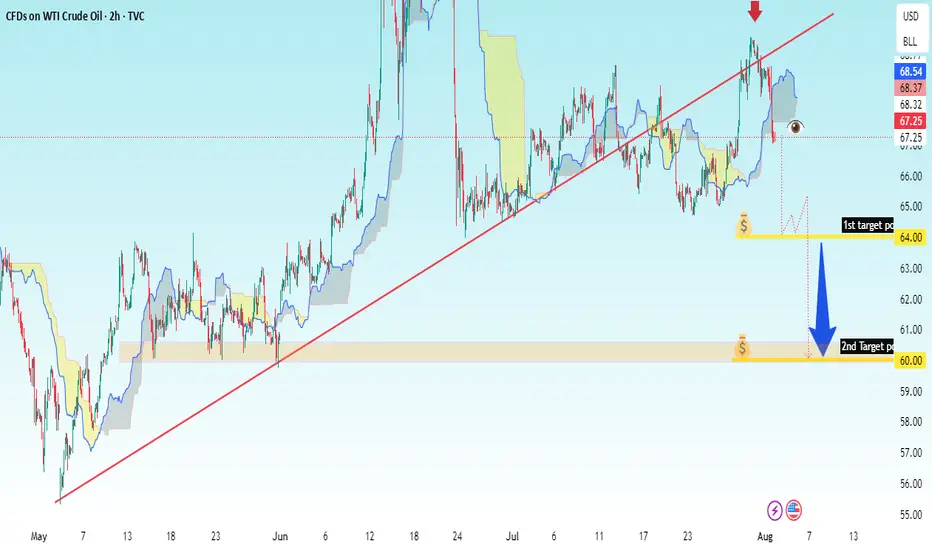
USOIL 2H – Trendline Break Sell Setup✅ Key Observations:
1. Chart Type: Candlestick chart (2h interval).
2. Trend Line: An uptrend line (red) is drawn, now broken to the downside.
3. Ichimoku Cloud: Price has broken below the Ichimoku cloud, signaling potential bearish momentum.
4. Red Arrow: Indicates a potential short entry point where price broke below the trendline.
5. Downside Targets:
1st Target Point: $64.00
2nd Target Point: $60.00
6. Bearish Projection: A large blue arrow pointing downward from the breakdown level implies a strong sell setup.
---
🎯 Your Trade Setup (based on chart):
Entry (Sell): Around $67.25–$67.50
Stop Loss: Above recent high or Ichimoku resistance, approx $68.70
Target 1: $64.00
Target 2: $60.00
Risk-Reward Ratio: Favorable, around 1:2.5 or better depending on entry
USOIL Technical Analysis! BUY!
My dear followers,
I analysed this chart on USOIL and concluded the following:
The market is trading on 67.25 pivot level.
Bias - Bullish
Technical Indicators: Both Super Trend & Pivot HL indicate a highly probable Bullish continuation.
Target - 68.74
About Used Indicators:
A super-trend indicator is plotted on either above or below the closing price to signal a buy or sell. The indicator changes color, based on whether or not you should be buying. If the super-trend indicator moves below the closing price, the indicator turns green, and it signals an entry point or points to buy.
Disclosure: I am part of Trade Nation's Influencer program and receive a monthly fee for using their TradingView charts in my analysis.
———————————
WISH YOU ALL LUCK
USOIL Is Bearish! Short!
Please, check our technical outlook for USOIL.
Time Frame: 9h
Current Trend: Bearish
Sentiment: Overbought (based on 7-period RSI)
Forecast: Bearish
The market is approaching a significant resistance area 69.178.
Due to the fact that we see a positive bearish reaction from the underlined area, I strongly believe that sellers will manage to push the price all the way down to 66.684 level.
P.S
The term oversold refers to a condition where an asset has traded lower in price and has the potential for a price bounce.
Overbought refers to market scenarios where the instrument is traded considerably higher than its fair value. Overvaluation is caused by market sentiments when there is positive news.
Disclosure: I am part of Trade Nation's Influencer program and receive a monthly fee for using their TradingView charts in my analysis.
Like and subscribe and comment my ideas if you enjoy them!

Crude Oil’s $70 Surge Still Faces 3-Year Channel ResistanceAlthough news points to a crude oil price surge, technical analysis indicates price cap risks remain within the borders of a 3-year descending channel.
Should a clear hold emerge above the $70 barrier, the bullish rebound in price action from the $64.40 zone, in line with the weekly RSI’s rebound off the neutral 50 zone, may extend toward the channel’s upper boundary at $72.40, $74.40, and $77 in more extreme scenarios.
A confirmed hold above the $77–78 zone may shift the primary trend away from bearish dominance and pave the way for longer-term bullish forecasts.
On the downside, if a price drop results in a clean break below the $64 barrier, downside risks may extend toward the mid-zone of the long-standing channel, with potential support levels at $63.20, $61.80, and $59.70, respectively.
Written by Razan Hilal, CMT

USOIL FREE LONG SIGNAL|
✅CRUDE OIL retested the strong support level of 65.14$
After trading in a local downtrend from some time
Which makes a bullish rebound a likely scenario
With the Take Profit of 65.93 and SL of 64.69$
LONG🚀
✅Like and subscribe to never miss a new idea!✅

WTI Crude key support zone at 6553The WTI Crude Oil remains in a neutral trend, with recent price action showing signs of a corrective pullback within the broader uptrend.
Support Zone: 6553 – a key level from previous consolidation. Price is currently testing or approaching this level.
A bullish rebound from 6553 would confirm ongoing upside momentum, with potential targets at:
6850 – initial resistance
6950 – psychological and structural level
7090 – extended resistance on the longer-term chart
Bearish Scenario:
A confirmed break and daily close below 6553 would weaken the bullish outlook and suggest deeper downside risk toward:
6400 – minor support
6310 – stronger support and potential demand zone
Outlook:
Neutral bias remains intact while the WTI trades around pivotal 6553 level. A sustained break below or above this level could shift momentum.
This communication is for informational purposes only and should not be viewed as any form of recommendation as to a particular course of action or as investment advice. It is not intended as an offer or solicitation for the purchase or sale of any financial instrument or as an official confirmation of any transaction. Opinions, estimates and assumptions expressed herein are made as of the date of this communication and are subject to change without notice. This communication has been prepared based upon information, including market prices, data and other information, believed to be reliable; however, Trade Nation does not warrant its completeness or accuracy. All market prices and market data contained in or attached to this communication are indicative and subject to change without notice.

CRUDE OIL Bullish Bias! Buy!
Hello,Traders!
CRUDE OIL keeps falling down
And the price will soon hit
A horizontal support of 64.00$
From where we will be
Expecting a local bullish rebound
Buy!
Comment and subscribe to help us grow!
Check out other forecasts below too!
Disclosure: I am part of Trade Nation's Influencer program and receive a monthly fee for using their TradingView charts in my analysis.

Crude oil starts to rise, are you ready?
💡Message Strategy
Oil prices continued their upward trend amid rising geopolitical risks. US President Trump recently issued a tough statement, demanding Russia end the conflict with Ukraine within 10 to 12 days or face secondary sanctions.
Fears that Russian crude oil exports might be disrupted pushed Brent crude oil prices close to $70 per barrel, marking their largest single-day gain in two weeks at 2.3%. Meanwhile, US West Texas Intermediate (WTI) crude oil prices also remained stable around $67.
The intertwined uncertainties of geopolitics and trade policy have complicated market sentiment. Besides the situation between Russia and Ukraine, investors are closely watching the August 1st trade policy deadline set by the United States and the upcoming OPEC+ meeting in early August, which will determine its September crude oil production increase plan.
The industry generally expects that despite tight crude oil inventories in some parts of the world and strong peak season consumption in the Northern Hemisphere, if OPEC+ continues to increase production, oversupply pressure will gradually emerge by the end of the year.
📊Technical aspects
From a technical perspective, the daily chart of US crude oil (WTI) shows a modest upward trend. The current price is trading steadily above its 100-day moving average, indicating continued bullish momentum.
The Relative Strength Index (RSI) remains between 55 and 60, remaining within overbought territory, suggesting further upside potential. A successful break above the key resistance level of $68.50 would open up opportunities towards $70.
💰Strategy Package
Long Position:66.50-67.00,SL:65.50,Target:68.50-69.00

Today's crude oil strategy sharingToday's Crude Oil Charlie Recommendation: 📥📥📥.
Short at $68.05, stop loss at $68.50, take profit at $66.10. (For aggressive shorting, try $67.85; for a more conservative approach, go short at $68.60).🔥🔥🔥
If the market falls to $66.50 before the New York market opens, go long at $67.70. Set the stop loss at $66.❤️🔥❤️🔥❤️🔥
⚠️⚠️⚠️The market is risky; participate rationally. FX:USOIL MARKETSCOM:USOIL FX:USOILSPOT FX:USOILSPOT MARKETSCOM:USOIL
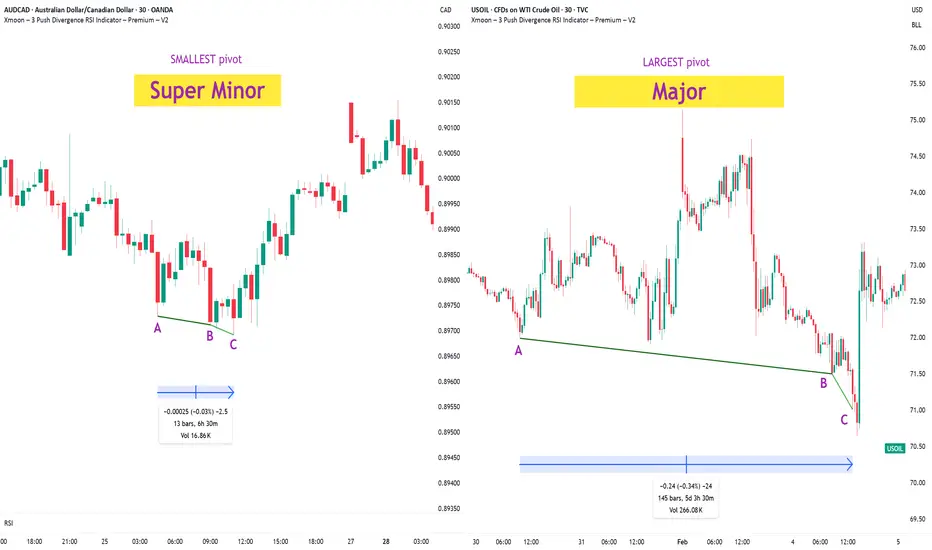
Xmoon Indicator Tutorial – Part 2 – Pivots🔻🔻🔻+ Persian translation below 🔻🔻🔻
🔹 What Is a Pivot?
In the Xmoon strategy, every high or low that forms on the chart is considered a pivot.
The number of candles between two highs or two lows defines the size of the pivot.
The more candles there are between them, the larger and more reliable the pivot becomes.
🔸 Types of Pivots in the Xmoon Indicator Settings
In the settings panel, you can choose which types of pivots the patterns should be based on.
There are 4 pivot types :
• Super Minor → the smallest pivot
• Minor
• Mid Major
• Major → the largest pivot
⏫ As you move from Super Minor to Major, the strength of the pivot increases — but the number of signals decreases.
⚖️ Choosing the Right Pivot = Your Trading Style
• Want more signals? → Use smaller pivots like Minor or Super Minor
• Prefer higher accuracy and lower risk? → Use larger pivots like Major or Mid Major
💡 Pro Tip: On higher timeframes, pivots perform better and help reduce risk.
✍️ Summary
If you're looking for frequent signals, trade on lower timeframes, and can handle higher volatility and pressure, then smaller pivots like Super Minor and Minor are a better choice.
But if you prefer quality over quantity, work on higher timeframes, and value clarity, peace of mind, and higher success rates, then larger pivots like Mid Major and Major are the way to go.
📣 If you have any questions or need guidance, feel free to ask us. We’d be happy to help.
🔻🔻🔻 Persian Section – بخش فارسی 🔻🔻🔻
🔹 پیوت چیست؟
در استراتژی ایکسمون، هر قله یا درهای که روی چارت شکل میگیرد، یک پیوت محسوب می شود
فاصله زمانی بین دو قله یا دو دره (یعنی تعداد کندلهایی که بینشان قرار دارد) اندازهی پیوت را مشخص میکند
هرچه تعداد کندل بین دو سقف یا کف بیشتر باشد، آن پیوت بزرگتر و معتبرتر است
🔸 انواع پیوت در تنظیمات اندیکاتور ایکسمون
در بخش تنظیمات، میتوانید مشخص کنید که الگوها بر اساس چه نوع پیوتهایی شناسایی شوند
ما ۴ نوع پیوت داریم
• سوپر مینور ← کوچکترین پیوت
• مینور
• میدماژور
• ماژور ← بزرگترین پیوت
⏫ هرچه از سوپرمینور به سمت ماژور برویم، قدرت پیوت بیشتر میشود، ولی تعداد سیگنالها کمتر می شود
⚖️ انتخاب پیوت مناسب = سبک معاملاتی شما
• به دنبال سیگنال زیاد هستید ← پیوت کوچک تر = مینور و سوپرمینور
• به دنبال دقت بیشتر و ریسک کمتر هستید← پیوت بزرگتر = ماژور و میدماژور
💡 نکته حرفهای: در تایمفریمهای بالا، پیوتها عملکرد بهتری دارند و به کنترل ریسک کمک میکنند
✍️ جمعبندی
اگر دنبال سیگنالهای زیاد هستید، در تایمفریمهای کوچکتر کار میکنید و میتونید نوسانات و فشار روانی بالاتر رو تحمل کنید، پیوتهای کوچکتر مثل سوپرمینور و مینور انتخاب مناسبتری هستند
اما اگر در تایم فریم های بزرگتر کار می کنید و کیفیت سیگنال، آرامش ذهنی و احتمال موفقیت برایتان مهمتر است، پیوتهای بزرگتر مثل میدماژور و ماژور انتخاب بهتری هستند
📣 اگر سوالی دارید یا نیاز به راهنمایی دارید، خوشحال میشویم از ما بپرسید
با کمال میل در خدمتتان هستیم
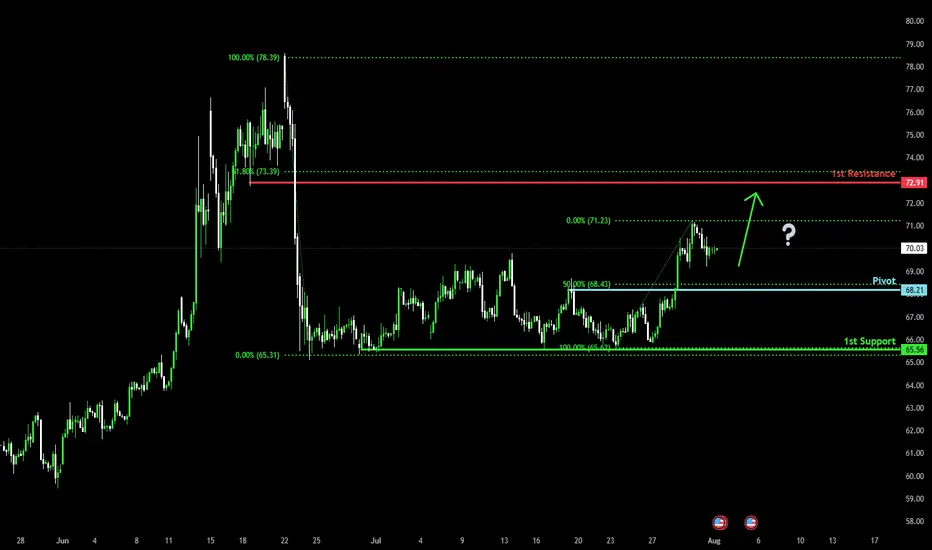
Falling towards 50% Fibonacci support?WTI Oil (XTI/USD) is falling towards the pivot, which has been identified as a pullback support and could bounce to the 1st resistance.
Pivot: 68.21
1st Support: 65.56
1st Resistance: 72.91
Risk Warning:
Trading Forex and CFDs carries a high level of risk to your capital and you should only trade with money you can afford to lose. Trading Forex and CFDs may not be suitable for all investors, so please ensure that you fully understand the risks involved and seek independent advice if necessary.
Disclaimer:
The above opinions given constitute general market commentary, and do not constitute the opinion or advice of IC Markets or any form of personal or investment advice.
Any opinions, news, research, analyses, prices, other information, or links to third-party sites contained on this website are provided on an "as-is" basis, are intended only to be informative, is not an advice nor a recommendation, nor research, or a record of our trading prices, or an offer of, or solicitation for a transaction in any financial instrument and thus should not be treated as such. The information provided does not involve any specific investment objectives, financial situation and needs of any specific person who may receive it. Please be aware, that past performance is not a reliable indicator of future performance and/or results. Past Performance or Forward-looking scenarios based upon the reasonable beliefs of the third-party provider are not a guarantee of future performance. Actual results may differ materially from those anticipated in forward-looking or past performance statements. IC Markets makes no representation or warranty and assumes no liability as to the accuracy or completeness of the information provided, nor any loss arising from any investment based on a recommendation, forecast or any information supplied by any third-party.
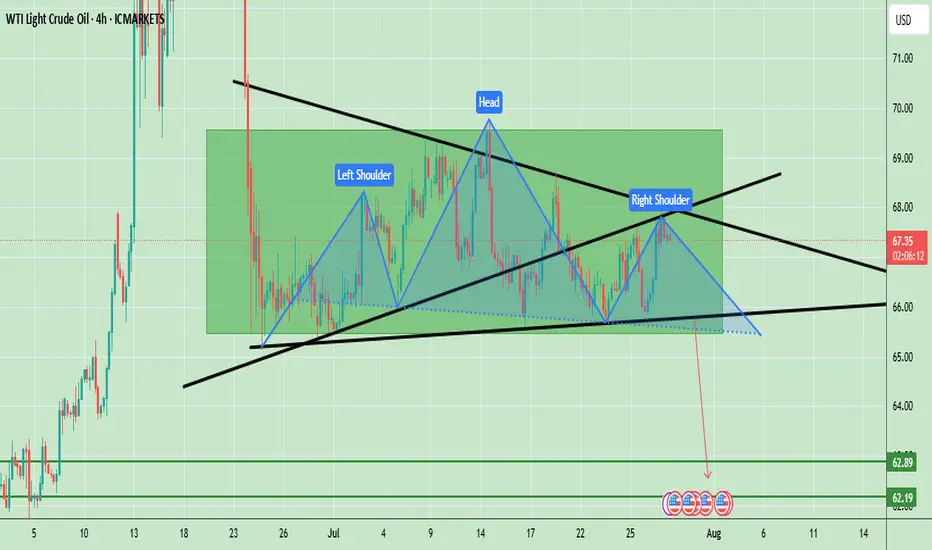
Oil Prices Form Bearish Head & Shoulders – Key Neckline in FocusWTI crude oil is showing a clear Head and Shoulders (H&S) pattern, which is a strong bearish reversal signal. The left shoulder formed in early July, followed by a higher peak forming the head in mid-July, and finally the right shoulder near the current levels, which is lower than the head. The neckline is positioned around $66.00, acting as a key support level. Currently, the price is trading at $67.34, hovering slightly above this neckline, indicating that the market is at a critical decision point. A confirmed break below the neckline could accelerate bearish momentum, targeting the $62.20 – $62.80 zone based on the pattern’s measured move. However, if the neckline holds, a possible bounce toward $68.50 – $69.00 could occur, but overall bias remains bearish unless the price can break and sustain above $69.00.
Key Price Levels:
- Resistance: $68.50 – $69.00
- Neckline Support: $66.00
- Bearish Target (if confirmed): $62.20 – $62.80
Note
Please risk management in trading is a Key so use your money accordingly. If you like the idea then please like and boost. Thank you and Good Luck!
WTI: Oil Markets on Edge Despite Trump Considering Major TariffsOil prices could drop if Trump backs down on tariffs on countries buying Russian oil, but short-term bullish catalysts, like geopolitical tensions and bullish speculative bets, may still push prices up before longer-term headwinds take hold.
----------------------------------------------------------------------------------------------------------------------
Trump’s threats of steep tariffs on countries buying Russian oil have sent oil prices surging, as traders fear a global supply crunch if Russian barrels are cut off.
But here’s the twist: Trump has a history of backing down or delaying tariffs after using them as leverage. When he does, oil prices usually fall, as the immediate risk of supply disruption fades.
If he caves in again by the deadline, which is 10 to 12 days from 4 August, or extends it, oil prices could drop. The bigger picture also appears bearish: OPEC+ is ramping up supply, global demand is slowing and expected to drop in H2, and inventories are rising (first glimpse by EIA, Wed).
But with the deadline falling around 14–16 August, 2025, short-term bullish catalysts could spark a rally up to the 38.2%-61.8 % Fibonacci retracement levels, positioning WTI better for declines (conditional on Trump!).
This content is not directed to residents of the EU or UK. Any opinions, news, research, analyses, prices or other information contained on this website is provided as general market commentary and does not constitute investment advice. ThinkMarkets will not accept liability for any loss or damage including, without limitation, to any loss of profit which may arise directly or indirectly from use of or reliance on such information.

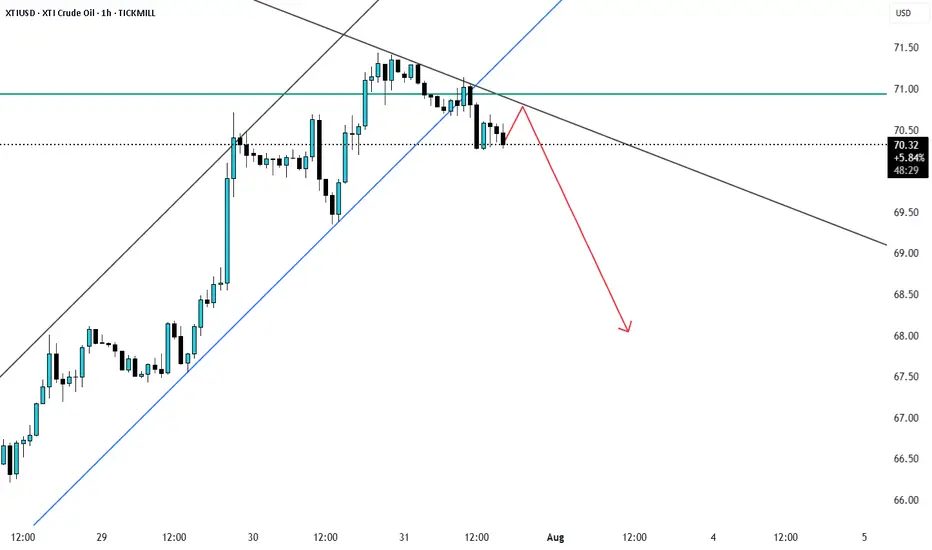
XTIUSD rejection from fib 0.5 XTIUSd recently pulled back to fib0.5 level and is currently looks to be reversering as support trendline broke and price may reject from here.
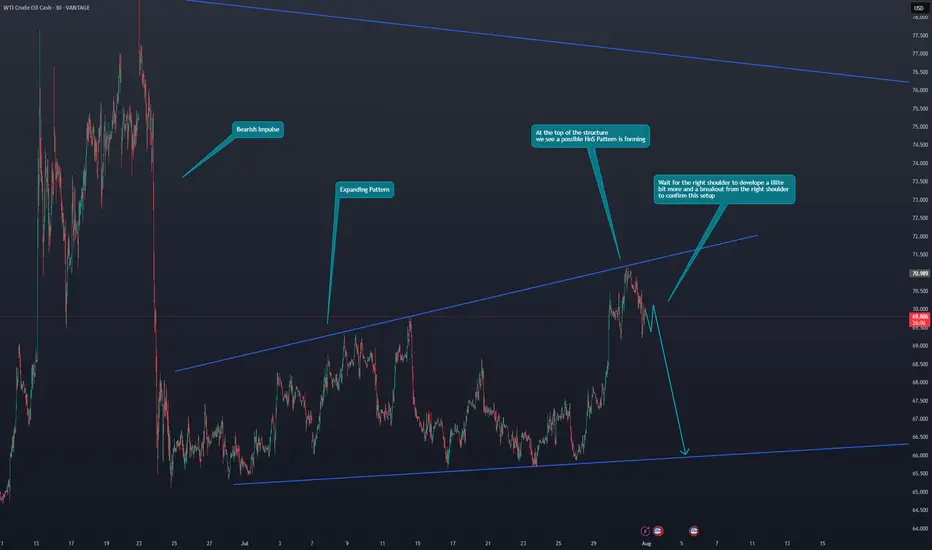
US OIL Potential ShortHi Traders.
Wait for the right shoulder to develope a lillte
bit more and a breakout from the right shoulder
to confirm this setup
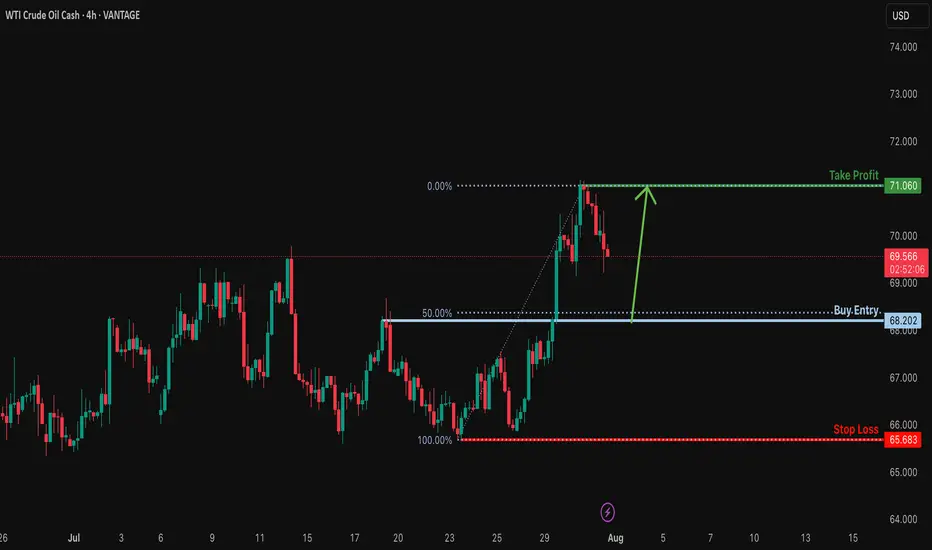
Bullish bounce off 50% Fibonacci support?USOUSD is falling towards the support levle which is a pullback support that aligns with the 50% Fibonacci retracement and could bounce from this level to our take profit.
Entry: 68.20
Why we like it:
There is a pullback support that lines up with the 50% Fibonacci retracement.
Stop loss: 65.68
Why we like it:
There is a multi swing low support.
Take profit: 71.06
Why we like it:
There is a swing high resistance.
Enjoying your TradingView experience? Review us!
Please be advised that the information presented on TradingView is provided to Vantage (‘Vantage Global Limited’, ‘we’) by a third-party provider (‘Everest Fortune Group’). Please be reminded that you are solely responsible for the trading decisions on your account. There is a very high degree of risk involved in trading. Any information and/or content is intended entirely for research, educational and informational purposes only and does not constitute investment or consultation advice or investment strategy. The information is not tailored to the investment needs of any specific person and therefore does not involve a consideration of any of the investment objectives, financial situation or needs of any viewer that may receive it. Kindly also note that past performance is not a reliable indicator of future results. Actual results may differ materially from those anticipated in forward-looking or past performance statements. We assume no liability as to the accuracy or completeness of any of the information and/or content provided herein and the Company cannot be held responsible for any omission, mistake nor for any loss or damage including without limitation to any loss of profit which may arise from reliance on any information supplied by Everest Fortune Group.
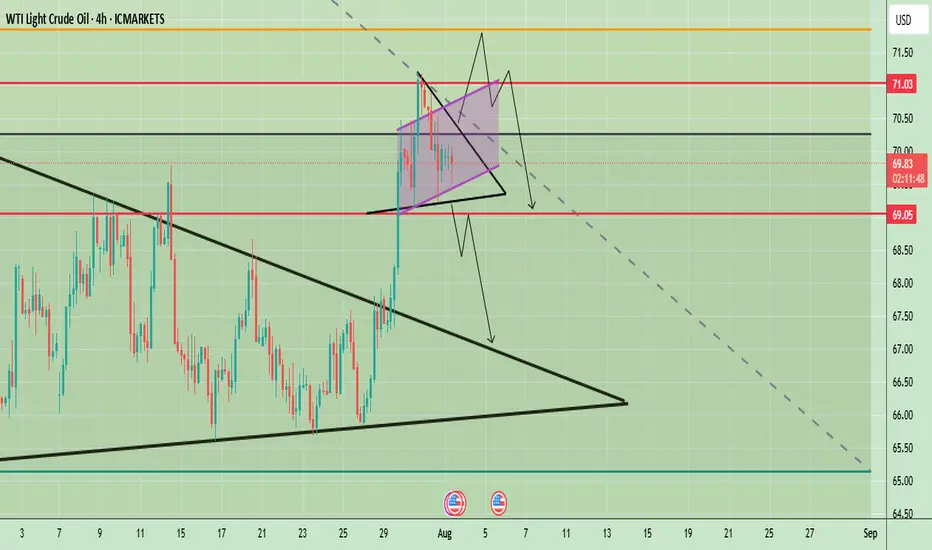
WTI Crude Oil Technical Outlook – Key Breakout or BreakdownWTI Crude Oil 4-hour chart suggests a potential inflection point after a strong bullish breakout from a larger symmetrical triangle pattern in late July. The price surged past key resistance levels and is now consolidating in a smaller symmetrical triangle formation just below the psychological $70 mark. This indicates a phase of indecision following a strong move, with market participants awaiting further confirmation.
Price is currently hovering around $69.82, with key levels marked at $71.03 (resistance) and $69.05 (support). The short-term price action within the tight triangle could determine the next move, with both bullish continuation and bearish reversal scenarios on the table.
Prices remain supported by supply concerns after Trump threatened to impose 100% secondary tariffs on buyers of Russian crude and warned China, a major oil consumer of severe penalties if it continues its purchases of Russian oil.
🔍 Potential Scenarios
- Bullish Breakout Scenario
If price breaks out of the smaller symmetrical triangle to the upside and clears the $70 resistance level with strong momentum, it may quickly test the $71.03 zone. A clean break above $71.03 would confirm the continuation of the previous uptrend, potentially opening room toward $72.50 and beyond in the medium term. The pattern would resemble a bullish pennant — a continuation pattern following the late July rally.
-Bearish Rejection and Breakdown
Conversely, a failure to sustain above $70 followed by a break below the lower boundary of the smaller triangle could lead to a sharper decline. The first critical level to watch would be $69.05; a break below this would likely invalidate the bullish setup and initiate a retest of the previously broken upper trendline of the larger triangle near $67.50. A further breakdown could lead price towards the larger support zone around $65–$66.
📈 Trend Outlook
- Short-Term: Neutral to Bullish — Consolidation in a smaller symmetrical triangle suggests a pause before continuation. However, the structure is still technically bullish unless $69.05 is broken.
- Medium-Term: Bullish Bias — The breakout from the large symmetrical triangle in late July indicates a shift in market sentiment, favoring higher prices unless the price fails to hold above $67.50.
- Long-Term: Cautiously Bullish — As long as WTI holds above the $65–$66 structural support area, the longer-term outlook remains constructive.
Note
Please risk management in trading is a Key so use your money accordingly. If you like the idea then please like and boost. Thank you and Good Luck!
USOIL BULLISH BIAS RIGHT NOW| LONG
USOIL SIGNAL
Trade Direction: long
Entry Level: 66.22
Target Level: 69.94
Stop Loss: 63.73
RISK PROFILE
Risk level: medium
Suggested risk: 1%
Timeframe: 9h
Disclosure: I am part of Trade Nation's Influencer program and receive a monthly fee for using their TradingView charts in my analysis.
✅LIKE AND COMMENT MY IDEAS✅
