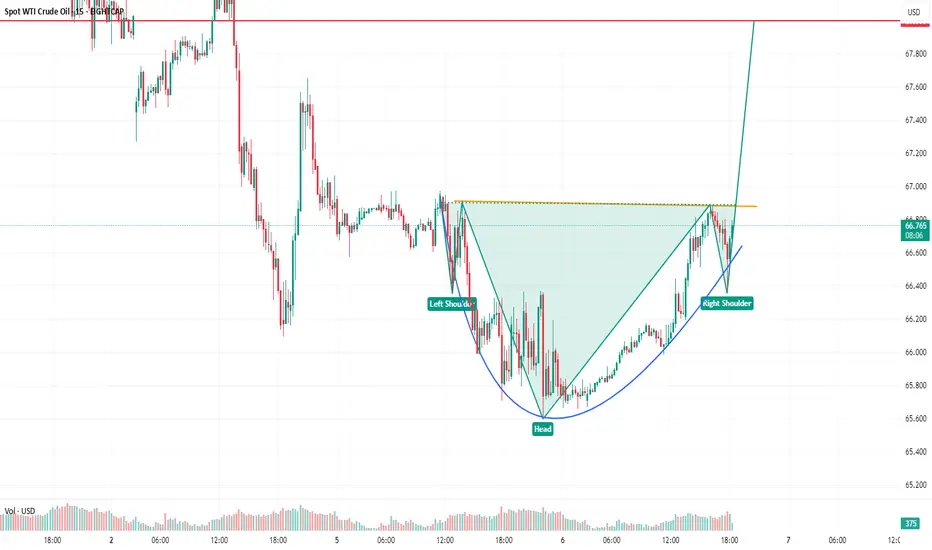
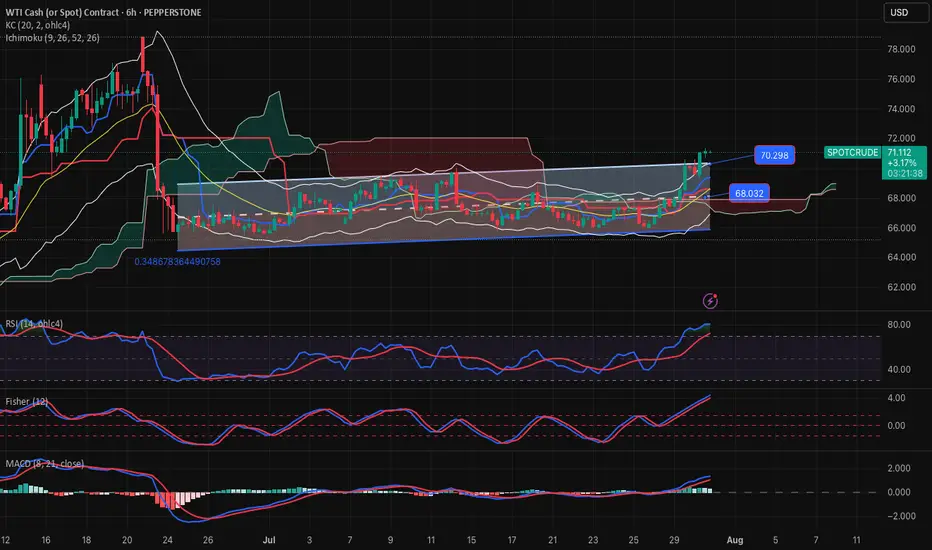
WTI Spot crudeinverted head and shoulder observed if breakout given target too in chart. Not a sebi registered analyst . No buy, sell and hold recommendation personal view.
XTIUSD trade ideas
US CRUDE OIL(WTI): Consolidation ContinuesUSOIL is currently consolidating within a horizontal channel and has shown a bearish response at resistance,
The price formed a small double top pattern before declining.
There's a strong likelihood that the price will soon reach the 67.83 level.

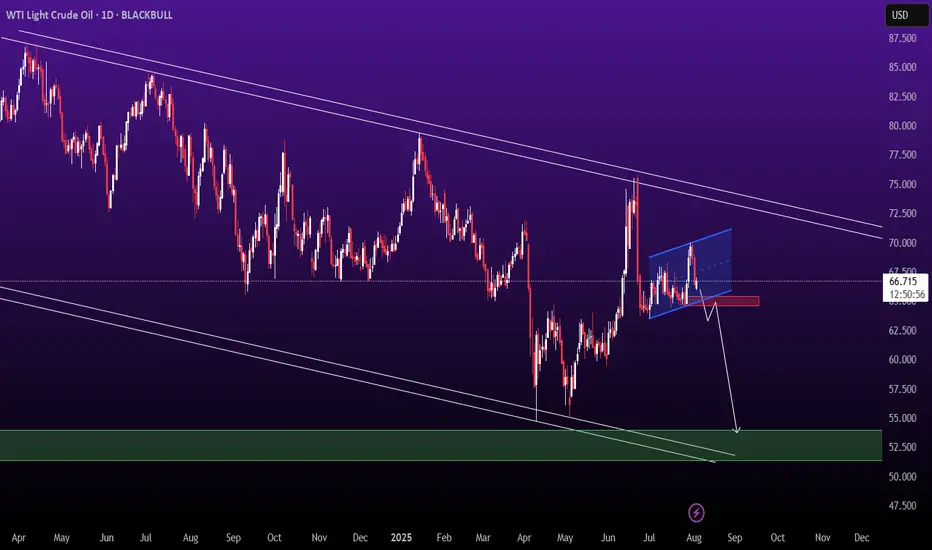
Crude OilOil will go down to %50 by EOY 2026 unless it breaks the upper bound of the downsloping parallel.

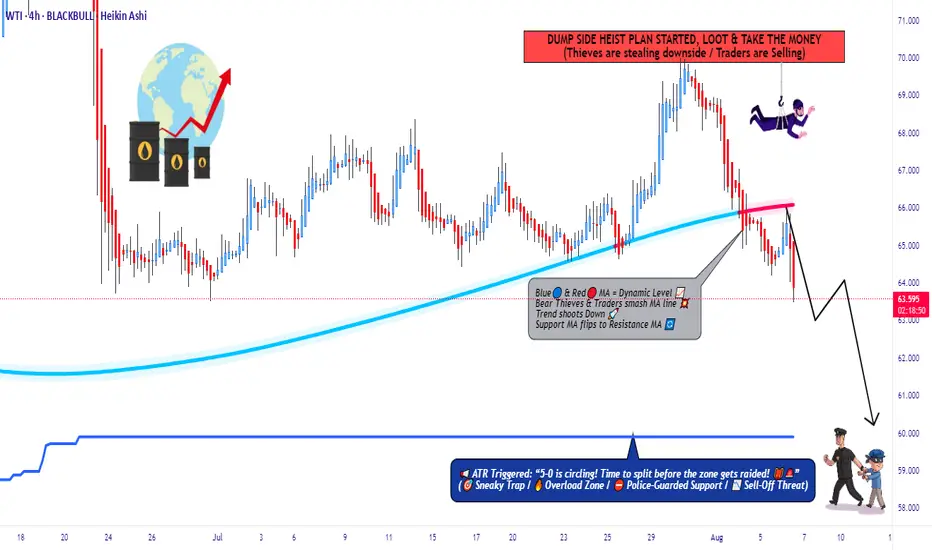
WTI Under Attack – Rob the Market with This Bear Setup🛢️💣 WTI Oil Short Raid: Bearish Heist Activated! 💣🛢️
📉 Thief Trader’s Limit-Layered Attack Plan 🔐
💥 Attention Market Robbers & Chart Breakers! 💥
We're about to break into the XTIUSD / US Oil Spot vault — Bearish style.
🚨 The Setup:
This ain’t your average breakout — we’re talking high-precision, multi-layered entries on a downside raid.
🧠 Thief Trader Strategy: Drop limit orders at key zones like trip wires. Let price walk into your trap.
🎯 Plan:
🧱 Entry: Any level after MA resistance confirmation.
Layer multiple limit orders — DCA-style — after trend shows weakness.
🛑 Stop Loss: 66.300 🔒
Protect your vault. Place SL just above major 4H rejection zone.
🎯 Target: 60.000 💰
Profit at exhaustion level. This is where bulls cry, and we cash out.
🧠 Robbery Logic Backed By:
COT Data 📊
Crude Oil Inventories 🛢️
Macro + Sentiment Flows 🌐
Technical MA Break + Retest Patterns 🎯
🔥 Why this isn’t a random short?
Because thieves do research — not guesswork.
Bulls have overextended. Oil’s price is reacting to strong supply pressure and weakening demand outlook.
⚠️ Risk Note:
No entry without trend confirmation.
No blind shots — place alerts and wait for the setup.
This is a sniper job, not a shotgun spray.
💬 Join the Robbery Crew
Smash that ❤️ & Boost if you're riding with the thieves!
Drop your charts, entries, or sniper shots in the comments 💬
We rob together. We win together.
🔔 Follow for more heist plans – next market break-in coming soon.
💰 Rob Smart. Trade Sharp. Exit Clean. 🏴☠️
UPDATEOn our 2nd trade of the day we closed before the price reaches our main target.
As y'all can see on the chart, the price couldn't break our 4:30am FVG, so as soon as it came back off it we immediately closed our position with a RR of 1:2
See you tomorrow!

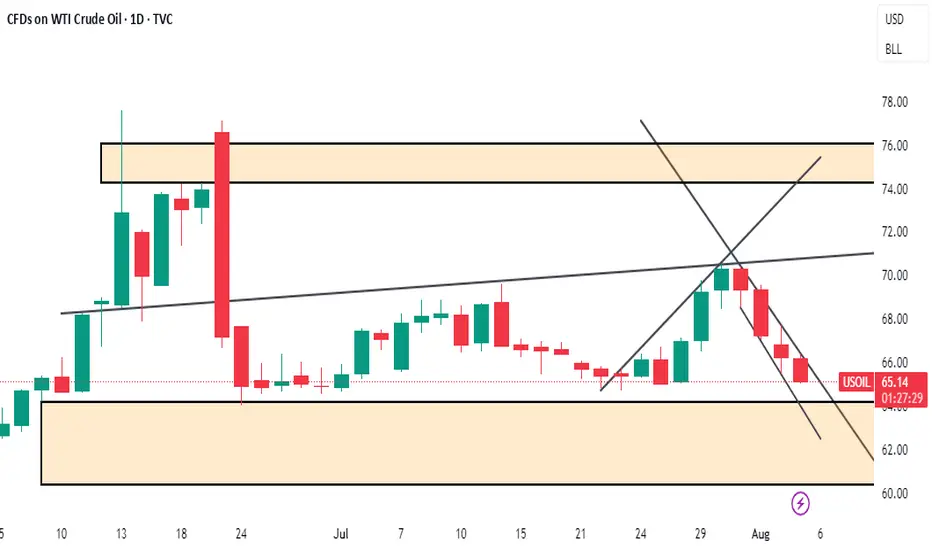
oil . wti analysis Oil is in a big downtrend channel on the weekly timeframe.
After hitting the top of that channel, price got rejected.
Now, if it breaks below its daily channel, I’m expecting it to drop all the way down to the bottom of the bigger channel
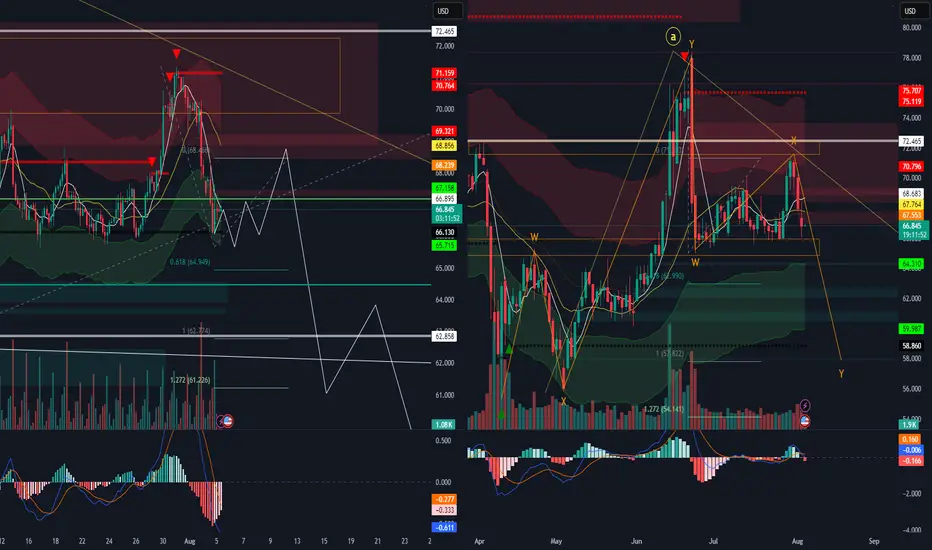
OIL - shortFollowing our previous forecasted up-move, from now on we will switch to looking for sell setups only. We would normally expect the C wave of the corrective pattern retrace all the way to the 0.618 fib of the downward impulse, as the A wave had already retraced to the 0.382. But that isn't necessarily always the case. As long as the C retracement has broken the top of the A retracement, the pattern formally speaking can be complete. We will not be looking for further buys, therefore, from now on. Even if it does continue to the 0.618, we will skip the eventual buy and focus on the sells. At the same time, because the eventuality of more up exists, we will wait for a proper sell setup before we enter any short position. Updates will follow.

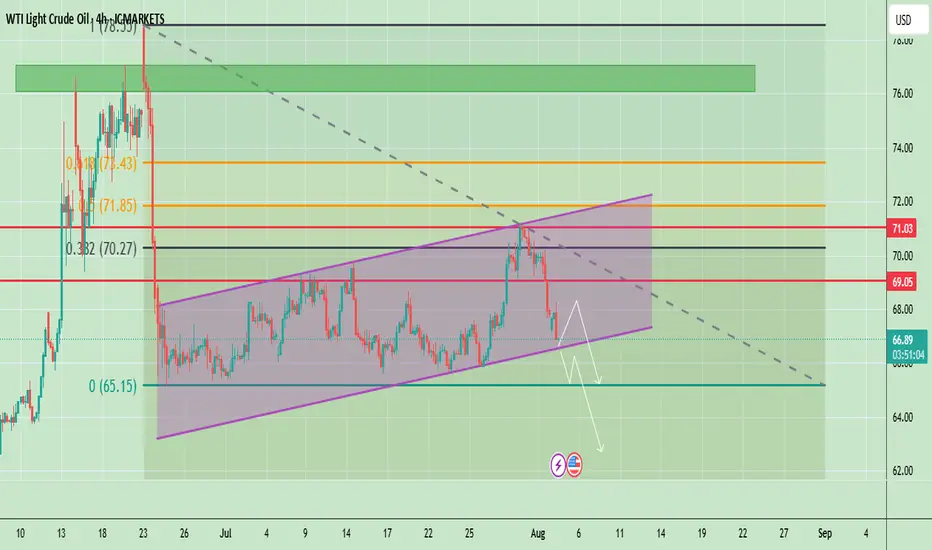
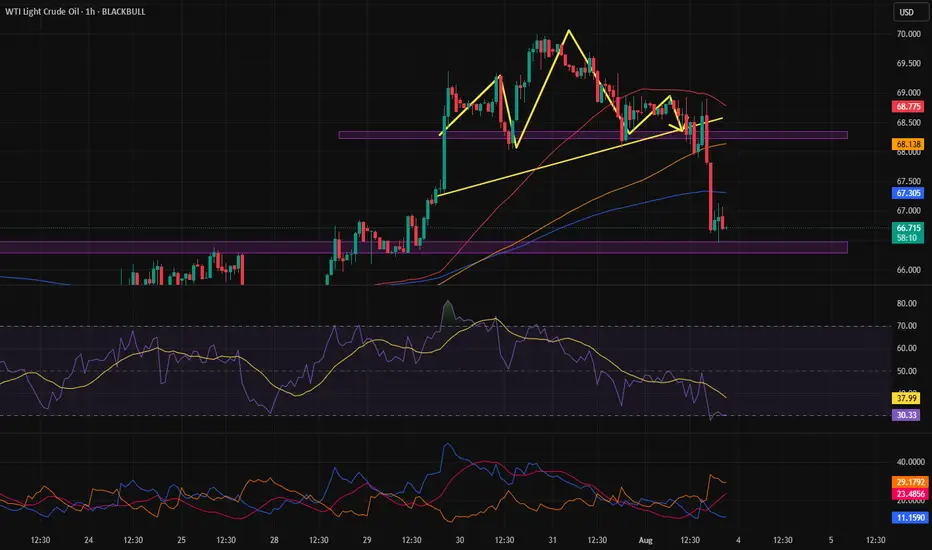
Oil at Key Support – Bounce or Breakdown?Crude oil is trading around $66.94, showing a bearish correction after failing to hold above $69.05. The chart shows price respecting an ascending channel but currently testing its lower boundary. The recent drop signals weakening bullish momentum, and a confirmed break below the channel could accelerate selling pressure toward lower levels.
📈 Potential Scenarios
- Bullish Rebound: If price holds above the channel support (~$66.00–$66.50) and breaks back above $69.05, it may target $71.03 and possibly $72.00.
- Bearish Breakdown: A confirmed close below $66.00 can accelerate the downside toward $65.00, with extended targets near $63.50–$62.00.
📊 Key Technical Highlights
- Price rejected from the channel top and is now testing lower support.
- Key resistance zones: $69.05 (immediate), $71.03 (major).
- Key support zones: $66.00 (channel), then $65.00–$63.50 (breakdown targets).
- Momentum indicators show weakening buying pressure, favoring cautious trading.
🔑 Key Levels to Watch
- Resistance: $69.05 → $71.03 → $72.00
- Support: $66.00 → $65.00 → $63.50
🧭 Trend Outlook
- A short-term relief bounce is possible, but failure to reclaim $69.05 keeps sellers in control.
- Breaking below the channel would shift the overall outlook to bearish for August.
Note
Please risk management in trading is a Key so use your money accordingly. If you like the idea then please like and boost. Thank you and Good Luck!
WTI watch $70.34-70.43: Resistance zone that may STOP the surgeUSOIL spiked on Trump/Russia/Iran tariff threats.
Just hit a significant resistance at $70.34-70.43
Look for a Dip-to-Fib or Break-n-Retest for longs.

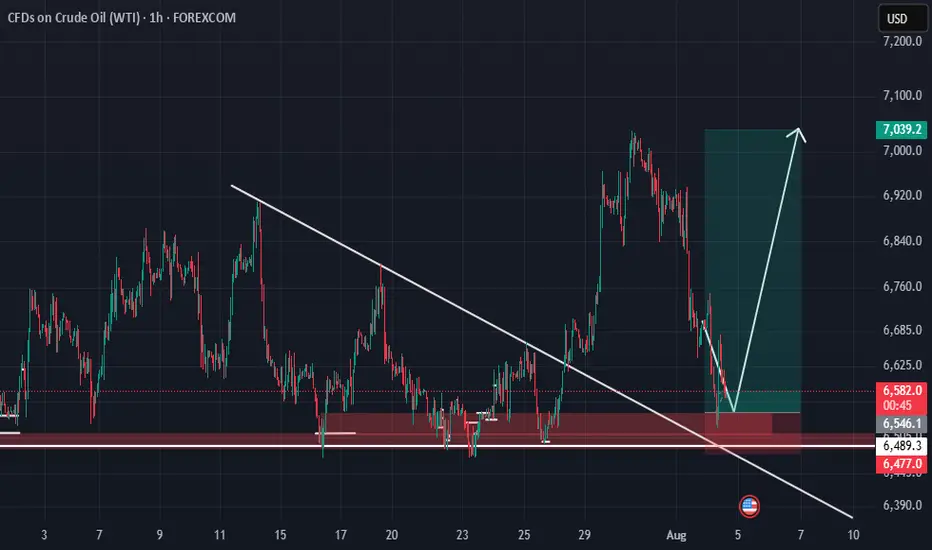
Long price is coming back to retest an area of support which has been respected for over a month I expect price to reject from support level
USOIL drops on rising supply and demand concernsUSOIL drops on rising supply and demand concerns
Oil prices fell Tuesday as OPEC+ planned a 547,000 bpd output increase for September, overshadowing potential Russian oil supply constraints from U.S. policies. Brent and WTI crude dropped to their lowest in a week, marking a fourth consecutive decline. OPEC+’s reversal of 2.5 million bpd cuts, combined with weak demand outlooks due to U.S. recession risks and China’s lack of new stimulus, pressured prices. Trump’s threatened 100% tariffs on Russian crude buyers like India, which imports 1.75 million bpd, heightened trade tensions but failed to lift oil prices. Analysts warn U.S. tariffs could further weaken global growth and fuel demand.
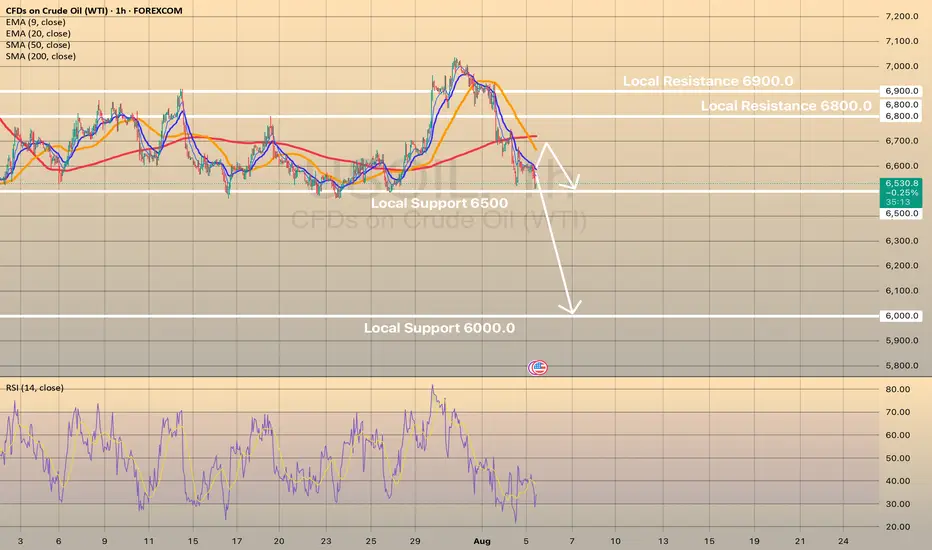
USOIL shows some in-moment strength on RSI on 1-h chart, the price may rebound towards sma200 at 6,700.00. However, in long-term perspective, low oil price is expected. Eventually, the price may decline towards level of 6,000.00.
BUY USOILI'm sharing with you our 2nd trade for the day which is agail on USOIL, you can see that the price came to grab the 1H LQ, then we got us a reversal we just took.
Follow for more!

USOIL WTIWest Texas Intermediate (WTI) oil is a major benchmark for crude oil pricing, known for its high quality—being both light and sweet due to its low sulfur content and low density. WTI is sourced primarily from inland Texas and is the underlying commodity for oil futures traded on the New York Mercantile Exchange (NYMEX). The main physical delivery point is Cushing, Oklahoma, a critical U.S. oil storage and trading hub.
Current Price (as of August 1, 2025)
WTI crude oil is trading around $69.15–$69.36 per barrel.
Recently, WTI prices have seen volatility due to global economic factors, including U.S. tariffs, OPEC+ production, and shifts in oil demand. Despite a small decline on the day, oil prices have posted their strongest weekly performance since June, rising over 6% for the week.
Market and Outlook
Recent price movement reflects concerns about global trade tensions, new tariffs, and their impact on economic growth and energy demand. At the same time, supply risks remain due to geopolitical factors such as potential sanctions on Russian oil and U.S.-China trade developments.
Analyst forecasts for the remainder of 2025 suggest continued volatility, with WTI potentially ranging between $56 and $73 per barrel, influenced by demand, OPEC+ decisions, and geopolitical events.
Quick Facts Table
Feature Detail
Type Light, sweet crude
Benchmark NYMEX (U.S.), major global reference
Main Delivery Point Cushing, Oklahoma
Latest Price (Aug 1, 2025) $69.15–$69.36 per barrel
Typical Drivers U.S. tariffs, OPEC+ decisions, trade policy, supply risks, global demand
WTI oil plays a central role in global energy markets, serving as a benchmark for North American and international oil pricing. Its price reflects both supply fundamentals and broader macroeconomic and geopolitical developments.
#OIL #WTI

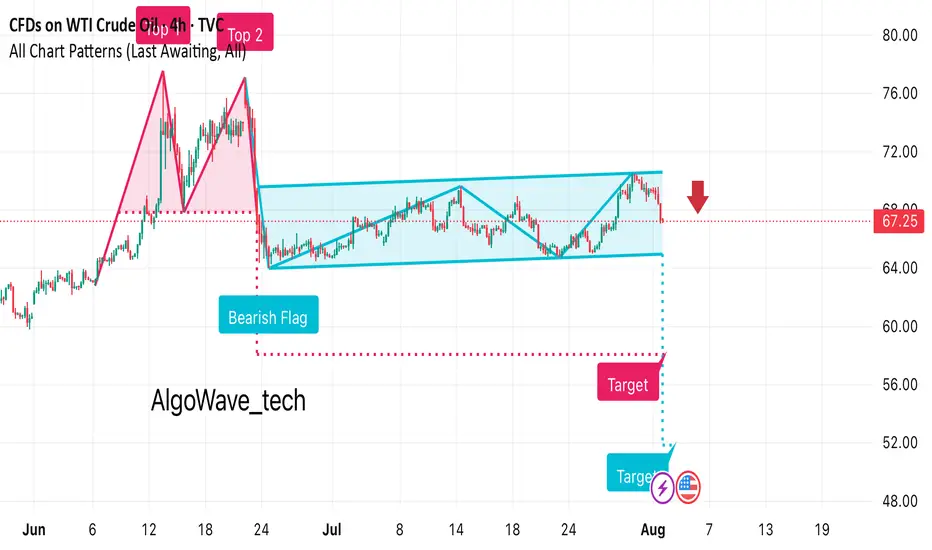
It looks like this chart for WTI Crude Oil is showing a bearish • Previous Move: There’s a strong downward leg before the flag formation, indicating bearish momentum.
• Flag Pattern: Price consolidates in an upward-sloping channel after the drop.
• Breakout: The chart suggests a bearish breakout below the channel, marked with a red arrow at around $67.25.
• Target Projection: The measured move target appears to be around the $53–54 range, based on the flagpole height.
USOIL Bulls Seize a New OpportunityThe EIA crude oil inventory data is scheduled for release today and is expected to have a significant impact on USOIL prices. Based on the previously released API report, there’s a high probability that the EIA data will also be bullish.
From a technical perspective, USOIL is currently showing signs of a potential rebound. Therefore, for traders participating in USOIL today, it may be more favorable to adopt a bullish bias. If managed well around key support levels and timing, the setup could offer attractive profit opportunities.

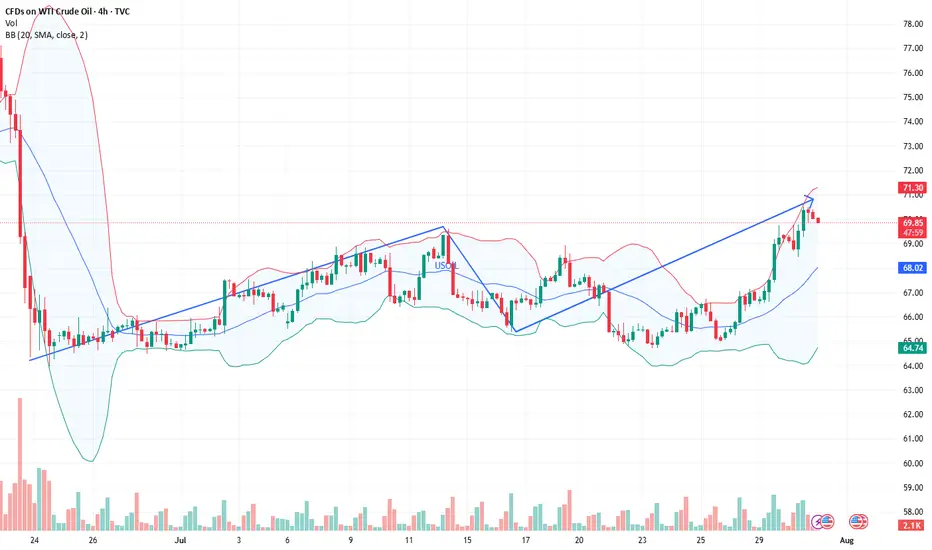
OIL-SELL strategy 6 hourly chart Reg. ChannelOIL has moved up sharply and we are moving beyond the regression channel. This usually will not last especially when overbought status.
Stragtegy SELL @ $ 70.90-71.30 and take profit near 69.37 for now.
Pattern targetIn the previous analysis, we spotted a head and shoulders pattern and mentioned that if it gets activated, it will hit the pattern target — and that’s exactly what happened.
A clean and beautiful setup.
Crude Oil Elliott Waves With the completion of Wave 3, we are now approaching the end of Wave C.4(50% Fibonacci levels of Wave 3).Once Wave 4 is fully formed, a lower low is expected to follow as part of Wave 5.

BUY USOILI'm sharing with you our trade today on OIL.
The reason we're buying is because yesterday the market grabbed the LQ now it is reversing to climb higher to fill all of the FVG we got in the previous movement.
For a safe entry, wait for the price to come back to our entry poin at 65.800 since I myself am waiting for the price to come to our entry point.
Follow for more!

USOIL - watch upWill play down for a long term buy, look the cross zone to find the spot above and entry point below.
Oil Seems to soon drop downOil grand super Cycle suggests a further down move pursuing wave B towards 57.845 or 50.268. However before this great move down, we should see a slight fall to 66.104 or 65.673 the a sudden jump to 69.141 from that level we may see a drop in probably august to the 50.268 or 62.858
Is the surge in crude oil bulls here a comeback?The news-driven support for crude oil's recent rally is almost exhausted, so we'll continue to adopt a buy-low-sell-high strategy today, using a small stop-loss to maximize profits.
Short at $71.20, with a stop-loss at $71.70 and a take-profit at $69.20. (For aggressive shorting, try shorting at $70.95).
The above strategy is Charlie's personal opinion and is for reference only. If you follow suit, please be cautious and use a stop-loss to protect your position. TVC:USOIL FOREXCOM:USOIL TRADU:USOIL TRADU:USOIL
WTI Crude Oil – Range Support in FocusWe're waiting for price to reach the bottom of the range, and with a solid buy signal, we’ll consider going long.
However, since this level has been tested multiple times, it’s highly vulnerable to stop fishing — so caution is key.
As always, we’re ready for all scenarios:
If price breaks below, we’ll wait for a pullback to enter short.
But right now, we’re watching the range support for potential longs
