XTIUSD trade ideas

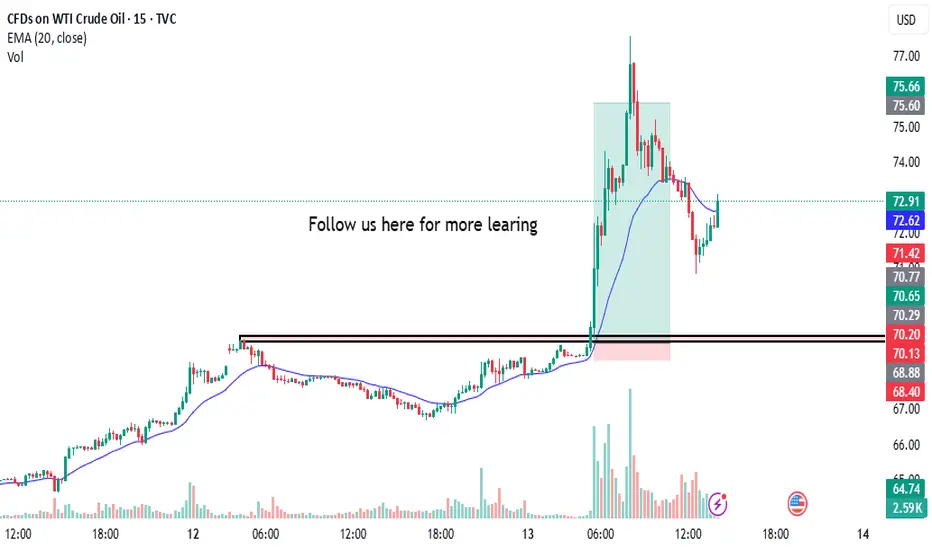
Captures 1:15 in US OIL Today i captures 1:15 in us oil
the annalysis was simple and clean as always i took trade on breakout of zone with proper research & annalysis and booom, as always we got our profit
follow us for more learing here
Iran 🇮🇷 vs Israel 🇮🇱 Oil Rally #USOIL Buy 67.30Iran 🇮🇷 vs Israel 🇮🇱 Oil Rally
#USOIL Buy 67.30
SL 66.70
TP 67.50
TP 68.30
TP 69.70
TP 77.30
TP 87.30
Trade at your own risk
Protect your capital
The Wizard 🧙♂️ SWFX

Oil Price Rally Stalls at $77.72, Just Below 2025 HighFenzoFx—Oil prices resumed their bullish trend, accelerating after geopolitical tensions in the Middle East. The rally paused at $77.72, just below the 2025 high.
RSI 14 indicates an overbought market, while volume accumulation at $73.7 suggests possible sell orders. A consolidation phase is likely before further gains.
If oil pulls back, key demand zones at $64.00 and $66.00 offer bullish opportunities, with a potential move toward the 2025 high at $80.59.

Forget all the narratives and storylines about silver & oil.Forget all the narratives and storylines about silver & oil.
You only need ONE chart to understand the essential.

Oil prices surge amid Middle East turmoil
💡Message Strategy
WTI prices climbed to a nearly two-month high, weighed down by rising geopolitical tensions in the Middle East.
📊Technical aspects
From the daily chart level, crude oil's medium-term trend is upward around the moving average system, and the medium-term objective trend is mainly oscillating upward. Oil prices gradually rise to the upper edge of the range.
From the perspective of momentum, the MACD indicator fast and slow lines cross the zero axis upward, and the bullish momentum begins to warm up. The K line closes with a small positive line continuously. If the oil price breaks through the range resistance in the later period, the medium-term trend is expected to further rise and test the 80 line.
The short-term (4H) trend of crude oil fluctuated upward and hit a new high of 70. The moving average system is arranged in a bullish pattern, and the short-term objective trend direction remains upward. The K-line closed with a large real positive line in the early trading, showing an upward main trend.
The MACD indicator opened upward above the zero axis, and the bullish momentum was dominant. It is expected that the crude oil trend will continue to break upward during the day.
💰 Strategy Package
Long Position:70.00-72.20,Target 75.50

USOIL:Go long
Stay on the long side.
Trading Strategy:
BUY@71.8-72.3
TP: 74-74.3
↓↓↓ More detailed strategies and trading will be notified here ↗↗↗
↓↓↓ Keep updated, come to "get" ↗↗↗

USOIL || Geopolitical Spike Hits Major Resistance - Watch $77.77🛢️
📅 June 13, 2025
👤 By: MJTRADING
🔍 🧭 Fundamental Context – Risk Premium on the Rise:
Crude oil surged sharply today following reports of Israeli airstrikes on Iranian territory — a move that reawakens fears of broader Middle East escalation. Iran plays a crucial role in OPEC and controls the strategic Strait of Hormuz , through which ~20% of global oil passes.
While Iran has not officially responded yet, markets are pricing in the potential for:
* Military retaliation
* Disruption of oil exports or maritime routes
* Heightened volatility across global risk assets
=======================================================
📉 📊 Technical Structure – Tag of Key Resistance at $77.7:
Price exploded upward, piercing the descending channel that's been intact since mid-2022.
Today's daily wick tagged the $77.70 level, a major horizontal resistance and channel top.
This zone has repeatedly acted as a pivot in both bullish and bearish phases.
Volume confirmed the move – highest daily volume in months, suggesting institutional reaction.
💡 Trading Outlook:
🔼 Scenario A – Breakout & Close Above $77.7 = Bull Continuation
If tomorrow closes firmly above $77.70:
Target 1: $88.88 supply zone
Target 2: $90.00 psychological resistance
Setup: Conservative entries on retest of $75–77 area with tight invalidation
🔽 Scenario B – Failed Breakout → Fade Back Inside Channel
If this was a headline-driven spike with no follow-through, bears may re-enter strongly
A close below $75 could confirm bull trap
Support zone to watch: $66.66 (mid-channel, EMA confluence)
⚠️ Risk Factors to Monitor:
Iran’s response (military, diplomatic, strategic)
US/NATO reaction to potential escalation
Strait of Hormuz disruption
OPEC commentary or Saudi-led output adjustment
Market sentiment unwind (profit-taking from overbought spike)
💬 Markets love emotion, but traders survive with structure. This is not the time to be reckless — size down, be responsive, and respect both breakouts and fakeouts.
📎 #CrudeOil #Geopolitics #OilSpike #WTI #MiddleEastTensions #Iran #IranIsrael #TechnicalAnalysis #MJTRADING

WTI MONTLY OUTLOOK! PRICE MIGHT EXPLODE!!Crude futures rose on demand as we saw price climb $73 per barrel as the time of publishing this report. Looking at the price action from the monthly chart, we’re seeing a possible bullish price action to continue after price found a new low around the $56 level.
Technically, we’re also seeing a morning star candlestick pattern which indicates a bullish reversal.

USOIL:Go long
USOIL:Crude oil rose sharply under the tension in the Middle East, the early repeatedly suggested that the continuous low shock after the upward breakthrough, the time of storage force is long enough, especially the watershed 64.8 break after the rising space has been opened, the trading idea is still to step back and do long.
Trading Strategy:
BUY@66.9-67.2
TP: 68.6-69
↓↓↓ More detailed strategies and trading will be notified here ↗↗↗
↓↓↓ Keep updated, come to "get" ↗↗↗

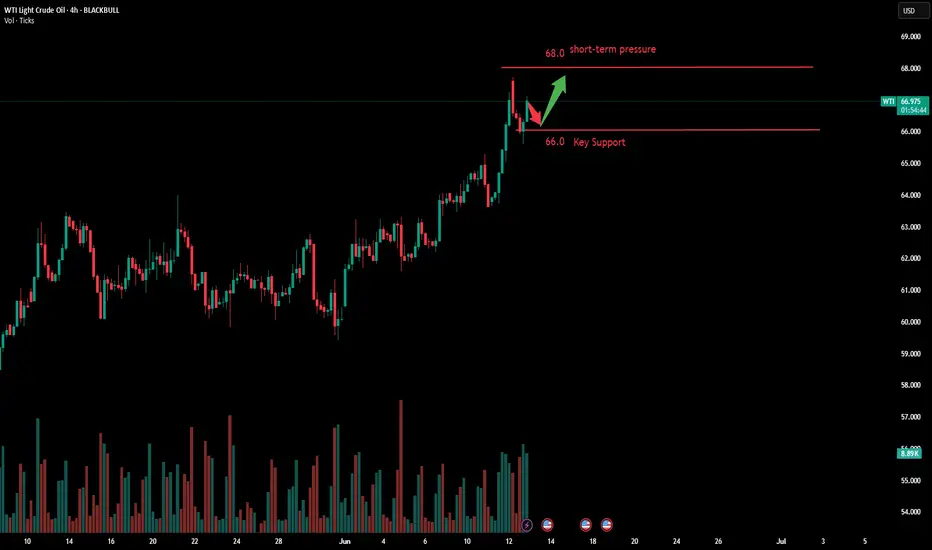
wti looking for reversalSwing trade
Wti looking for reversal 3 Major bull points
Trend reversal
Rsi divergence
Reversal chart pattern Head and shoulder
Manage your risk before putting trade on real account

WTI Oil D1 | Potential bounce off a pullback supportWTI oil (USOIL) is falling towards a pullback support and could potentially bounce off this level to climb higher.
Buy entry is at 73.17 which is a pullback support that aligns with the 23.6% Fibonacci retracement.
Stop loss is at 70.50 which is a level that lies underneath a a pullback support and the 38.2% Fibonacci retracement.
Take profit is at 78.07 which is a a pullback resistance.
High Risk Investment Warning
Trading Forex/CFDs on margin carries a high level of risk and may not be suitable for all investors. Leverage can work against you.
Stratos Markets Limited (tradu.com ):
CFDs are complex instruments and come with a high risk of losing money rapidly due to leverage. 63% of retail investor accounts lose money when trading CFDs with this provider. You should consider whether you understand how CFDs work and whether you can afford to take the high risk of losing your money.
Stratos Europe Ltd (tradu.com ):
CFDs are complex instruments and come with a high risk of losing money rapidly due to leverage. 63% of retail investor accounts lose money when trading CFDs with this provider. You should consider whether you understand how CFDs work and whether you can afford to take the high risk of losing your money.
Stratos Global LLC (tradu.com ):
Losses can exceed deposits.
Please be advised that the information presented on TradingView is provided to Tradu (‘Company’, ‘we’) by a third-party provider (‘TFA Global Pte Ltd’). Please be reminded that you are solely responsible for the trading decisions on your account. There is a very high degree of risk involved in trading. Any information and/or content is intended entirely for research, educational and informational purposes only and does not constitute investment or consultation advice or investment strategy. The information is not tailored to the investment needs of any specific person and therefore does not involve a consideration of any of the investment objectives, financial situation or needs of any viewer that may receive it. Kindly also note that past performance is not a reliable indicator of future results. Actual results may differ materially from those anticipated in forward-looking or past performance statements. We assume no liability as to the accuracy or completeness of any of the information and/or content provided herein and the Company cannot be held responsible for any omission, mistake nor for any loss or damage including without limitation to any loss of profit which may arise from reliance on any information supplied by TFA Global Pte Ltd.
The speaker(s) is neither an employee, agent nor representative of Tradu and is therefore acting independently. The opinions given are their own, constitute general market commentary, and do not constitute the opinion or advice of Tradu or any form of personal or investment advice. Tradu neither endorses nor guarantees offerings of third-party speakers, nor is Tradu responsible for the content, veracity or opinions of third-party speakers, presenters or participants.

Oil sellNow is key level 64.7 if break it down more fall.After all news FA for me show more bearish trend.

USOIL CRACK!Usually, these types of events are great selling opportunities as they are short-lived. However, this time may be different.
I would expect a pullback then if it lasts and escalates a breakout. For now, just observe, have patience, and look for the 2nd crack!
If it cracks a 2nd time, it is definitely not good for US inflation.

US OIL 🛢️ USOIL Trade Plan – Based on Dow Theory (4H TF)
📌 Bias: Buy / Long
Dow Theory shows Higher Highs (HH) and Higher Lows (HL) structure on the 4H — indicating an uptrend
SL TP marked in Chart / Entry Instant or buy near CMP
Bullish momentum remains robust.International oil prices surged then pulled back. Brent crude oil futures fell 47 cents to $69.40 per barrel, while U.S. West Texas Intermediate (WTI) dropped 33 cents to $67.84. In the previous session, both Brent and WTI recorded over 4% gains, hitting their highest levels since early April.
On Wednesday, U.S. President Trump stated that the U.S. is withdrawing some personnel from the Middle East due to the region's potential danger, reiterating that Iran will not be allowed to develop nuclear weapons. Meanwhile, market surveys showed the U.S. is preparing partial evacuations of personnel from its embassy in Iraq and allowing family members in Bahrain and other areas to leave. U.S. and Iraqi sources revealed the move primarily stems from heightened security risks in the region.
Current upward momentum in the oil market is driven by dual factors: geopolitical tensions in the Middle East and unexpected declines in U.S. inventories. In the short term, as long as tensions between Iran and the U.S. show no signs of easing, the market will continue to monitor potential supply disruption risks. Additionally, the alleviation of trade concerns and global economic recovery expectations will provide strong long-term support for oil prices. However, risks of sharp volatility from sudden deterioration in geopolitical situations should be vigilantly monitored.
With moving averages diverging upward, the short-term objective trend is clearly established as bullish. It is expected that crude oil prices will continue to rise and hit new highs.
Humans need to breathe, and perfect trading is like breathing—maintaining flexibility without needing to trade every market swing. The secret to profitable trading lies in implementing simple rules: repeating simple tasks consistently and enforcing them strictly over the long term.
Trading Strategy:
buy@65.5.0-66.0
TP:67.5-68.0
SELL TRADE IDEA Entry Point: 68.30SELL TRADE IDEA
Entry Point: 68.30
🔻 Initiating a SELL position on USOIL
🔍 Bearish trend forming – short-term weakness spotted
🎯 Final Target: 64.50
📉 Room for downside movement
📊 Following resistance rejection and trend signals
🛑 Risk Management Comes First
📌 Always set a stop-loss before entering
💼 Risk only what you can afford to lose
🔒 Protect your capital – it’s your trading fuel
🧠 Emotionless trading wins over time
📈 Adjust lot size to match account risk plan
⚠️ Oil markets can move fast – stay alert
⏱ Timeframe: Intraday to short-term swing
🚫 Avoid revenge trading – trust your setup
🔁 Re-evaluate if structure changes
🔧 Use trailing stops once in profit
💬 Smart trades are protected trades
#USOIL #CrudeOil #SellSignal #Commodities #RiskManagement #OilTrade

US OIL Bullish Move is coming?Hi Traders.
MTF Correctional Structure but it seems that this is
not a correction to go further down instead a correction to reverse.
We see a clear Inverse HnS Pattern
Breakout and correction is forming
Wait for the current correction to finish to confirm
this bullish setup

WTI OIL Massive rejection on the 1D MA200.WTI Oil (USOIL) has been trading within a Channel Down for over a year now and today its latest Bullish Leg hit the 1D MA200 (orange trend-line) for the first time since February 03 2025.
Unless we see a sustainable structured rise that turns it into a Support, the long-term bearish trend should prevail, and the market has already reacted to this with a strong rejection.
With the 1D RSI almost overbought (>70.00), being consistent with the last 3 major tops, we expect a gradual decline towards Support 1, as it happened on the January - February 2025 Bearish Leg.
Our Target is just above it at $55.50.
-------------------------------------------------------------------------------
** Please LIKE 👍, FOLLOW ✅, SHARE 🙌 and COMMENT ✍ if you enjoy this idea! Also share your ideas and charts in the comments section below! This is best way to keep it relevant, support us, keep the content here free and allow the idea to reach as many people as possible. **
-------------------------------------------------------------------------------
💸💸💸💸💸💸
👇 👇 👇 👇 👇 👇

Crude Oil Eyes 65.40 Support Amid Middle East Uncertainty!!Hey Traders,
In today’s trading session, we’re closely monitoring USOIL for a potential buying opportunity around the 65.40 zone. The commodity remains in an overall uptrend, and is currently undergoing a corrective phase, approaching a key support/resistance area near 65.40. This level aligns well with the broader trend structure and may offer a favorable risk-to-reward setup.
On the fundamental side, geopolitical tensions are on the rise. Reports indicate that U.S. embassy personnel are being evacuated from parts of the Middle East amid growing regional instability. Allegedly, Israel is preparing for potential military action against Iran should nuclear deal talks collapse.
If these tensions escalate further into military conflict, oil prices could spike in response to the heightened risk to regional supply chains.
Trade safe,
Joe

CRUDE OIL (WTI): Pullback From Key Level
WTI Crude Oil looks overbought after a test of key daily horizontal resistance level.
A violation of a minor horizontal support on an hourly time frame after its test
provides a strong intraday confirmation.
I expect a retracement to 66.33 level.
❤️Please, support my work with like, thank you!❤️

WTI Oil H4 | Potential bullish bounceWTI oil (USOIL) is falling towards a pullback support and could potentially bounce off this level to climb higher.
Buy entry is at 66.44 which is a pullback support.
Stop loss is at 64.25 which is a level that lies underneath an overlap support and the 50% Fibonacci retracement.
Take profit is at 69.11 which is a pullback resistance.
High Risk Investment Warning
Trading Forex/CFDs on margin carries a high level of risk and may not be suitable for all investors. Leverage can work against you.
Stratos Markets Limited (tradu.com ):
CFDs are complex instruments and come with a high risk of losing money rapidly due to leverage. 63% of retail investor accounts lose money when trading CFDs with this provider. You should consider whether you understand how CFDs work and whether you can afford to take the high risk of losing your money.
Stratos Europe Ltd (tradu.com ):
CFDs are complex instruments and come with a high risk of losing money rapidly due to leverage. 63% of retail investor accounts lose money when trading CFDs with this provider. You should consider whether you understand how CFDs work and whether you can afford to take the high risk of losing your money.
Stratos Global LLC (tradu.com ):
Losses can exceed deposits.
Please be advised that the information presented on TradingView is provided to Tradu (‘Company’, ‘we’) by a third-party provider (‘TFA Global Pte Ltd’). Please be reminded that you are solely responsible for the trading decisions on your account. There is a very high degree of risk involved in trading. Any information and/or content is intended entirely for research, educational and informational purposes only and does not constitute investment or consultation advice or investment strategy. The information is not tailored to the investment needs of any specific person and therefore does not involve a consideration of any of the investment objectives, financial situation or needs of any viewer that may receive it. Kindly also note that past performance is not a reliable indicator of future results. Actual results may differ materially from those anticipated in forward-looking or past performance statements. We assume no liability as to the accuracy or completeness of any of the information and/or content provided herein and the Company cannot be held responsible for any omission, mistake nor for any loss or damage including without limitation to any loss of profit which may arise from reliance on any information supplied by TFA Global Pte Ltd.
The speaker(s) is neither an employee, agent nor representative of Tradu and is therefore acting independently. The opinions given are their own, constitute general market commentary, and do not constitute the opinion or advice of Tradu or any form of personal or investment advice. Tradu neither endorses nor guarantees offerings of third-party speakers, nor is Tradu responsible for the content, veracity or opinions of third-party speakers, presenters or participants.

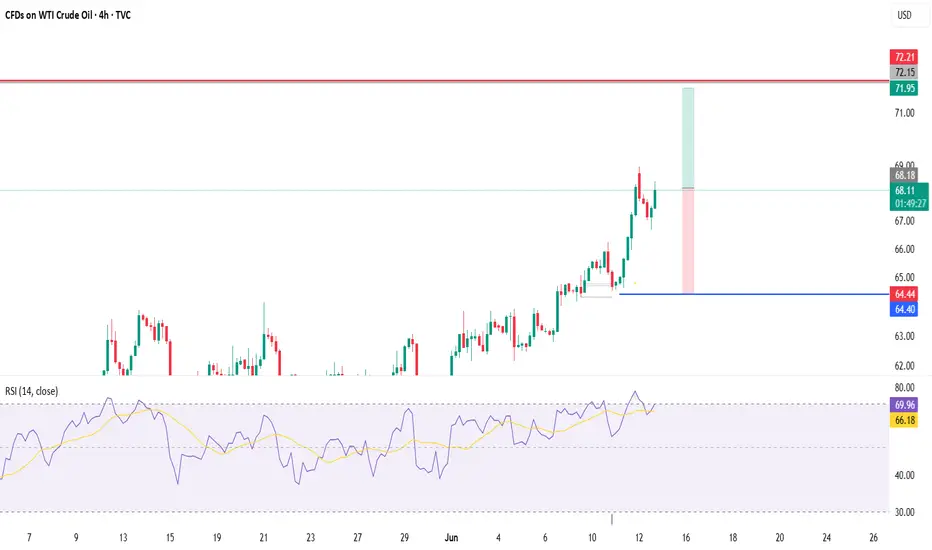
USOIL SELL 70.00On the daily chart, USOIL stabilized and rebounded, and short-term bulls have the upper hand. At present, the resistance around 70.00 can be paid attention to, which is the short position of the potential bearish bat pattern, and the position is the pressure of the integer mark.
