How long can the decline in US crude oil prices last?
💡Message Strategy
On Monday (August 4) during the Asia-Europe session, WTI fell for three consecutive days, with a drop of 1.16% today, trading around 66.55. OPEC+'s decision to increase production, coupled with geopolitical and economic policies, has jointly formed the expectation that oil prices will be "weak and volatile, dominated by downward pressure."
Short-Term: Increased Supply Drives Price Decline
OPEC+'s decision to increase production directly led to further declines in oil prices on Monday (Brent crude fell 0.28% to $69.23/barrel, and WTI fell 0.46% to $67.01/barrel), extending Friday's decline. Market expectations of oversupply reinforced bearish sentiment, particularly as the UAE's additional production increase (accounting for 2.4% of global demand) further amplified the signal of easing supply. However, India's announcement to continue purchasing Russian crude oil partially offset the impact, limiting the price decline and failing to shift the short-term downward trend.
Medium-Term: Supply-Demand and Policy Risks Intertwine
On the Supply Side: OPEC+'s production increase plan may be paused after September, as Goldman Sachs anticipates accelerated OECD inventory accumulation and fading seasonal demand support. However, if US shale oil production is forced to cut production at break-even points due to low oil prices, OPEC+ may adjust its strategy and even consider further releasing the remaining 1.66 million barrels/day of production capacity, which would continue to suppress oil prices.
Long-Term: Market Share Competition and Structural Overcapacity
OPEC+'s production increase strategy aims to reshape the global oil landscape by squeezing out high-cost producers, such as US shale oil, through low prices. Due to rising equipment costs driven by tariffs and low oil prices, US shale oil companies have cut capital expenditures, resulting in a decline in the number of active drilling rigs and a slowdown in production growth. This strategic game is likely to keep oil prices in a low range for a long time, with significant long-term downward pressure. Unity within OPEC+ and coordination between Saudi Arabia and the UAE will be key to policy implementation.
📊Technical aspects
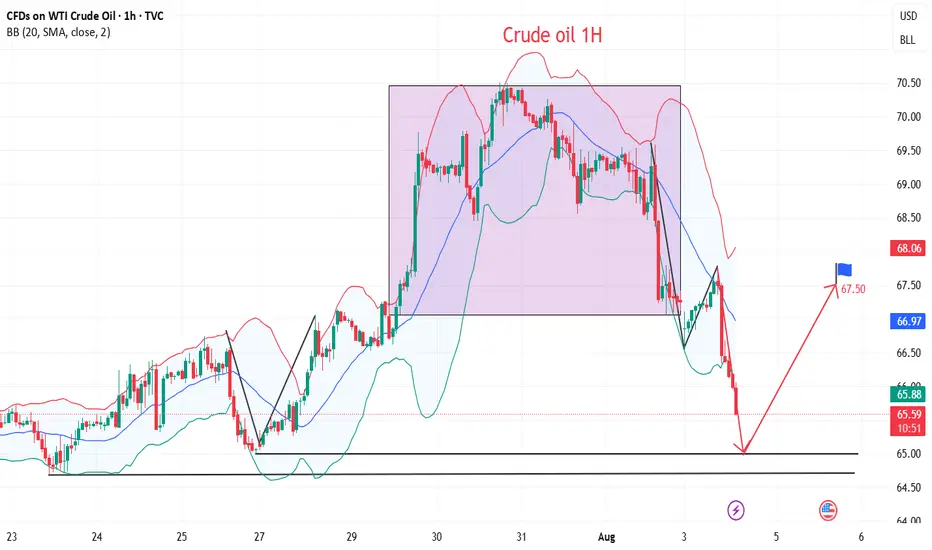
Crude oil's short-term (1H) trend has reversed downward from its highs. The moving averages are diverging and aligning downward, indicating a downward trend in the short term.
The K-line chart has continued to close with small real bodies, and the MACD indicator is about to form a golden cross near the zero axis, signaling weakening downward momentum and a bullish bias on pullbacks. Crude oil is expected to remain weak and downward today, with a potential correction near $65.00.
XTIUSD trade ideas
TP REACHED ON OUR TRADE ON OILEarly this morning I posted to sell on OIL, now here I am with the results of the price reaching our TP.
Our entry was based on a reversal and a FVG as you can see on the chart, target was the previous low which the market exactly reached.
Follow for more!

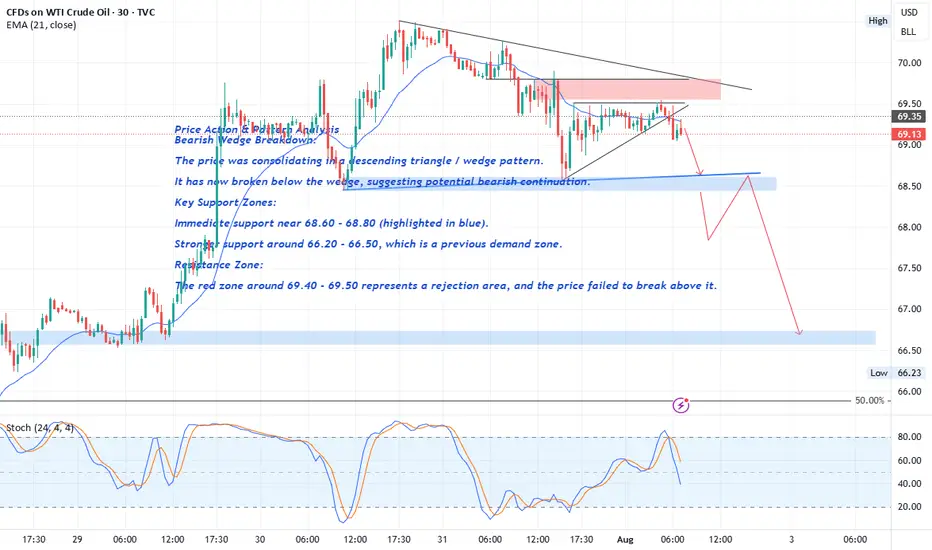
Crude Oil Price Action & Pattern Analysis
Bearish Wedge Breakdown:
The price was consolidating in a descending triangle / wedge pattern.
It has now broken below the wedge, suggesting potential bearish continuation.
Key Support Zones:
Immediate support near 68.60 - 68.80 (highlighted in blue).
FOREXCOM:USOIL
The break of the 68.60 level with a strong bearish candle would serve as confirmation of a Head and Shoulders (H&S) pattern , with solid bearish implications.
Stronger support around 66.20 - 66.50 , which is a previous demand zone.
Resistance Zone:
The red zone around 69.40 - 69.50 represents a rejection area , and the price failed to break above it.
HHarami about to close in 30 minutes with macd and rsi divergence 1-4 hr 😅 tough luck if you're shorting after a 10% fall 😅

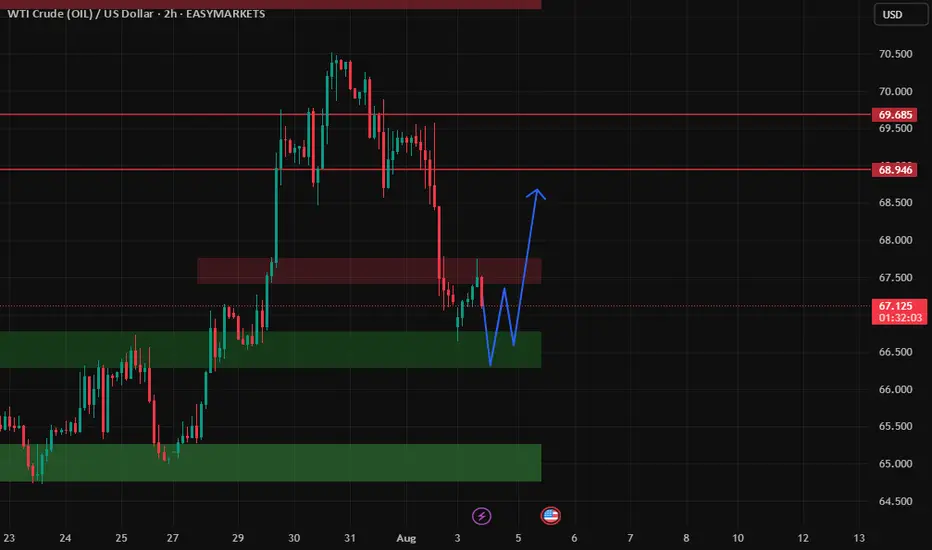
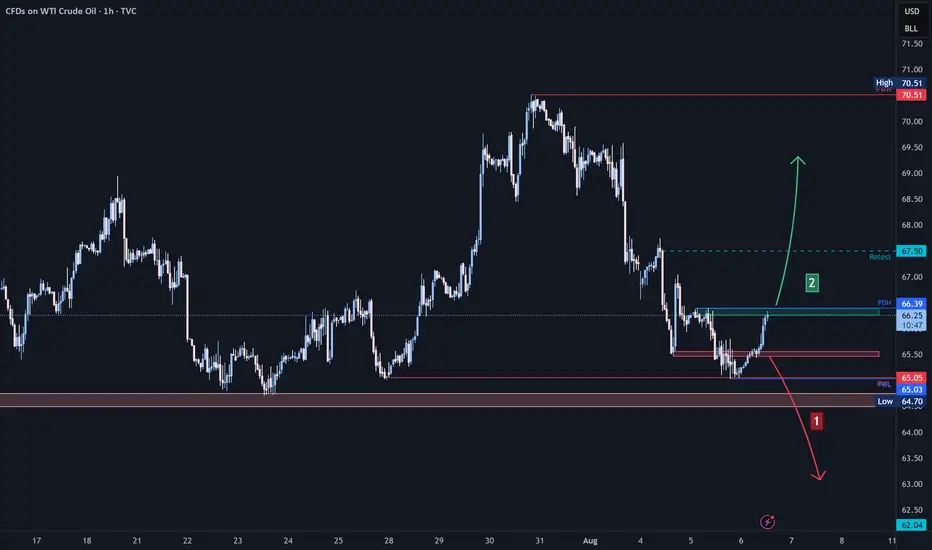
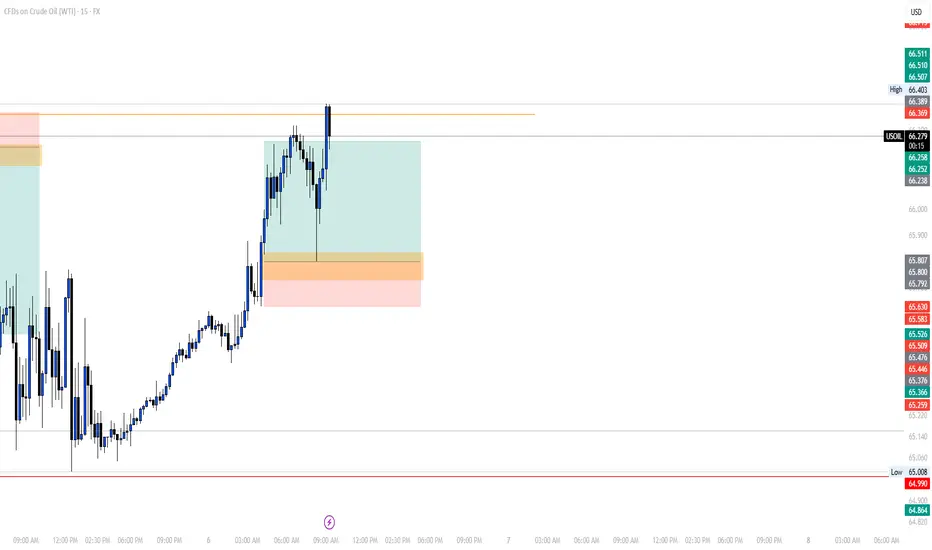
Crude Oil Analysis (WTI / USOIL):Crude oil is currently trading near a key resistance area around $66.30.
🔻 Bearish Scenario:
A break and close below $65.50 may lead to a decline toward the next major support at $64.50.
🔺 Bullish Scenario:
If the price breaks back above $66.35 and holds, we may see a retest of the $66.90 zone.
📈 Continued bullish momentum could drive the price toward $67.50.
⚠️ Disclaimer:
This analysis is not financial advice. It is recommended to monitor the markets and carefully analyze the data before making any investment decisions.
Wait for a surge in oil price to around 120$Taking into account the price action specially in the daily timeframe that an inverse head and shoulders pattern are visible and the strong weekly support and taking into account the escalation of conflicts and war in the middle east, it's non of a surprise to see a 120$ oil price in a matter of some weeks or months.

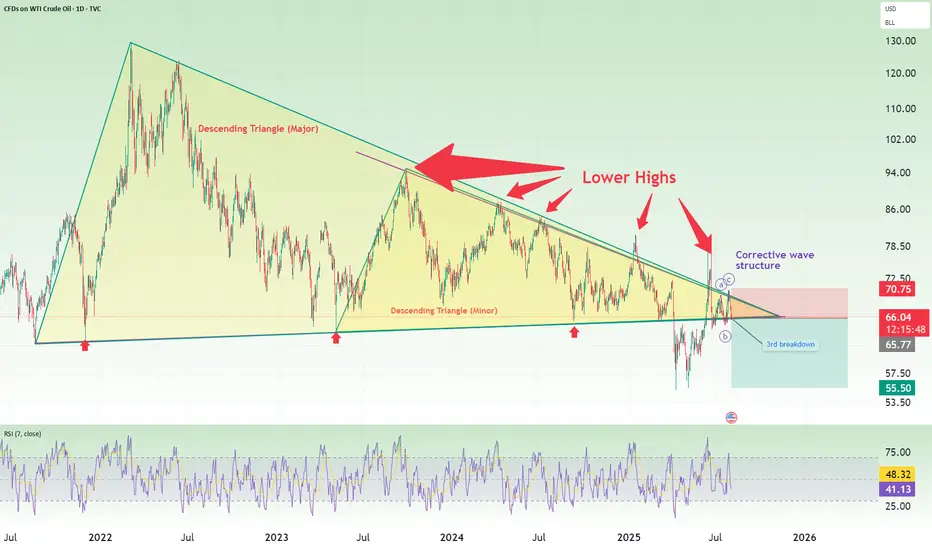
Oil short: breakdown from triangle againThis idea is backed by my general view that the stock market is going to crash in August. what this means is that we are going into a risk-off environment and there will be reduced consumption and demand for oil too.
Technically, I pointed out 4 things in this chart:
1. Descending triangles
2. Lower highs
3. 3rd breakdown (after a false break to the upside)
4. A corrective wave structure
Good luck!
WTI: downside potentialHi traders and investors!
This analysis is based on the Initiative Analysis concept (IA).
Weekly timeframe
A buyer initiative is tentatively developing, yet the strongest buyer candle (highest volume) produced no follow-through. It was followed by two buyer candles on weak volume. Last week volume expanded again and clustered around 69.975, showing that sellers are still defending this level. Weekly seller targets: 65.628 and 64.378.
Daily timeframe
Sellers remain in control. The chart clearly shows volume manipulation around 69.975. Daily seller targets: 65.628 and 64.736.
Wishing you profitable trades!

USOIL REACHED THE 6,900.00 SUPPORT LEVEL. WHAT'S NEXT?USOIL REACHED THE 6,900.00 SUPPORT LEVEL. WHAT'S NEXT?
As we told July 31, the price got reversed towards first support level of 6,900.00. Market participants are waiting for the OPEC+ meeting this week, expecting a significant output hike. Currently, the price sits slightly above the support level. Although, the asset trades above this level, considering the current weakness of the asset, further decline is expected. The 6,800.00 support level is the next target here.

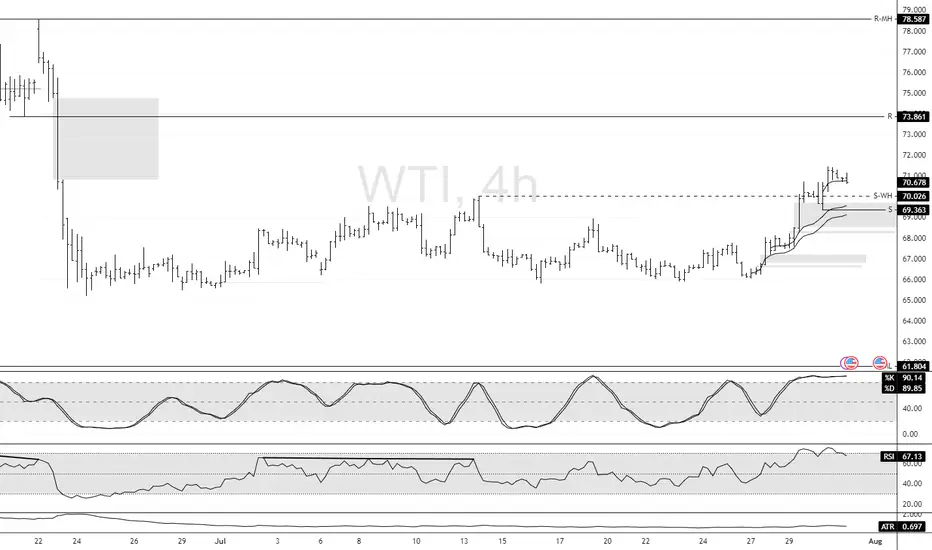
Crude Oil: Buying Pressure StrengthensFenzoFx—Crude Oil maintained its bullish trend with an ideal dip for entry on July 25. Stochastic and RSI 14 indicate overbought conditions, suggesting intensified buying pressure. A breakout seen yesterday reinforces the bullish bias.
Our projection remains optimistic, targeting a move toward the Fair Value Gap zone, extending to $73.8. However, if Oil closes below the $69.3 support, the bullish outlook will be invalidated.
USOIL IS GOING BULLISH. FOR HOW LONG?USOIL IS GOING BULLISH. FOR HOW LONG?
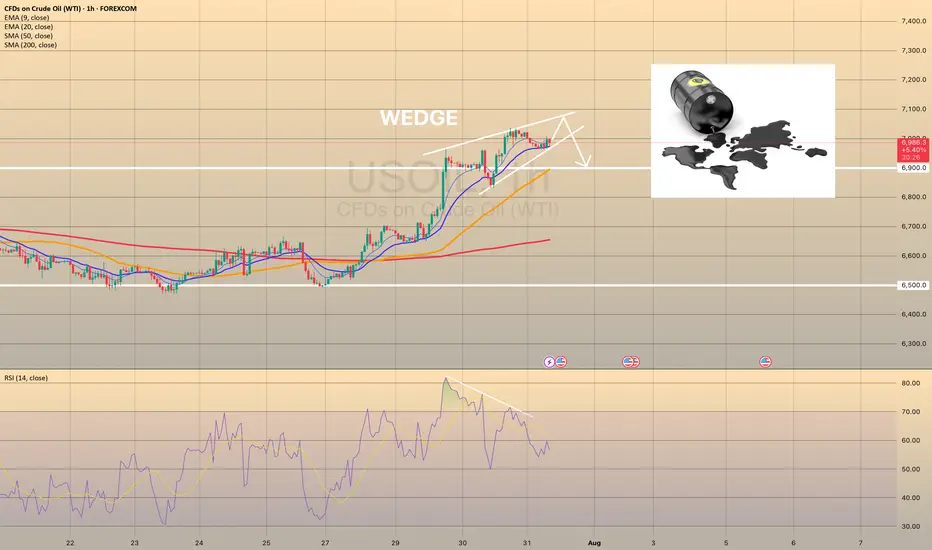
Brent has started this week with a strong bullish momentum and holds near 6-week high on supply fears. President Trump announced plans to impose tariffs on Indian exports and penalize its Russian oil imports. In a parallel move, the US introduced its most extensive sanctions on Iran in seven years. The United States has even offered its oil to the world in exchange for Iranian and Russian oil, but there is evidence that the US production capacity is now at historic highs and is unlikely to grow in the near future.
However, technically oil shows us bearish divergence on RSI and bearish wedge here. The price may reverse towards 6,900.00 as a first target. EIA data showed US crude inventories jumped by 7.7 million barrels last week—the largest increase in six months and defying forecasts for a decline. Market participants are waiting for the OPEC+ meeting this week, expecting a significant output hike.
TRADE CANCELEDThis morning I posted to take a long trade and we canceled it since the price didn't come to our entry point which is a normal thing to happen, now after that it took the daily LQ, we'll be waiting for the price to give us a sort entry to take.
Follow for more!
Bullish bounce off pullback support?WTI Oil (XTI/USD) is falling towards the pivot, which has been identified as a pullback support and could bounce to the 1st resistance.
Pivot: 63.78
1st Support: 59.94
1st Resistance: 69.26
Risk Warning:
Trading Forex and CFDs carries a high level of risk to your capital and you should only trade with money you can afford to lose. Trading Forex and CFDs may not be suitable for all investors, so please ensure that you fully understand the risks involved and seek independent advice if necessary.
Disclaimer:
The above opinions given constitute general market commentary, and do not constitute the opinion or advice of IC Markets or any form of personal or investment advice.
Any opinions, news, research, analyses, prices, other information, or links to third-party sites contained on this website are provided on an "as-is" basis, are intended only to be informative, is not an advice nor a recommendation, nor research, or a record of our trading prices, or an offer of, or solicitation for a transaction in any financial instrument and thus should not be treated as such. The information provided does not involve any specific investment objectives, financial situation and needs of any specific person who may receive it. Please be aware, that past performance is not a reliable indicator of future performance and/or results. Past Performance or Forward-looking scenarios based upon the reasonable beliefs of the third-party provider are not a guarantee of future performance. Actual results may differ materially from those anticipated in forward-looking or past performance statements. IC Markets makes no representation or warranty and assumes no liability as to the accuracy or completeness of the information provided, nor any loss arising from any investment based on a recommendation, forecast or any information supplied by any third-party.

Market Analysis: Oil Prices Ease – Market Awaits Fresh CatalystMarket Analysis: Oil Prices Ease – Market Awaits Fresh Catalyst
WTI crude oil is also down and remains at risk of more losses below $64.60.
Important Takeaways for WTI Crude Oil Price Analysis Today
- WTI crude oil price continued to decline below the $66.00 support zone.
- It traded below a connecting bullish trend line with support at $65.60 on the hourly chart of XTI/USD at FXOpen.
WTI Crude Oil Price Technical Analysis
On the hourly chart of WTI crude oil at FXOpen, the price struggled to continue higher above $67.50. The price formed a short-term top and started a fresh decline below $66.00.
There was a steady decline below the $65.80 pivot level. The bears even pushed the price below $65.00 and the 50-hour simple moving average. The price traded below a connecting bullish trend line with support at $65.60.
Finally, the price tested the $64.75 zone. The recent swing low was formed near $64.73, and the price is now consolidating losses. On the upside, immediate resistance is near the $65.60 zone. It is close to the 50% Fib retracement level of the downward move from the $66.42 swing high to the $64.73 low.
The main resistance is $65.80. A clear move above it could send the price towards $66.40. The next key resistance is near $67.50. If the price climbs further higher, it could face resistance near $70.00. Any more gains might send the price towards the $72.00 level.
Immediate support is near the $64.60 level. The next major support on the WTI crude oil chart is near $63.20. If there is a downside break, the price might decline towards $60.00. Any more losses may perhaps open the doors for a move toward the $55.00 support zone.
This article represents the opinion of the Companies operating under the FXOpen brand only. It is not to be construed as an offer, solicitation, or recommendation with respect to products and services provided by the Companies operating under the FXOpen brand, nor is it to be considered financial advice.

XTIUSD broke the trendline resistance likely will go to 70 XTIUSD has broken the trendline resistance and the price may move to 0.5 fib level of recent swing. let us see.

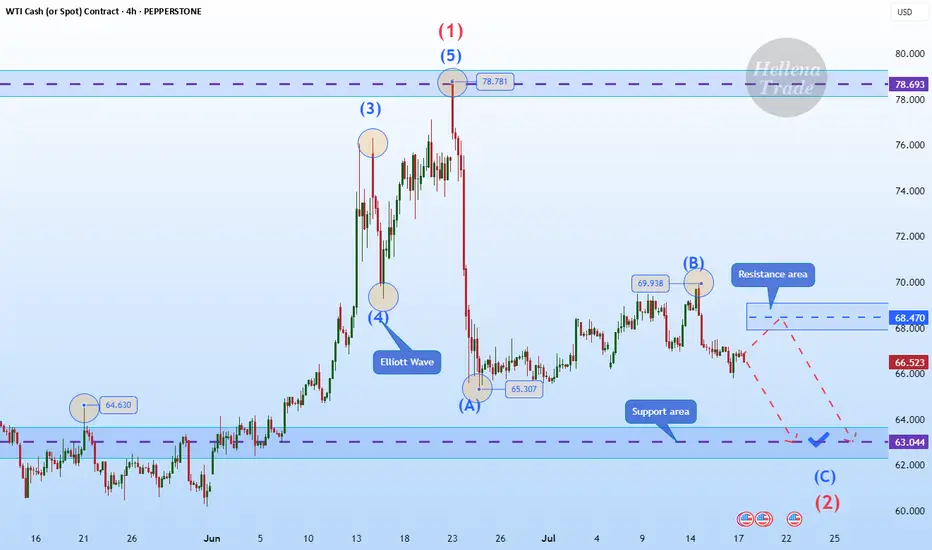
Hellena | Oil (4H): SHORT to support area of 63.000.Colleagues, I believe that wave “B” has formed at the level of 69.938, and now we expect the downward movement to continue with the aim of completing wave ‘C’ of the middle order and wave “2” of the higher order in the support area of 63,000.
It is quite possible that the price could reach the 60,000 level, but I think that for now it is worth focusing on the nearest targets.
Manage your capital correctly and competently! Only enter trades based on reliable patterns!
WTI OIL The federal funds rate is the interest rate at which U.S. banks and credit unions lend their excess reserve balances to other banks overnight, usually on an uncollateralized basis. This rate is set as a target range by the Federal Open Market Committee (FOMC), which is the policymaking arm of the Federal Reserve. The current target range as of July 2025 is approximately 4.25% to 4.5%.
The federal funds rate is a key benchmark that influences broader interest rates across the economy, including loans, credit cards, and mortgages. When the Fed changes this rate, it indirectly affects borrowing costs for consumers and businesses. For example, increasing the rate makes borrowing more expensive and tends to slow down economic activity to control inflation, while lowering the rate stimulates growth by making credit cheaper.
The Fed adjusts this rate based on economic conditions aiming to maintain stable prices and maximum employment. It is a vital tool of U.S. monetary policy, impacting economic growth, inflation, and financial markets.
In summary:
It is the overnight lending rate between banks for reserve balances.
It is set as a target range by the Federal Reserve's FOMC.
It influences many other interest rates in the economy.
Current range (July 2025) is about 4.25% to 4.5%.
1. ADP Non-Farm Employment Change (Forecast: +82K, Previous: -33K)
Above Forecast:
If ADP employment is much stronger than expected, the Fed would see this as a sign of ongoing labor market resilience. Robust job growth would support consumer spending, potentially keep wage pressures elevated, and could make the Fed less likely to ease policy soon. This reinforces the case for holding rates steady or staying data-dependent on further cuts.
Below Forecast or Negative:
If ADP jobs gain falls short or is negative again, the Fed may interpret it as a weakening labor market, raising recession risk and reducing inflationary wage pressures. This outcome could increase the chances of a future rate cut or prompt a more dovish tone, provided it aligns with other softening indicators.
2. Advance GDP q/q (Forecast: +2.4%, Previous: -0.5%)
Above Forecast:
A GDP print above 2.4% signals surprisingly strong economic growth and likely sustains the Fed’s view that the U.S. economy is avoiding recession. The Fed may delay rate cuts or take a more cautious approach, as stronger growth can support higher inflation or at least reduce the urgency for support.
Below Forecast or Negative:
Weak GDP—especially if close to zero or negative—would signal that the economy remains at risk of stagnation or recession. The Fed may then pivot to a more dovish stance, become more willing to cut rates, or accelerate discussions on easing to avoid a downturn.
3. Advance GDP Price Index q/q (Forecast: 2.3%, Previous: 3.8%)
Above Forecast:
A significantly higher-than-expected GDP Price Index (an inflation measure) points to persistent or resurgent inflationary pressures in the economy. The Fed might see this as a reason to delay cuts or maintain restrictive rates for longer.
Below Forecast:
If the Price Index prints well below 2.3%, it suggests that inflation is cooling faster than anticipated. This outcome could allow the Fed to move toward easing policy if other conditions warrant, as price stability is more clearly in hand.
Bottom Line Table: Data Surprises and Likely Fed Reaction
Data Surprise Fed Outlook/Action
All above forecast Hawkish bias, rate cuts delayed or on hold
All below forecast Dovish bias, higher chances of rate cut
Mixed Data-dependent, further confirmation needed
Summary:
The Fed’s interpretation hinges on how these figures compare to forecasts and to each other. Stronger growth, jobs, and inflation = less rush to cut; weaker numbers = lower rates sooner. If growth or jobs are especially weak or inflation falls sharply, expect more dovish Fed commentary and a greater likelihood of future easing. Conversely, if the data all surprise to the upside, hawkish (rate-hold) messaging is likely to persist.
The U.S. Dollar Index (DXY) is a financial benchmark that measures the value of the United States dollar relative to a basket of six major foreign currencies. It provides a weighted average reflecting the dollar's strength or weakness against these currencies. The DXY is widely used by traders, investors, and economists to gauge the overall performance and health of the U.S. dollar on the global stage.
Key Features of the DXY:
Currencies included and their weights:
Euro (EUR) – 57.6%
Japanese Yen (JPY) – 13.6%
British Pound (GBP) – 11.9%
Canadian Dollar (CAD) – 9.1%
Swedish Krona (SEK) – 4.2%
Swiss Franc (CHF) – 3.6%
It was established in 1973 after the collapse of the Bretton Woods system to serve as a dynamic measure of the dollar's value.
The index reflects changes in the exchange rates of theses versus the U.S. dollar, with a higher DXY indicating a stronger dollar.
The DXY influences global trade dynamics, commodity prices (like oil and gold)
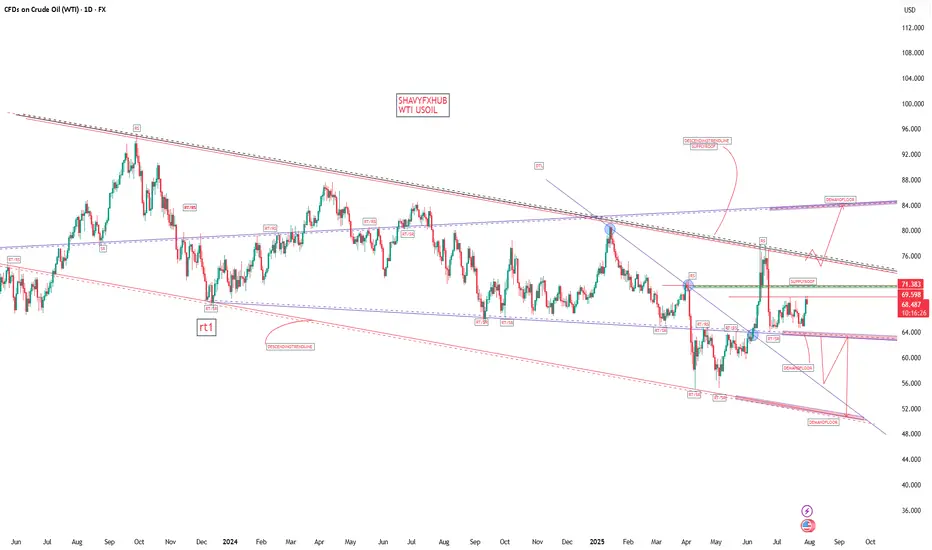
#SHAVYFXHUB #USOIL #WTI #OIL
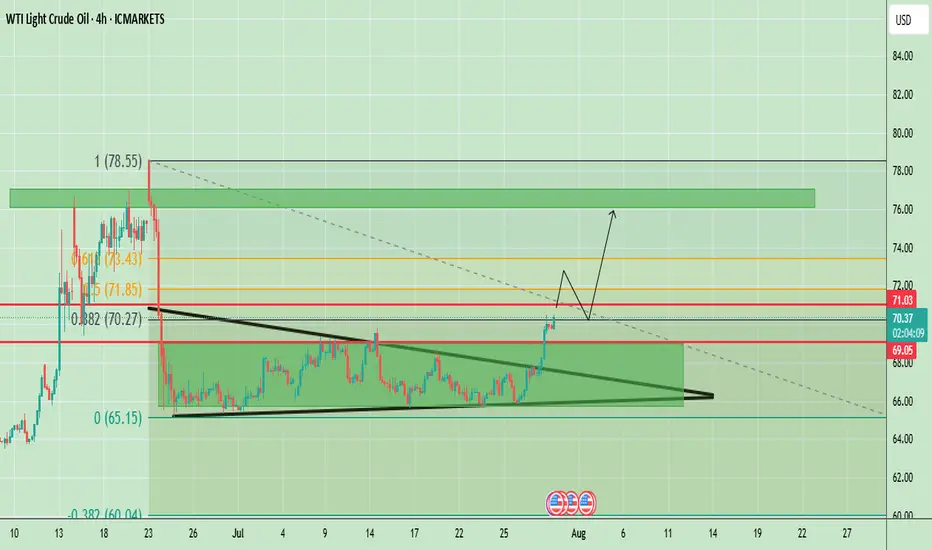
WTI Crude Oil Breaks Out of Symmetrical Triangle, $73-$76 ZoneThe WTI Crude Oil chart shows a strong breakout from the symmetrical triangle pattern that was forming for several weeks. Price has decisively broken above the descending resistance trendline and is now testing the $70–$71 area, which aligns with the 0.382 Fibonacci retracement level (around $70.27) and an important horizontal resistance ($71.03). This breakout indicates strong bullish momentum, supported by the recent series of higher lows and a sharp upward move in recent sessions.
If price sustains above $69.05 (previous breakout zone), we could see a bullish continuation towards $73.40 (0.118 Fibonacci) and potentially to $76.00–$76.50, which is the upper resistance block marked on the chart. However, if the price fails to hold above $69.00, there could be a pullback to retest the broken triangle resistance around $67–$68 before any next bullish leg.
Weekly Chart
The weekly chart of WTI Crude Oil is showing a long-term downtrend channel, where price has been consistently making lower highs and lower lows since mid-2023. Currently, oil is trading around $69.96, showing a sharp bullish push of 6.13% for the week. However, the price is still inside the broader descending channel, which keeps the long-term trend bearish unless a confirmed breakout occurs.
Key Resistance Levels:
- $70.27, $71.03, $73.43
Support Levels:
- $69.05 (previous breakout zone)
- $67.00–$68.00 (triangle retest area)
Trend Outlook:
- Short-Term: Bullish momentum; pullbacks likely to hold above $69.05.
- Medium-Term: If $71.85 breaks, price may target $76.00–$76.50 resistance.
Note
Please risk management in trading is a Key so use your money accordingly. If you like the idea then please like and boost. Thank you and Good Luck!
One Last Dip Before the Pop?On the daily timeframe, we anticipate two possible scenarios for USOIL’s movement. In the red-labeled scenario, USOIL is expected to undergo a correction to test the 63.71–64.03 area. However, in the best-case scenario, if USOIL manages to hold above 64.03, it has the potential to strengthen toward the 68.27–72.53 range.


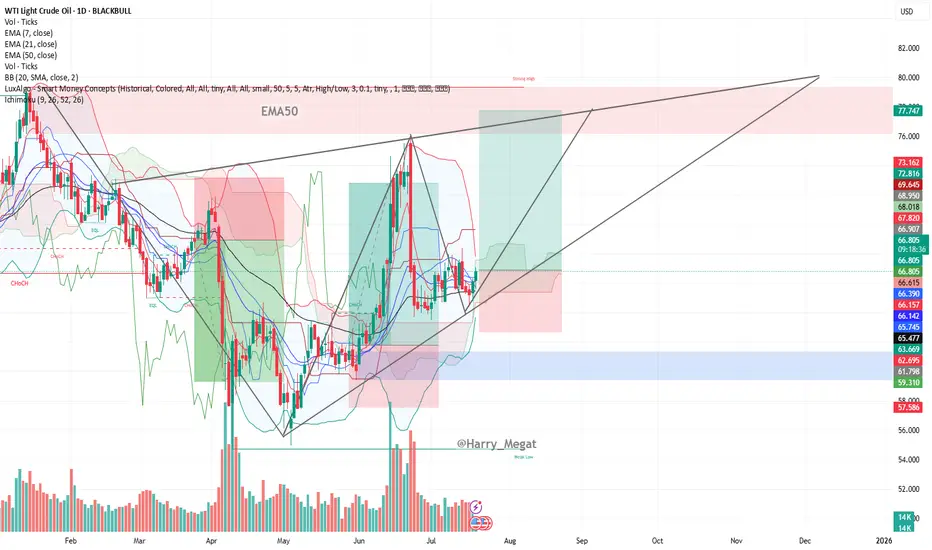
WTI Crude Oil Daily Chart Analysis (symmetrical triangle)WTI Crude Oil Daily Chart Analysis
**Trend & Structure:**
* The chart displays a **symmetrical triangle** formation, signaling a **potential breakout setup**.
* Price is currently trading around **\$66.78**, gradually rising from its recent consolidation.
* **Higher lows** and **lower highs** indicate a tightening range, which usually precedes a sharp move.
**Support & Resistance:**
* **Support Zone:** Around **\$65.47–\$66.15**, marked by the 50 EMA and prior price reactions.
* **Resistance Levels:**
* **\$68.95** – Short-term resistance and previous peak.
* **\$72.81** – Strong horizontal resistance.
* **\$77.75–\$80.00** – Projected upper trendline zone of triangle.
**Moving Averages (Bullish Setup):**
* EMA 7: **\$66.15**
* EMA 21: **\$66.14**
* EMA 50: **\$65.47**
* All EMAs are aligned in bullish order (7 > 21 > 50), confirming **bullish momentum**.
**Volume Insight:**
* Volume remains relatively steady; a spike in volume with breakout from the triangle would confirm trend continuation.
**Trade Setup Suggestion (based on chart):**
* **Breakout Buy Idea:** If price breaks above **\$68.95–\$70**, potential upside to **\$77–\$80**.
* **Invalidation:** A break below **\$65** would invalidate the bullish structure.
**Conclusion:**
WTI crude oil is trading within a symmetrical triangle, supported by bullish EMAs and tightening price action. A breakout above \$69 could trigger a bullish rally toward \$77–\$80. Keep an eye on volume confirmation and geopolitical headlines that can impact oil fundamentals.
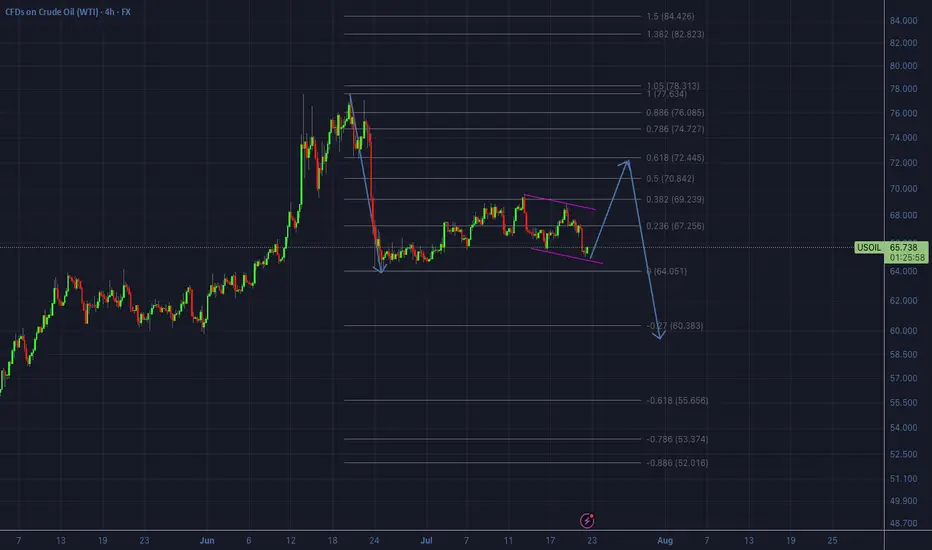
OIL - Likely development on the 4hr/daily scenarioThis looks like the likely scenario that will now develop on oil on the 4hr/daily timeframe.
In other words, we will look for an upside from now on first, back to the 0.618 re-tracement of the huge downside impulse that occurred in the last week of June.
So all buy setups we will be able to take until price hits the $72 area, then we will start looking for sells.