Oil Bearish for next weekOil will be bearish for next week. Toxic Sell and Calender spread shows the direction.
XTIUSD trade ideas

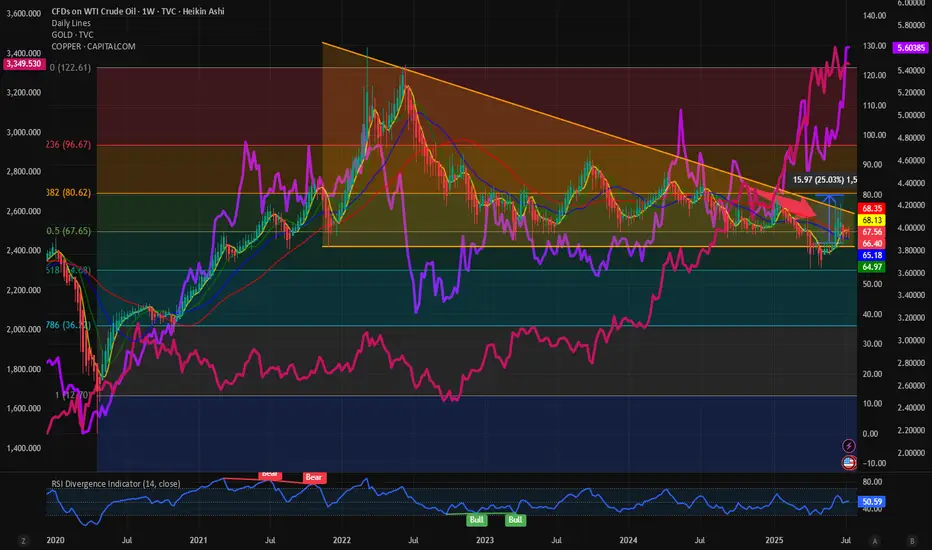
$USOIL: Will we see breakout or breakdown from this wedge? I have been watching the Commodity markets recently keenly to get direction or for market indications. AMEX:GLD , Copper and TVC:USOIL are the big 3 which determines the direction of commodity markets and hence the inflation. Inflation dictates direction of TVC:US10Y , TVC:DXY and hence the Equity markets. So, what are commodity markets telling us? With AMEX:GLD and OANDA:XCUUSD at ATH what does this mean for TVC:USOIL : TVC:USOIL Is in a bearish pattern and no sign of concrete bullish reversal on the commodity. Recently it has shown some signs of strength but still below its 0.5 Fib retracement level which is at 68 and we have time and again said that 0.318 Fib level at 80 $ might prove to be an upper resistance which will be difficult to breakout.
In the recent months whenever TVC:USOIL tries to break out of the 60 RSI sellers came back and pushed the prices down. Currently with RSI at 50 we might have some room for upside. Oil bulls can have a 20% upside in the RSI taking it to 60 which has historically proved to be a resistance. And a 20% upside in price is also possible with price hitting our 0.318 resistance level of 80%. Above that there is limited upside for $USOIL. The downward slopping wedge shown below indicates a breakout might be imminent which might take TVC:USOIL to 80 $ which is our highest target in this range bound market.
In contrast the bull run in other important commodities like AMEX:GLD and COPPER might have some legs as they are showing strength by breaking above the previous ATH. It is always a good idea to buy strength and ATH.
Verdict: TVC:USOIL remains range bound with 55 $ on lower bound and 80 on the upper bound. Commodity bulls can look at AMEX:GLD and OANDA:XCUUSD for better returns.
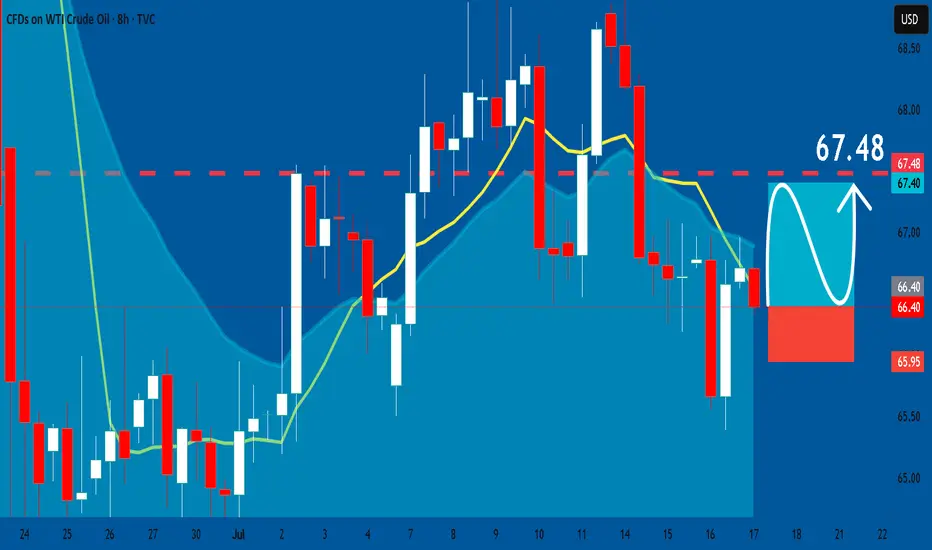
USOIL: Bullish Continuation & Long Trade
USOIL
- Classic bullish pattern
- Our team expects retracement
SUGGESTED TRADE:
Swing Trade
Buy USOIL
Entry - 66.40
Stop - 65.95
Take - 67.48
Our Risk - 1%
Start protection of your profits from lower levels
Disclosure: I am part of Trade Nation's Influencer program and receive a monthly fee for using their TradingView charts in my analysis.
❤️ Please, support our work with like & comment! ❤️
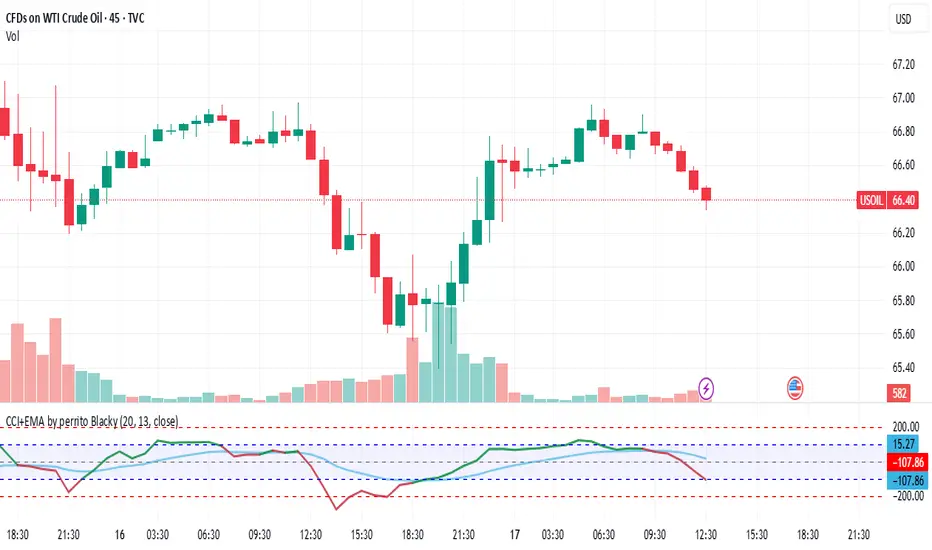
Crude fall - short termI am anticipating crude to fall these marked levels because:
1. Strong Opening Gap which usually closes after some time
2. Liquidity levels are at the same place as the Opening Gap.
3. Oil price has to fallback a bit more and consolidate a bit more to have a healthy patterns to rise until potential 90.
USOIL Technical Analysis! BUY!
My dear followers,
This is my opinion on the USOIL next move:
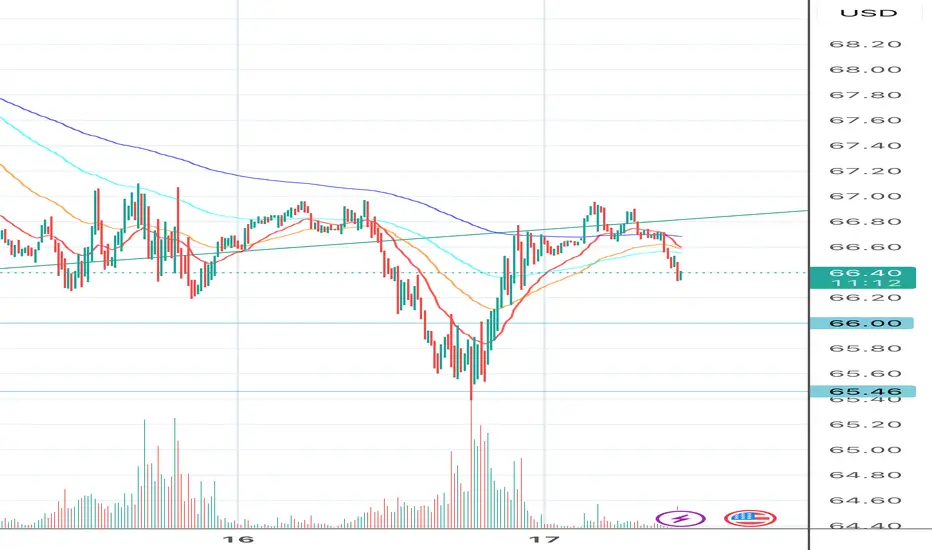
The asset is approaching an important pivot point 66.40
Bias - Bullish
Safe Stop Loss - 65.78
Technical Indicators: Supper Trend generates a clear long signal while Pivot Point HL is currently determining the overall Bullish trend of the market.
Goal - 67.32
About Used Indicators:
For more efficient signals, super-trend is used in combination with other indicators like Pivot Points.
Disclosure: I am part of Trade Nation's Influencer program and receive a monthly fee for using their TradingView charts in my analysis.
———————————
WISH YOU ALL LUCK
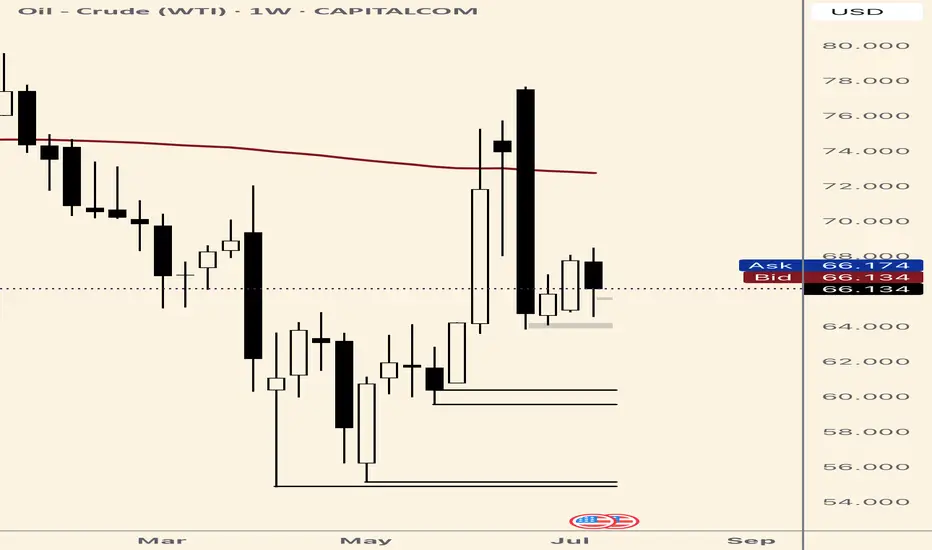
WTI USOIL As of July 19, 2025, the WTI crude oil price is hovering around $67.342 to $68.83 per barrel after attempting 77.52$ per barrel on Israel Iran conflict in the middle east. As a trader Make out time to look into OPEC WORLD OIL OUTLOOK(WOO) REPORT,SPR REPORT , this woo report provide comprehensive industry forecast and strategic petroleum reserve gives insight into united state energy status.
OPEC meetings are usually held in Vienna and involves discussions and agreement on oil production quotas affecting the global crude oil supply and prices.
oil sharply rose during Israel and Iran geopolitical tension and on the supply roof rejected AT 77.52$ PER BARREL ..
Supply remains cautiously controlled because price is influenced by demand and supply system , but global economic uncertainties and trade tensions, especially involving tariffs and sanctions, continue to influence oil demand expectations.
the US Strategic petroleum reserve (SPR) is the united states emergency crude oil stockpile managed by department of energy ,it act as a buffer to protect against significant supply disruption of oil market, the SPR holds hundreds of millions of barrels of crude oil stored in the underground salt caverns along the gulf coast.it can be tapped to stabilize the market during supply crises or emergencies .
the U.S government occasionally release oil from the SPR to ease supply shortage or control fuel prices coordinated with other countries through the international energy agency if need be.the status and release are regularly monitored as they affect global oil prices and energy security
Am holding WTI OIL low buy and will continue until the break of demand floor and might add more buy if the sentiment holds buy idea.
Trading OIL AND GAS is 100% probability , No one can tell the next crisis and global energy supply disruption.
Manage your risk.

CRUDE OIL BEARISH BREAKOUT|SHORT|
✅CRUDE OIL broke the rising
Support line which is now a resistance
And the price made a retest an a pullback
So we we are bearish biased and we
Will be expecting a further
Bearish move down
SHORT🔥
✅Like and subscribe to never miss a new idea!✅
Disclosure: I am part of Trade Nation's Influencer program and receive a monthly fee for using their TradingView charts in my analysis.

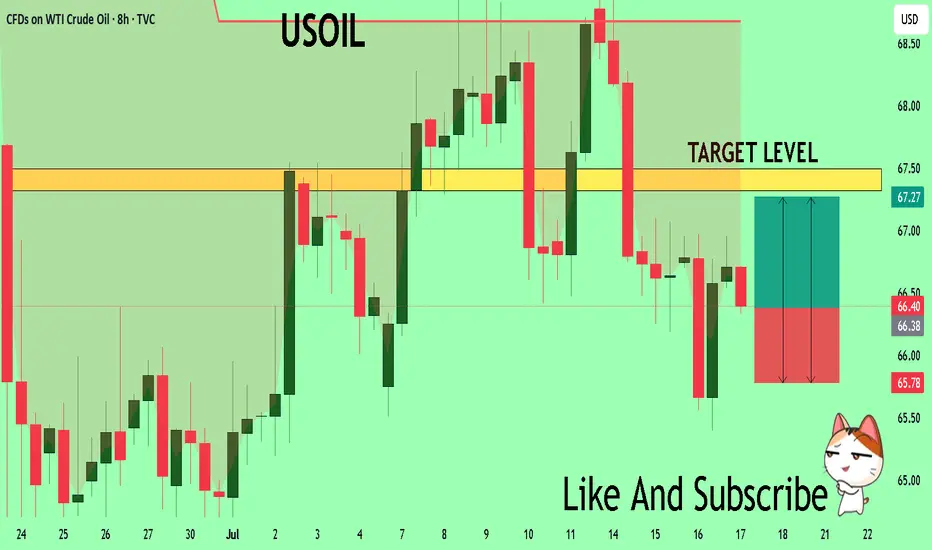
USOIL - BULLISH MOVE !Hello Traders !
The USOIL failed to create a new lower low!
The price broke the lower high (choch).
So, I expect a bullish move🚀
______________
TARGET: 68.880🎯
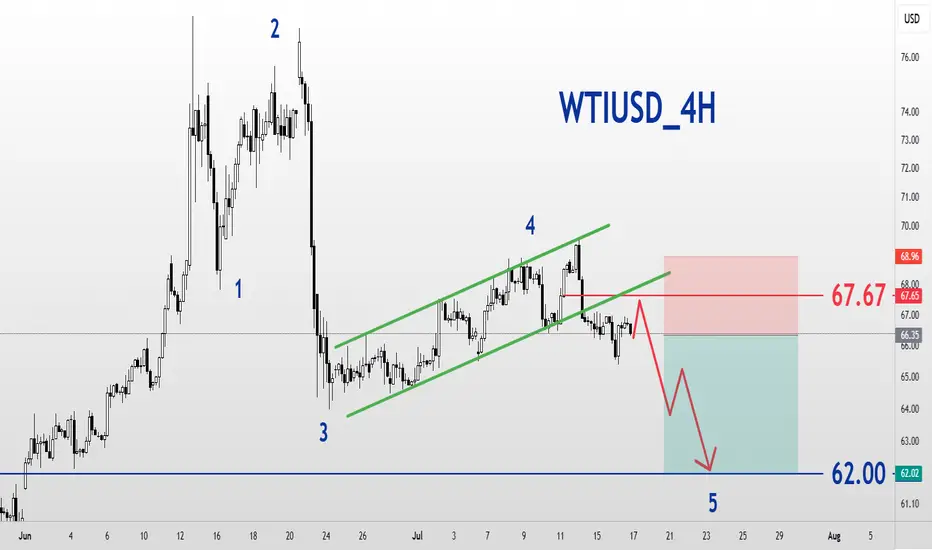
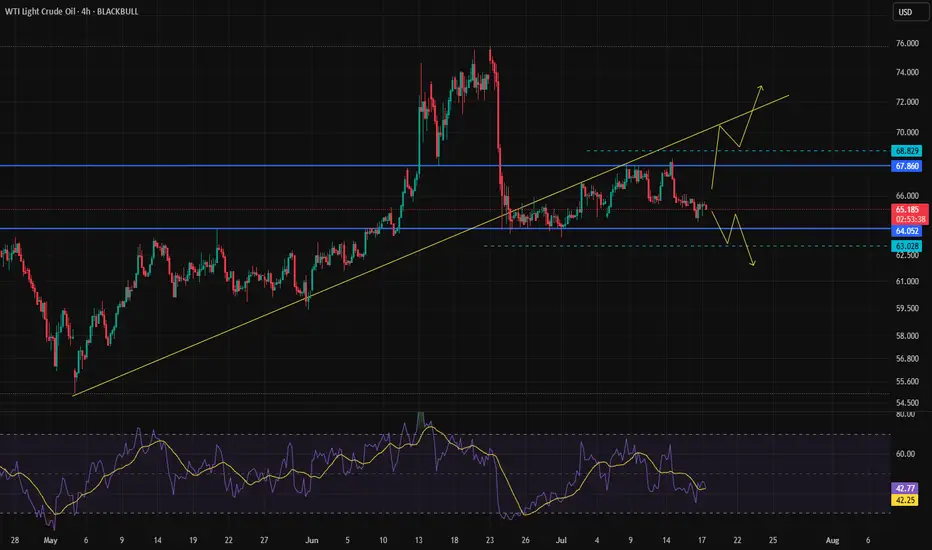
WTIUSD_4H_SellWest Texas Intermediate Oil Analysis
Short-term Time Frame
Elliott Wave Analysis Style
The market can only continue to decline by holding the resistance at 67.67 and moving towards the target of wave 5 at $62.
BRENT CRUDE OIL FORMED A BEARISH WEDGE. ANOTHER POSSIBLE DECLINEBRENT CRUDE OIL FORMED A BEARISH WEDGE. ANOTHER POSSIBLE DECLINE?📉
USOIL has been trading bullish within the last couple of days, supported by prospects of tighter supply and an improved demand outlook. US crude inventories dropped last week, which indicates firm demand despite the rising output.
Still, technically, oil looks bearish. It has formed a bearish wedge and is currently testing the former trendline from below. The most probable scenario is that wee see the bearish impulse towards 6,500.00 with further decline. Another option is that the rise will continue towards 6,900.00 level.

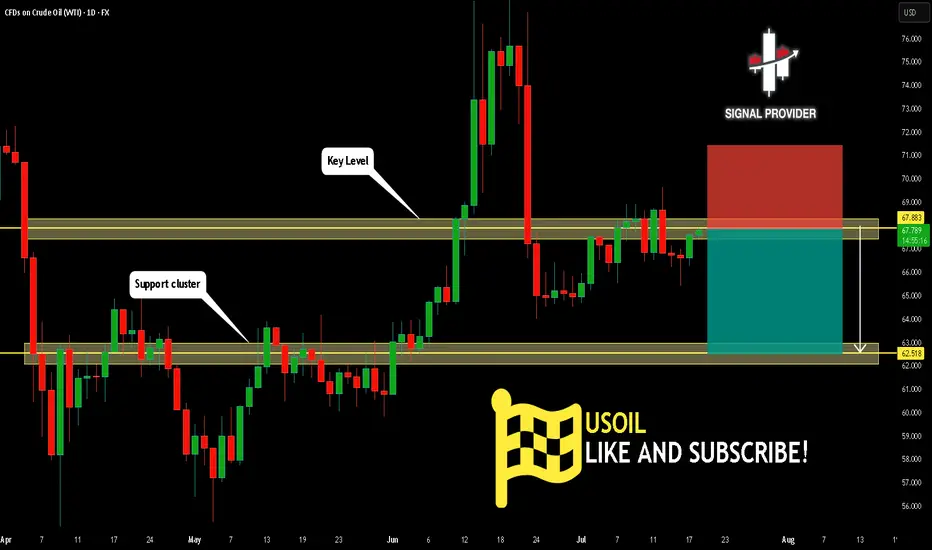
USOIL Will Go Lower! Sell!
Take a look at our analysis for USOIL.
Time Frame: 1D
Current Trend: Bearish
Sentiment: Overbought (based on 7-period RSI)
Forecast: Bearish
The price is testing a key resistance 67.883.
The above-mentioned technicals clearly indicate the dominance of sellers on the market. I recommend shorting the instrument, aiming at 62.518 level.
P.S
Overbought describes a period of time where there has been a significant and consistent upward move in price over a period of time without much pullback.
Disclosure: I am part of Trade Nation's Influencer program and receive a monthly fee for using their TradingView charts in my analysis.
Like and subscribe and comment my ideas if you enjoy them!
WTI Crude Oil ShortWTI Crude Oil – Technical & Macro Outlook
🔻 1. Supply Zone Rejection Expected (66.50–68.00 Range)
Price is currently approaching a newly established supply zone between $66.50 and $68.00, which coincides with a prior consolidation area that preceded the recent sharp sell-off. This confluence enhances the zone’s relevance, especially given its position just below the 0.5 Fibonacci retracement level (~$69.47), derived from the swing high at $75.79 to the swing low.
📌 Outlook:
This region is expected to act as a high-probability rejection zone, likely attracting institutional sell-side interest. Price action within this zone should be monitored for signs of weakness or distribution.
📉 2. Downside Target: $61.50–$63.00 Demand Cluster
Should the supply zone hold, downside momentum could drive WTI toward the $61.50–$63.00 demand range. This area is technically significant, supported by the following factors:
Previous Change of Character (ChoCH) at $63.49, which marked the beginning of the recent bullish correction and represents a key structural pivot.
Presence of stacked demand zones below $64, increasing the likelihood of a meaningful reaction from buyers.
📌 Outlook:
This zone is expected to attract strong buying interest, making it a short-term profit-taking region for bears and a potential entry point for swing long setups, depending on confirmation.
🌍 Geopolitical Risk Landscape & Supply Dynamics
Recent geopolitical developments continue to influence crude oil pricing dynamics:
Middle East instability (e.g., Iraqi disruptions and ceasefire delays) has led to tightened supply conditions, pushing WTI above $67.
Persistent uncertainty stemming from Iranian nuclear negotiations, ongoing U.S.–China tariff risks, and regional tensions contributes to a sustained risk premium.
While OPEC+ is incrementally increasing production, this is offset by rising Saudi exports and weakening demand forecasts, which may result in inventory builds by late 2025.
Russia’s export resilience—bolstered by strategic redirection toward Asia—suggests that any anticipated supply contraction could be less severe than expected.
🛢 WTI at $62 – Technical and Macro Implications
A decline to $62 would place WTI at a major technical support level, closely watched by institutional participants. If tested, the market could react in the following ways:
Bargain hunting and value-based buying may emerge, especially if macroeconomic data aligns with a recovery narrative.
Heightened volatility is likely, driven by sensitivity to any shifts in global risk sentiment—particularly those tied to trade policy, OPEC+ production surprises, or further geopolitical escalations.
📌 Summary
Resistance: $66.50–$68.00 (pre-breakdown supply + 0.5 Fib)
Support / Target: $61.50–$63.00 (demand + structural ChoCH)
Bias: Short-term bearish toward demand, with high reactivity expected near $62
Risk Factors: Elevated geopolitical uncertainty and diverging supply dynamics across OPEC+, Russia, and the U.S.

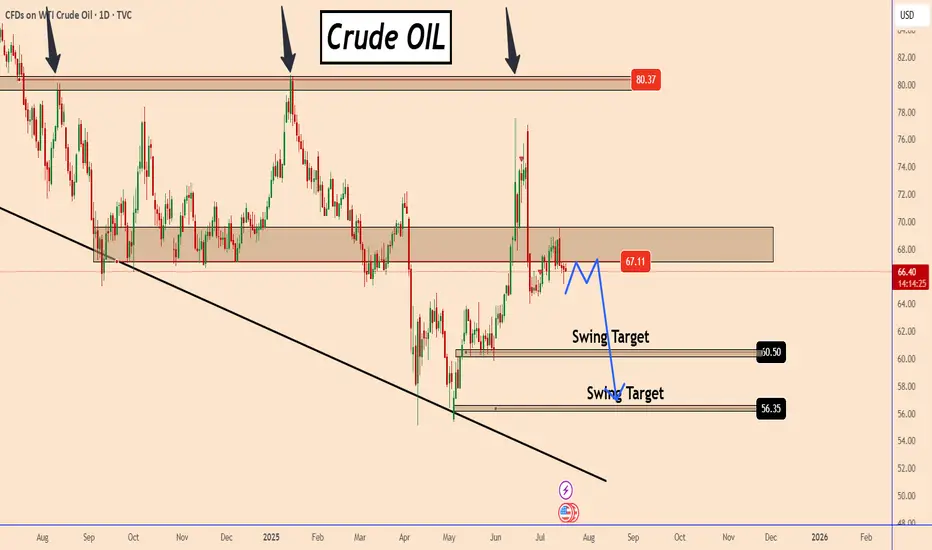
OIL: The Chances To Drop Are Growing FurtherOIL: The Chances To Drop Are Growing Further
OIL has days in this zone. Overall it's developing as I explained earlier.
The price increased a bit more than expected but again it's in a strong structure zone and is holding strong.
I think that OIL has to create a better pattern, but overall it looks poised to drop further from this zone with targets 60 and 56
You may find more details in the chart!
Thank you and Good Luck!
PS: Please support with a like or comment if you find this analysis useful for your trading day
Retest fails on USOILOil dropped Wednesday on expectation of poor WTI stockpile data. Data confirmed bearish bias although retest of trend line proceeded. Retest has failed.
Crude Oil – Range Getting Too Long to Ignore
Oil has been stuck in a prolonged range, and a breakout in either direction is becoming increasingly likely.
The overall trend remains bullish, as there’s been no confirmed trend reversal yet.
📌 Key Scenarios:
A break to the upside would signal continuation of the bullish trend.
A break below the range could confirm a potential trend reversal.
📈📉 To avoid missing the next move, this setup can be traded with Buy Stop above the range and Sell Stop below it, allowing you to catch the momentum regardless of the direction.
⚠️ Wait for confirmation on higher timeframes if you prefer less risk
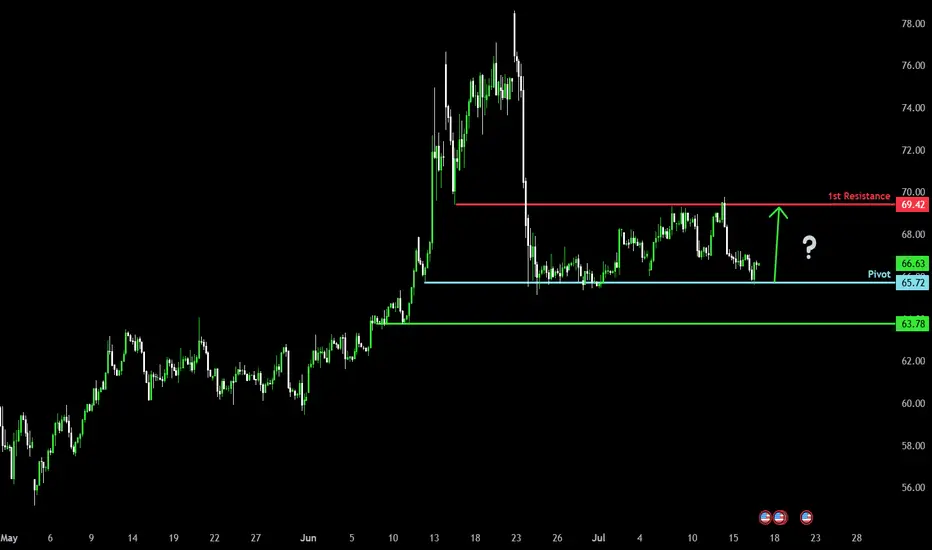
Bullish bounce off major support?WTI Oil (XTI/USD) has bounced off the pivot which has been identified as a pullback support and could rise to the 1st resistance.
Pivot: 65.72
1st Support: 63.78
1st Resistance: 69.42
Risk Warning:
Trading Forex and CFDs carries a high level of risk to your capital and you should only trade with money you can afford to lose. Trading Forex and CFDs may not be suitable for all investors, so please ensure that you fully understand the risks involved and seek independent advice if necessary.
Disclaimer:
The above opinions given constitute general market commentary, and do not constitute the opinion or advice of IC Markets or any form of personal or investment advice.
Any opinions, news, research, analyses, prices, other information, or links to third-party sites contained on this website are provided on an "as-is" basis, are intended only to be informative, is not an advice nor a recommendation, nor research, or a record of our trading prices, or an offer of, or solicitation for a transaction in any financial instrument and thus should not be treated as such. The information provided does not involve any specific investment objectives, financial situation and needs of any specific person who may receive it. Please be aware, that past performance is not a reliable indicator of future performance and/or results. Past Performance or Forward-looking scenarios based upon the reasonable beliefs of the third-party provider are not a guarantee of future performance. Actual results may differ materially from those anticipated in forward-looking or past performance statements. IC Markets makes no representation or warranty and assumes no liability as to the accuracy or completeness of the information provided, nor any loss arising from any investment based on a recommendation, forecast or any information supplied by any third-party.
Bullish bounce?USO/USD is falling towards the support level which is an overlap support that aligns with the 61.8% Fibonacci reracement and could bounce from this level to our take profit.
Entry: 64.89
Why we like it:
There is an overlap support that lines up with the 61.8% Fibonacci retracement.
Stop loss: 63.08
Why we like it:
There is a pullback support.
Take profit: 69.97
Why we like it:
There is an overlap resistance.
Enjoying your TradingView experience? Review us!
Please be advised that the information presented on TradingView is provided to Vantage (‘Vantage Global Limited’, ‘we’) by a third-party provider (‘Everest Fortune Group’). Please be reminded that you are solely responsible for the trading decisions on your account. There is a very high degree of risk involved in trading. Any information and/or content is intended entirely for research, educational and informational purposes only and does not constitute investment or consultation advice or investment strategy. The information is not tailored to the investment needs of any specific person and therefore does not involve a consideration of any of the investment objectives, financial situation or needs of any viewer that may receive it. Kindly also note that past performance is not a reliable indicator of future results. Actual results may differ materially from those anticipated in forward-looking or past performance statements. We assume no liability as to the accuracy or completeness of any of the information and/or content provided herein and the Company cannot be held responsible for any omission, mistake nor for any loss or damage including without limitation to any loss of profit which may arise from reliance on any information supplied by Everest Fortune Group.

Crude oil extends fallsThe crude oil market has entered a fragile and uncertain phase, with prices retreating from recent highs. While WTI crude is still holding above the critical $65 mark on a closing basis, it was below this handle at the time of writing. So, the overall tone remains cautious, with a bearish tilt expected to persist in the near term.
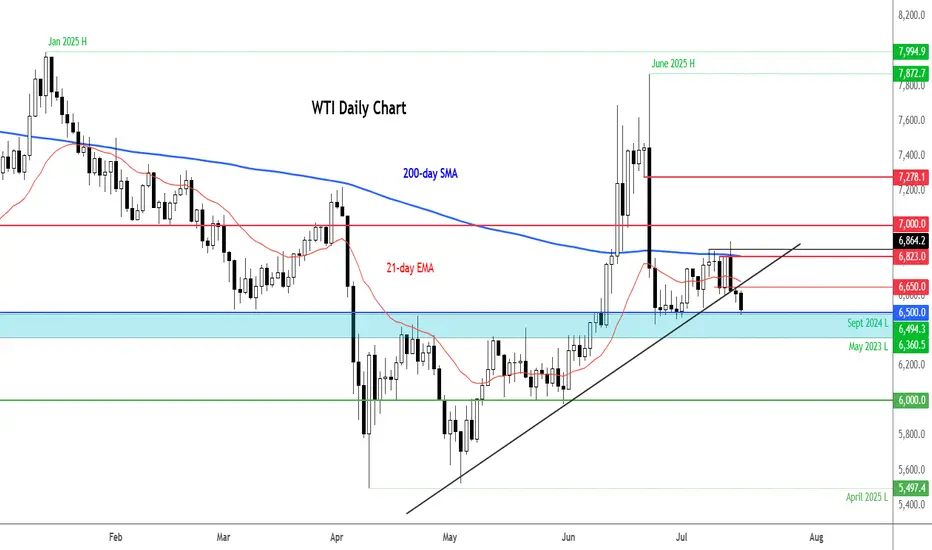
Technical Outlook: WTI Breaks Key Support
The WTI crude chart shows a breakdown of a short-term bullish trend line, and lower lows. The price failed to reclaim the 200-day moving average and found strong resistance since. Currently, it is testing support around $65.00. A daily close below this level could trigger further bearish momentum, with the next support zones seen at $64, and then the next round handles below that. $60 per barrel could be reached if the macro backdrop doesn't improve.
Geopolitical Factors: Trump’s Tariff Threats Dismissed
Donald Trump’s threats of 100% tariffs on countries buying Russian oil sparked initial concern but were ultimately shrugged off by the market. Traders interpreted the 50-day delay in enforcement and Trump’s historical pattern of backing off such threats as signs that immediate supply disruptions were unlikely.
OPEC+ Strategy: Supply Returning to the Market
OPEC+ has announced a larger-than-expected production increase of 548,000 bpd for August, with another 550,000 bpd potentially coming in September. This roll-back of earlier voluntary cuts aims to recapture market share, especially as U.S. shale production slows. However, the added supply may cap price gains, particularly as demand is expected to ease after the peak U.S. driving season.
By Fawad Razaqzada, Market Analyst with FOREX.com
WTI Crude corrective pullback testing support at 6500Trade Tensions & Inflation Impact on WTI Crude
Tariff Announcement: The US has imposed reciprocal tariffs on 22 nations, including major trade partners such as the EU, Japan, Canada, Mexico, and South Korea, after a failed trade agreement during the 90-day negotiation window.
EU Response: The EU is preparing retaliatory tariffs unless a deal is reached before the August 1 deadline, raising the risk of a trade war escalation.
Trump's Warning: The US President has threatened additional tariffs if retaliatory measures are enacted, compounding uncertainty in global trade flows.
Inflation Spike: US June CPI rose to 2.7% YoY, in line with expectations. The increase was driven by higher prices of imported goods, as tariffs begin affecting consumer costs.
Fed Policy Impact: Rising inflation weakens the case for a Fed rate cut in September, dampening liquidity expectations and investor risk sentiment.
Conclusion for WTI Crude Trading
The combination of rising inflation, tariff-driven cost pressures, and a potential stall in Fed easing is bearish for WTI crude in the near term.
Additionally, intensifying trade tensions threaten global demand outlooks, which may further weigh on oil prices.
Traders should expect near-term downside pressure on WTI crude unless there is a clear de-escalation in trade rhetoric or a surprise dovish pivot from the Fed.
Bias: Cautiously Bearish on WTI Crude near term.
Key Support and Resistance Levels
Resistance Level 1: 6830
Resistance Level 2: 6940
Resistance Level 3: 7045
Support Level 1: 6500
Support Level 2: 6435
Support Level 3: 6370
This communication is for informational purposes only and should not be viewed as any form of recommendation as to a particular course of action or as investment advice. It is not intended as an offer or solicitation for the purchase or sale of any financial instrument or as an official confirmation of any transaction. Opinions, estimates and assumptions expressed herein are made as of the date of this communication and are subject to change without notice. This communication has been prepared based upon information, including market prices, data and other information, believed to be reliable; however, Trade Nation does not warrant its completeness or accuracy. All market prices and market data contained in or attached to this communication are indicative and subject to change without notice.

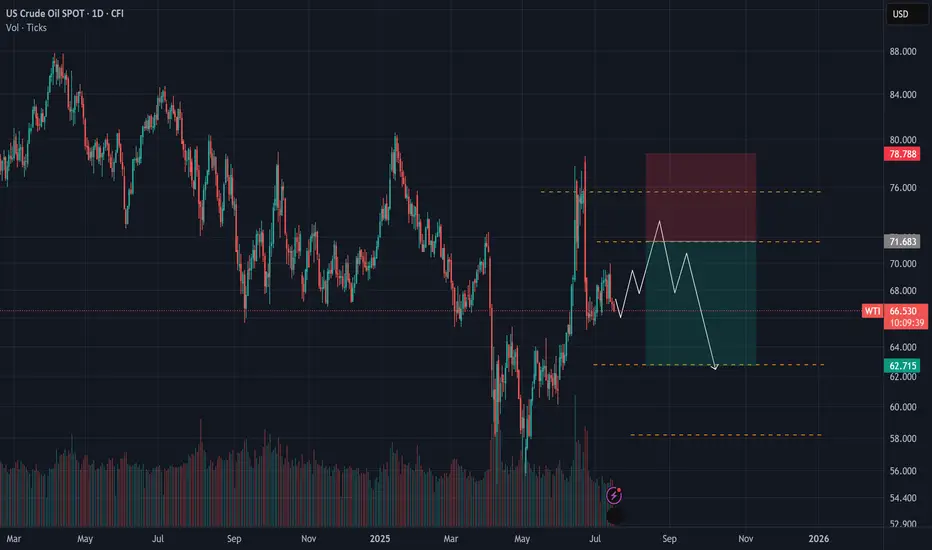
WTI Crude Oil Analysis – July 15, 2025Following recent Middle East tensions, WTI crude oil briefly surged to around $77.
However, the price quickly retraced back to its previous range and seems to have resumed its prior downward trajectory — characterized by a gradual bearish slope.
🔍 It’s important to remember that before the geopolitical events, analysts were eyeing the $52 level as a potential target.
Now, with liquidity being absorbed around the $70 area, that bearish scenario remains valid.
📉 Unless oil decisively breaks above key resistance levels, the outlook continues to favor a slow, downward trend.
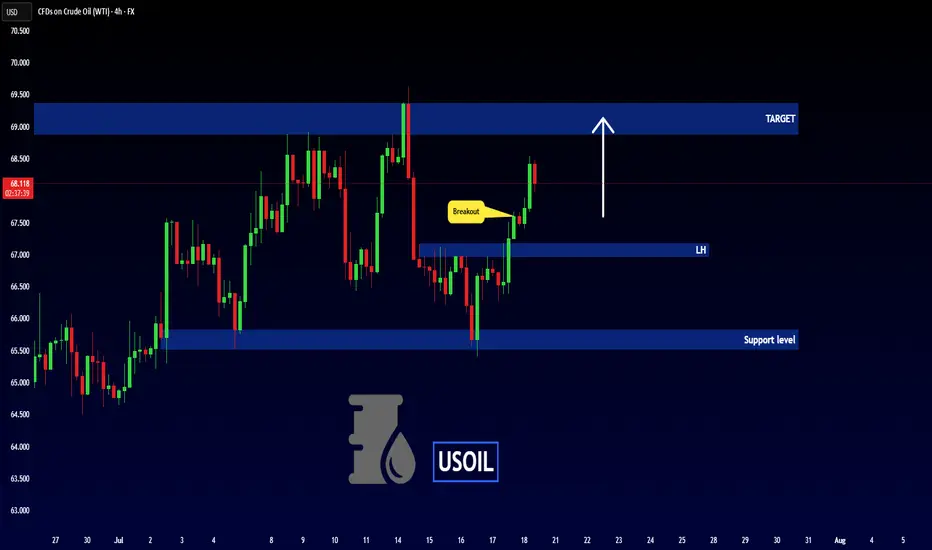
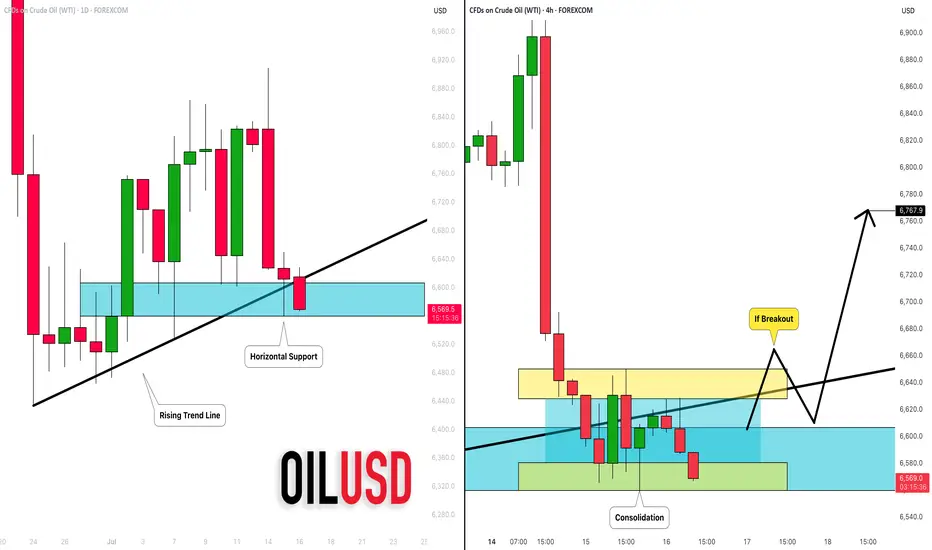
CRUDE OIL (WTI): Your Trading Plan Explained
Do not forget that today we expect Crude Oil Inventories data
release - it will be 10:30 am NY time.
Ahead of this news, the market is testing a significant daily support cluster
that is based on a rising trend line and a horizontal structure.
You signal to buy will be a bullish breakout of a minor intraday
horizontal resistance on a 4H.
4H candle close above 66,5 will be your confirmation.
A bullish continuation will be expected to 67.6 then.
I suggest waiting for the news release first and then check how
the market prices in the news. If our technicals align with fundamentals,
it will provide an accurate setup.
Alternatively, a bearish violation of a blue support will push the prices lower.
❤️Please, support my work with like, thank you!❤️
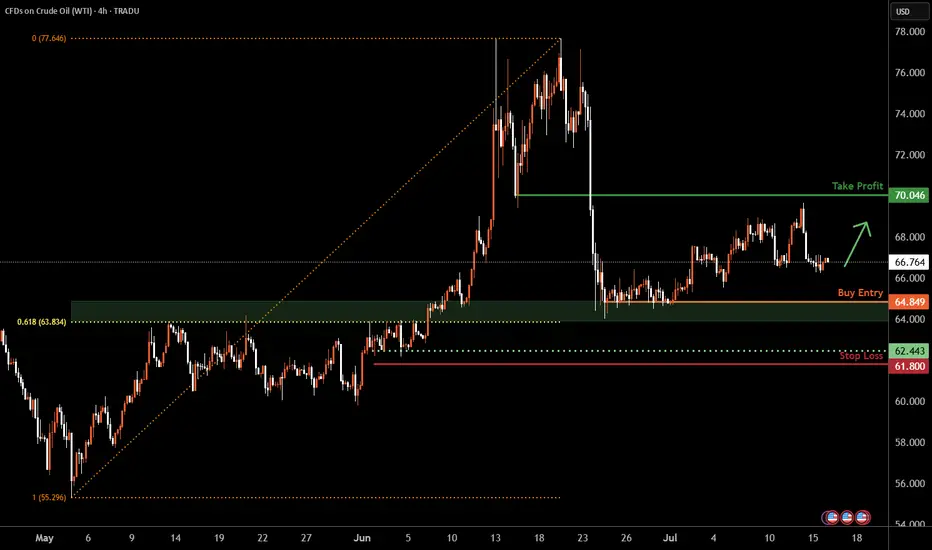
WTI Oil H4 | Potential bounce off a multi-swing-low supportWTI oil (USOIL) is falling towards a multi-swing-low support and could potentially bounce off this level to climb higher.
Buy entry is at 64.84 which is a multi-swing-low support that aligns closely with the 61.8% Fibonacci retracement.
Stop loss is at 61.80 which is a level that lies underneath a multi-swing-low support.
Take profit is at 70.04 which is a pullback resistance.
High Risk Investment Warning
Trading Forex/CFDs on margin carries a high level of risk and may not be suitable for all investors. Leverage can work against you.
Stratos Markets Limited (tradu.com ):
CFDs are complex instruments and come with a high risk of losing money rapidly due to leverage. 63% of retail investor accounts lose money when trading CFDs with this provider. You should consider whether you understand how CFDs work and whether you can afford to take the high risk of losing your money.
Stratos Europe Ltd (tradu.com ):
CFDs are complex instruments and come with a high risk of losing money rapidly due to leverage. 63% of retail investor accounts lose money when trading CFDs with this provider. You should consider whether you understand how CFDs work and whether you can afford to take the high risk of losing your money.
Stratos Global LLC (tradu.com ):
Losses can exceed deposits.
Please be advised that the information presented on TradingView is provided to Tradu (‘Company’, ‘we’) by a third-party provider (‘TFA Global Pte Ltd’). Please be reminded that you are solely responsible for the trading decisions on your account. There is a very high degree of risk involved in trading. Any information and/or content is intended entirely for research, educational and informational purposes only and does not constitute investment or consultation advice or investment strategy. The information is not tailored to the investment needs of any specific person and therefore does not involve a consideration of any of the investment objectives, financial situation or needs of any viewer that may receive it. Kindly also note that past performance is not a reliable indicator of future results. Actual results may differ materially from those anticipated in forward-looking or past performance statements. We assume no liability as to the accuracy or completeness of any of the information and/or content provided herein and the Company cannot be held responsible for any omission, mistake nor for any loss or damage including without limitation to any loss of profit which may arise from reliance on any information supplied by TFA Global Pte Ltd.
The speaker(s) is neither an employee, agent nor representative of Tradu and is therefore acting independently. The opinions given are their own, constitute general market commentary, and do not constitute the opinion or advice of Tradu or any form of personal or investment advice. Tradu neither endorses nor guarantees offerings of third-party speakers, nor is Tradu responsible for the content, veracity or opinions of third-party speakers, presenters or participants.