XTZ.BTC (Y20.P3.E2).TA on the Macro StructureHi All,
My thoughts on Tezos against BTC:
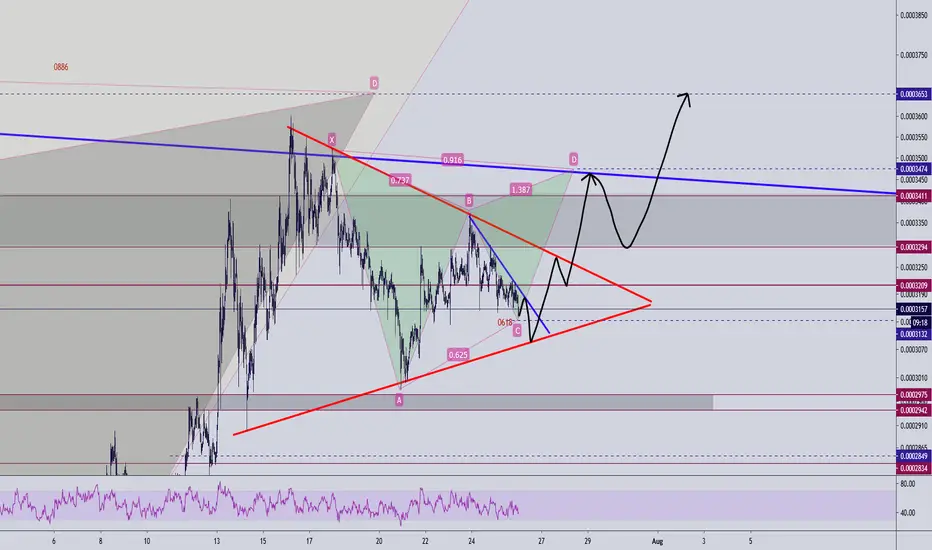
> Price is below the 10 to 100 EMA on the Daily price action and these ema ribbons have confluence headed towards the current 0.5 or 0.382 Fib retracement level as per chart, which is equivalent to the red min line of the Fan pattern, which at times can be a reversal pattern or bullish pattern.
> Note the points of touches on the chart structure, by the dark boxes. 2 touches to the top and potentially the 3rd touch to the bottom, completing the ABCDE formation.
> Note that we are in the 3 to 4 of the elliot impulse with a complex correction and the chart pretty much confirms this. I learnt recently that 3 to 4 is usually complex to strip of our gains with the 0 to 3 impulse which are usually clear trends. And just like BTC, we will end up going from 4 to 5 after this formation.
> Both bottom indicators show that we are approaching the bottom reversal area.
I'm looking for a cross over of the signals on the WT and if you note on the Phoeix, energy is moved above the 50% mark showing an emerging divergence.
Daily with key pivot points and levels
Daily with EMAs
12 HRLY chart: No bullish candles yet
Please give me a tick or a like for this post.
Regards,
S.Sari
Moving off the Tezos topic, check out the monthly close now and how bullish it still remains for the long term.
XTZBTC trade ideas

XTZ bear pennant upwards breakoutLows got swept, liquidity pool got tapped. Bearish pennant upwards breakout. Alts are finally recovering.
SL - 2455.
Resistance levels - 2895, 3010, 3300.


we need action to avoid this grave stone!Monthly close on this grave stone doji means..... BITCOIN retk. next couple of days are too important.

XTZBTC Rising Wedge bounce potential after big BTC pump-I can see a rising wedge forming here as Tezos seems to bounce of a previous strong support
-Long wicks to the downside
-BTC seems to be retracing after big pump
-MACD Blue is crossed over above which is good
-RSI Looks Ok

XTZ-BTC ShortIf XTZ continues following its current cycle low and cycle high pattern, we can anticipate for the price to continue downwards.
XTZ file to make a higher high, and was rejected by the downtrend line.
If price reaches between .0002571, it would be an ideal for an entry.
For now, I would stay out of XTZ, there are better opportunities out there.
XTZ will have it’s time, but now it doesn’t seem like it.

Important support level buy strategyHello, traders.
XTZ reached an important support level after the altcoins slump today, that is the perfectly point to buy this asset.
Attention: BTC dominance still can grow more, which means that the altcoins can bleed.
Best regards.
Sandro and Gustavo.

XTZ ABCDE correction completedXTZ has been going through an ABCDE correction within a symmetrical triangle, this now appears to be complete and its ready to start a new 5 wave cycle. As long as the bottom trend line is respected this looks set to take place, I would expect a wave 3 breakout sometime in August.

Tezos is cheapXTZ/BTC has been consolidating in this symmetrical triangle since February. If you're fundamentally bullish on this coin, and who isn't, you might be looking for buying opportunities.
Bitcoin looks like she's about to go running, which has made alts skittish. But such drops in alts, especially liquid ones, often play into the bigger picture even when they're triggered by external or random factors.
The March selloff, for example, gave Tezos a roughly 50% correction of the screaming upmove it had been making, taking it to rest right on previous resistance now turned support.
The move down yesterday took price into resistance-turned-support from over a year ago. This coincides with the 200-day Simple Moving Average. The "real" MAs on charts such as Huobi's with more history are in more or less the same place.
So could it bounce here? Possibly.
But stronger support, the 200-day Exponential Moving Average, and the lower triangle trendline, are a bit lower, and that's where I'm looking for a higher probability long.
Then hopefully a break of the upper triangle line, the resistance at the top of this range, and blue skies above.


DOUBLE BTC WITH XTZThis chart is nothing but bullish. More than 130% roi in terms of BTC. Once it break the trendline moon mission will start. It can take more than 2 or 3 months to realize but hey doubling is not very common. Invalidation is stop point under wave 1 of 3rd. No financial advice this is my trading plan.

$XTZ new ATHWith the rise of Bitcoin and the news around $XTZ I can only see a new ATH for $XTZ.
Tezos and Seba Bank AG just been approved by Banque de France to conduct test of CDBC integration on interbank settlement.
Also backed by one of the famous Crypto invester Teeka Tawari drive.google.com


XTZ/BTC - Possible point of raiseHelo!
At XTZ we see consolidation above the 5 month middle support level.
Bounce off a downside line in local uptrend.
13 percent from ATS long signal.

XTZBTC Range Support| Bullish PA| .618 Fibonacci|S/R Flip RetestEvening Traders,
Today’s analysis – XTZBTC – reclaiming its range, a retest of support will allow for a long entry with defined risk.
Points to consider,
- Immediate trend bullish (consecutive higher lows)
- Range support confluence (.618 Fibonacci)
- Range resistance target
- Oscillator neutral
- Volume below average
- Long retest (risk defined)
XTZBTC’s immediate trend is bullish with consecutive higher highs and higher lows. This gives us a bias that any impulse sells and oversold conditions are for buying.
The range support is a key level that has been reclaimed; price is likely to retest this level as it is in confluence with the .618 Fibonacci. Range resistance will be the immediate target, breaking this level will be very bullish, continuing the trend.
Oscillators are both neutral, remaining above their respective 50 level; this indicates bullish momentum in the market.
The immediate volume is below average, this must increase for continued follow through, price action needs to be back with conviction.
Overall, in my opinion, XTZBTC is probable to retest local support which will allow for a long entry with defined risk.
Price action breaking below range support will negate the trade.
What are your thoughts?
Thank you for following my work!
And remember,
“Ultimately, consistent profitability comes down to choosing between the discomforts you feel when you follow your plan and the urge to let yourself be captures ( and ruled) by your emotions.” ― Yvan Byeajee


XTZBTC UPDATE: 27% already booked and now loading towards T3XTZBTC has reached our two targets and we have booked around 30% profit within a couple of days.
Our entry was around the green support box and now XTZBTC is @3360 sat.
If you have followed and earned up to now let me know in the comments down below.
Above the target 3 we are going to the moon for XTZBTC and it is extremely promising concept.
If you like my analysis please LIKE this post and FOLLOW me for more cryptocurrency analysis.

Break great resistance wall in XTZIn my mind I'm expected that with the new support line a dramatic rise until to touch the Great Wall and if the resistance break , it will start a new growing process like #Chainlink (LINK) ....

SYMMETRICAL TRIANGLE PATTERN XTZ/BTCTrading idea: Price is right now trading inside what occurs to be a symmetrical triangle with a probability to test the support trendline, or bottom of the symmetrical triangle. According to my VPVR, the POC line is lower than the current price, that's where I have put my alert for LESS THAN to get out - IF I don't see any type of price action around that area.

hopeful tezos continuation as you can see this is a pivotal zone, looking at june 3rd we tested this area as a resistance which is now a support (hopefully we keep it) or it could get bad in the short term.
