We PREDICTED XTZ/BTC PerfectlyThis was an example of a perfect trade executed on the XTZ/BTC chart. Those who followed our signal are now over 16% in profit, and that's without counting LEVERAGE first. We believe Tezos will continue to move inside the compression range, i.e. the turquoise Bollinger Band. Further downside is to be expected, and if you have shorts opened, do not close the ENTIRE position at the 50 daily moving average.
Many signals providers supply you with multiple signals daily. They prefer quantity over quality, and in consequence usually a big portion of the signals fail. They get you to build a house of cards; small profit after small profit after small profit. Not only is that time consuming without a trading bot, but also the other way around. You should strive towards small loss, small loss and then BIG win. At MeowSignals, we pick quality over quantity. One successful signal is big enough to cover ten losses and keep you going for weeks. We don't know when, we don't know the chart, we don't know how often. But hang around, because they DO come. Cheers.
Commodity Channel Index, custom volatility indicators and Bollinger Bands and their derivatives were used in the technical analysis. This is not a financial advice and you agree to take 100% responsibility.
Follow @MeowSignals for more insights! Also make sure to visit our...
Facebook: www.facebook.com
Website: (coming soon)
XTZBTC trade ideas


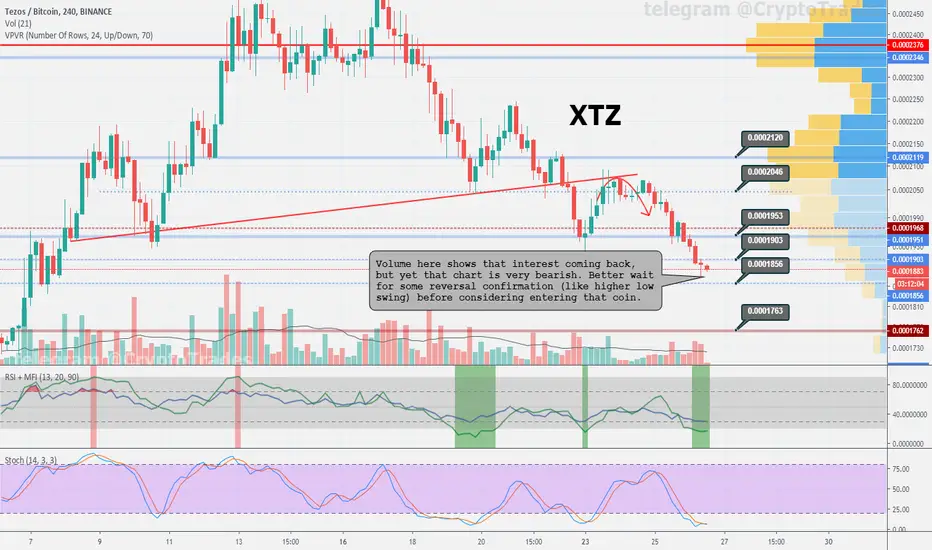
XTZ trying to bounceVolume here shows that interest coming back, with indicators swinging up from oversold area, but yet that chart is very bearish. Better wait for some reversal confirmation (like higher low swing) before considering entering that coin.
XTZ LONG bounce from kijunI shorted XTZ from 2400 and now we are near 1d kijun. So, I am going to long this bounce with tight stops (close 1d bar under kijun).


Wave 4-5...So we recently had an attempt to catch the wave 4-5 on this and were stopped out losing 1-2% but my stance has not changed I'm confident this is a wave 4 down and we will see another move up completing wave 5, I have supports marked...the lower one will invalidate the entire bullish count up and the first one is what we assume for now is the low of wave 4 and we're somewhat in a wave 5 up.

TEZOS WATCH (visual demo only)Market may be making some big moves, it is at a point where it usually bounces off the 200 EMA line on the 105 view.
If market bounces off at usually spot, I am not convinced any bounce here will be significant to the upside due to channel formation that should eventually break to the downside in my opinion.
Also a double top formation is another possible prep for a reversal.
Market is new to platforms and typically when an altcoin comes into market and generally heads up, it tends to eventually break down and often to make new lows in comparison to the beginning of it's market cycle.
Watch market closely, if you're in Tezos buy, consider your exit and/or sell entries.
Channel formation best view 12hours.
Best to observe 200 EMA on 105 view to observe market bounce off from this.
Other EMAs in use are 50 and 100.
All ideas are for informative purposes only, trade at your own risk.

MeowSignals - XTZ/BTC Free Trade CallEntry: 2199 sat
Stop loss: 2302 sat
Take Profit: 1705 sat (t
Expected Call Duration: 3-7 days
Call strength: medium-high
Call risk: low
Brief Summary: Volatility Periods are over-expanded. Large and almost unrealistic amount of force would be needed to resume the trend. Correction is inbound. Take profits at the daily 50 MA, or at the 0.5 Fibonnaci Retracement. Stop losses must be set above the 1st standard deviation of the 4H 200 MA Bollinger Band.
Commodity Channel Index, custom volatility indicators and Bollinger Bands and their derivatives were used in the technical analysis. This is not a financial advice and you agree to take 100% responsibility.
Follow @MeowSignals for more insights! Also make sure to visit our...
Facebook: www.facebook.com
Website: (coming soon)

XTZ LONG$XTZ
Nearing the 0.382 retracement level, should see a bounce here. Safer level to long from would be closer to the 0.5/POC.


Tezos(XTZ) ~ I'm StakedWhichever way you look at this chart it has good potential plus interest on your stake whilst holding!
This is not financial advice but my opinion!


The bullrun is over for TezosTezos has broke through a major support level, which is an important signal for the beginning of a large downward move.

XTZ/BTC TA Update (Break Higher High?)XTZ/BTC
XTZ is currently holding the upward trend-line support today. If the price can hold this support, I expect the target bounce up to 3000 sats area
but if it failed to make a new higher high. A drop down to 0.5 Fib area is my target.

TEZOS next bull runAt the start of each cycle Tezos was bullish, so expecting next 5 days tezos bull run


Bullish Count...Expecting one more leg up here to complete wave 5...expect wave 4 to bounce/complete in zone marked.

$XTZ bullish cypherBINANCE:XTZBTC $XTZ is making a bullish cypher. Target's are 0.382 and 0.618 From AD retracement. So if you like my analysis smash the like button and don't forget to follow me. #crypto #XTZ #forex

XTZ/BTC - Time to Buy nearingGood buying opportunity for XTZ/BTC . Buy in around .00020. Sell .00026. Add leverage for more profit.

Short opportunity on resistance XTZ/BTCHi traders,
Maybe good short to open there if can't break up above the red line
We can clearly see the daily bearish Divergence :
