Tezos (XTZ) - September 13Hello?
Welcome, traders.
By "following", you can always get new information quickly.
Please also click "Like".
Have a nice day.
-------------------------------------
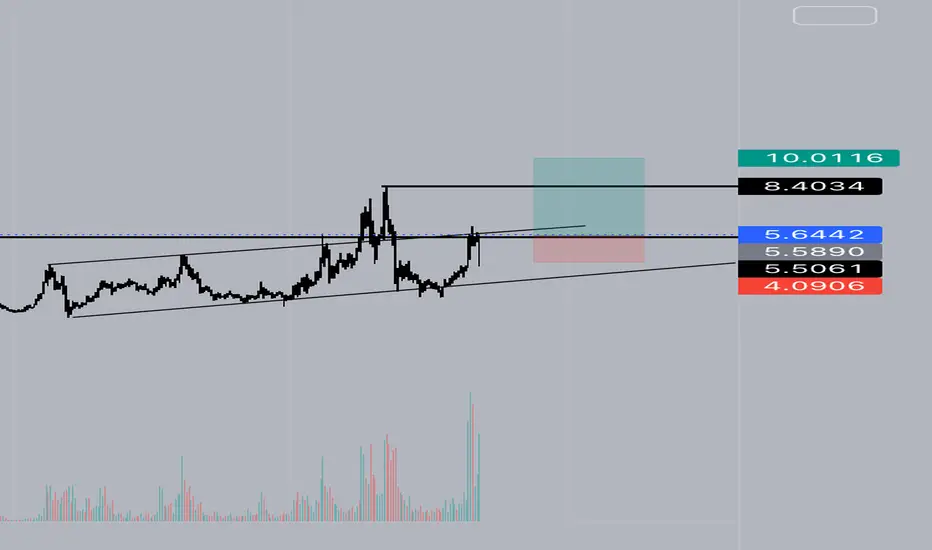
(XTZUSD 1W Chart)
If the price holds above the 173723670 point, it is expected that the uptrend will continue.
In particular, if the price is maintained above the 4.09144691 point, it is expected to create a new wave.
(1D chart)
It broke above the critical point of 5.67605181 and continues the upward trend.
It is necessary to hold the price above the 6.02334096-6.86318075 zone and see if it can lead to an upward movement above the 8.74937308 point.
If it falls in the section 4.419243-4.95476492, Stop Loss is required to preserve profit and loss.
However, it is possible to touch near the 3.34063 point and rise, so you need to think about how to react.
If you cannot find a way to respond, it is recommended to lower the Stop Loss ratio to preserve profit and loss.
-------------------------------------
(XTZBTC 1W Chart)
If the price rises above the 6690 Satoshi-14931 Satoshi section, which is the bottom section, and maintains the price, it is expected to create a new wave.
However, it is expected to be possible only when it rises above the 17620 point, which is the point of the volume profile that has been formed.
(1D chart)
We need to see if we can get support from the 14931 Satoshi branch.
If the price is maintained above the 14931 Satoshi point, a movement is expected to cross the downtrend line as it rises to the 16860 Satoshi-17620 Satoshi section.
If it goes down, we should see if it finds support at the 12110 Satoshi point.
------------------------------------------
We recommend that you trade with your average unit price.
This is because, if the price is below your average unit price, whether it is in an uptrend or in a downtrend, there is a high possibility that you will not be able to get a big profit due to the psychological burden.
The center of all trading starts with the average unit price at which you start trading.
If you ignore this, you may be trading in the wrong direction.
Therefore, it is important to find a way to lower the average unit price and adjust the proportion of the investment, ultimately allowing the funds corresponding to the profits to regenerate themselves.
------------------------------------------------------------ -------------------------------------------
** All indicators are lagging indicators.
Therefore, it is important to be aware that the indicator moves accordingly with the movement of price and volume.
However, for the sake of convenience, we are talking in reverse for the interpretation of the indicator.
** The wRSI_SR indicator is an indicator created by adding settings and options to the existing Stochastic RSI indicator.
Therefore, the interpretation is the same as the traditional Stochastic RSI indicator. (K, D line -> R, S line)
** The OBV indicator was re-created by applying a formula to the DepthHouse Trading indicator, an indicator disclosed by oh92. (Thanks for this.)
** See support, resistance, and abbreviation points.
** Support or resistance is based on the closing price of the 1D chart.
** All descriptions are for reference only and do not guarantee a profit or loss in investment.
Explanation of abbreviations displayed in the chart
R: A point or section of resistance that requires a response to preserve profits.
S-L: Stop Loss point or section
S: A point or section where you can buy to make a profit as a support point or section.
(Short-term Stop Loss can be said to be a point where profit and loss can be preserved or additional entry can be made through split trading. It is a short-term investment perspective.)
GAP refers to the difference in prices that occurred when the stock market, CME, and BAKKT exchanges were closed because they are not traded 24 hours a day.
G1 : Closing price when closed
G2: Opening price
(Example) Gap (G1-G2)
XTZUSD trade ideas

XTZ 1Dtezos daily pattern.
self explanatory. do this on the 4H
this is the ratio for the 618 blablabla

Tezos Hype Train ATH HERE WE COME!If you compare TEZOS to the great ETHER and SOL sir this coin is an absolute gorilla
Lots of room to run when we successfully breach the orange level. Moonbois and institutions want SPEED and Instant ACCELERATION
This my friend is the real ETHEREUM KILLER
This is where the GOATS are in the GREAT TEZOS from all the walks of life
If SOL had Steph Curry then TOM BRADY would be TEAM TEZOS by now
YA feel me!!
Elliot wave Technicals
Potential Leading initials of of (3) in development
TOP 10 incoming

TEZOS straight to $40 in one pumpThe price suppression of tezos reminds me of TESLA during 2015-2019
bears,non believers fudding into multi year price consolidation
Mark my words we will see the biggest fomo is come on tezos
Imajin not being long on the blockchain that Ethereum wants to reach technologically
Get your lotto tickets here under 2 digits
MULTI-GENERATIONAL WEALTH INCOMING

XTZ/USD Cup & Handle Sure looks that way to me. If this can close above the resistance level ($6.50) then its gone!


XTZ You know what time it is...XTZ finna pahmp.
Not financial advice, I am poor, you will be too if you listen to me...

XTZ- the big long Easy money longing the top of the range. “Dont fomo” mentality will get you left in the dust
XTZ/USD: UpdateTezos it's bullish!!! I decide to down my target to $8 USD as $12 USD it's so long run up. But $8 dollar it's very well for me!!!
So, I'm enfocous by Daily timeframe and Tezos it's ready to explode in the next weeks to months.
And remember, we're in profit in Chainlink. For that, I have open trades in Chainlink and Tezos. Meanwhile Ethereum make volatile movement that it's not very easy to catch a long posiiton as Ethereum it's becoming very volatile and make movement fast.

XTZ/USD: The last confirmation to buy Tezos!!!Tezos it's look so bullish in Daily timeframe. As I'm from $5.27 USD since past week. I believe that Tezos it's prepare to go to pump to $8 dollar soon
Now, I want to share the H4 period where I look that Tezos it's making a curve pattern to make a bullish movement like a styrocket. This it's so interesting how the market structure it's explain that Tezos it's preparing to climbing soon.
So, there's not much update, the only update it's that Tezos made the last confirmation to buy now in Daily timeframe as Tezos will explode soon.
I keep my SL at $4.80 USD, but very protected my long entry. I'm in profit in Tezos and also in Chainlink, my two trades for the moment.

MY MINIMALIST CHART ANALYSIS FOR $XTZ9.6.21
My Minimalist Analysis of $XTZ
Indicated are key levels of support and resistance using small and large range boxes TO ENTER A SWING TRADE (Short - Long).
Watch out for patterns, EMA, and your Fibs.
Further Analysis on price action is required on a 1HR-4HR chart when entering or closing a trade, depending on your risk appetite and trading style.
Disclaimer: The findings/predictions of the following analysis are the sole opinions of the publisher of this idea and must not be taken as investment advice.
If you like my published ideas and for more daily analysis, you can support my work by pressing the like and follow buttons on Trading View and Etoro Platforms.
Thank You for your appreciation and support.
www.tradingview.com
etoro.tw

Tezos XTZ LongIt looks like volume is starting to gradually increase on average over the weeks. Combine the hold of the bottom trend line with its increasing popularity thanks to the coin's advertising and it could fly. Once it gets over all time highs who knows where it can end up. I like the nice big recovery pop over the last few weeks too.


XTZ/USD: UpdateIn this update, I make a long position in Tezos and I decide to keep this posiion toward $12 USD in my exactly point to take huge profits. For that, Tezos has a nice opportunity to keep this position to long as Chainlink do. My SL it's around of$4.69 USD. For that, I will keep this position to hold until touch the $15 USD. This it's a huge potentail profit of 124%.
Now, in Daily timeframe, if we closed up the Daily Candlestick in the next 2.28 hours. We could to conclude if that form a bullish signal, Tezos could to climbing in the next days.
And also, I'd reccomend to watch the monthly timeframe. Because Tezos it's look extremely bullish to run to the way of $12 dollar.
So guys, at the moment, I'm in two trades; Chainlink and Tezos that look with interesting perspective to longs. Now, any change of the trade I may to inform in this media.

Tezos it's extremely bullishTezos it's look so bullish to reach the historicla maximum price of $11.85 USD since past 3 years. For that, Tezos it's so bullish by long term

XTZ/USD: Long opportunityTezos it's moving to uptrend. Now, you can to buy and entry yo long position now. I put my SL at $4.68 USD and target at $9 dollar.

XTZ Entry long out of the 50% zoneExecuted a Buy Stop order on Coinbase Pro today (first one) at $5.11 based on price exiting the 50% zone. TP set at the 1.272% fib extension level at $6.63. When TP hits profit of about $75 on a $250 investment.

XTZ Buy a break setup.XTZUSD - Intraday - We look to Buy a break of 5.781 (stop at 5.588)
Daily signals are bullish.
There is no indication that the rally is coming to an end.
A break of bespoke resistance at 5.750, and the move higher is already underway.
Our outlook is bullish.
Our profit targets will be 6.348 and 6.448
Resistance: 5.750 / 6.000 / 6.125
Support: 5.400 / 5.300 / 5.000

Tezos ($XTZ) New FIBTezos ($XTZ) BULLS did some significant work on the 50MA and 200MA where we can see the Golden Cross "on the horizon". BULLS are buying up everything and sellers are few. Pretty amazing upwards price action

XTZ.USDT (Y21.P5.E1).Macro outlookHi All,
XTZ has been really pumping of recent because of the projects its involved in.
I see it in a macro channel and its likely to break above it in the coming weeks\months.
Articles says 3 reasons.
Protocol upgrade reduces transaction costs > he most recent 'Granada' upgrade was implemented on Aug. 6.
Real-world adoption driven by 2 large banks
Attractive staking rewards reduce the circulating supply
All the best,
S.SAri


XTZUSDT in 28hrs next SHORTXTZUSDT in 28hrs next SHORT
In cycle, this pair must have 24hr more for reverse to main line (5$)
