I'm bullish in Tezos!!!Tezos it's so near to break out inminent. I decide to trade Tezos until 2 specific target. You can to get the target until $5.76 USD or keep this position until the $7.70 USD to touch the maximum price. Tezos price it's around of $3.50 USD and I buy 234 Tezos contract in Simple FX using my Cardano account to accumulate it.
Recently, I have accumulae 2,000 Cardano coins in my Simple FX account, that it's sum with 10,000 Cardano coins. But I want to talk about of one Cardano strategy that will be good for you and how you can to accumulate Cardano, and use this Cardano generated by your trading account to invest and hold by long term. This strategy it's called accumulate 1,000 Cardano coins, repeating tis proccess to get 1,000 Cardano coins and withdraw and generated another 1,000 Cardano coins.This it's fabolous for you if you beleive that Cardano it's your best cryptocurrency. MY GOAL IT'S TO REACH 20,000 CARDANO COINS.
s3.tradingview.com
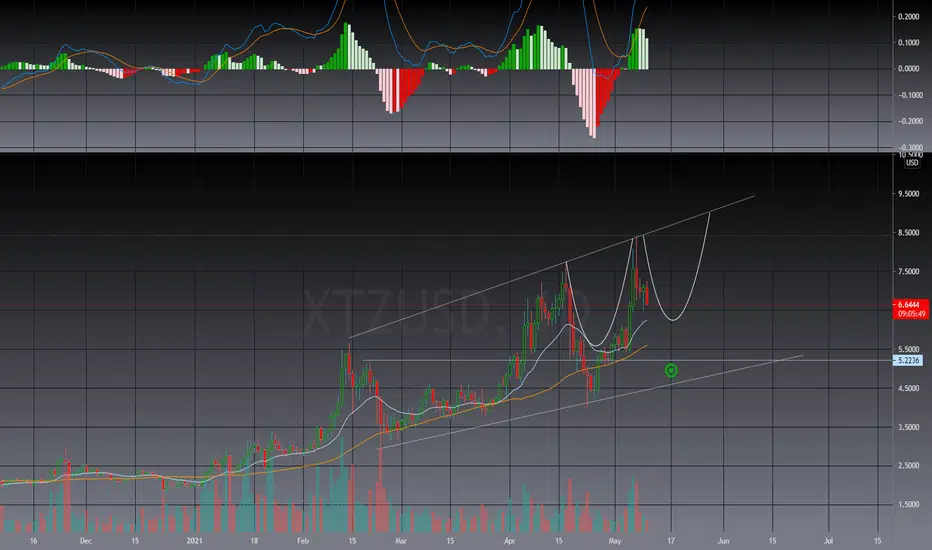
This was the yesterday analsyis of Tezos, we see that Tezos it's look extremely bullish to $7.70 USD.
XTZUSD trade ideas

Tezos it's following this trend line to bull market!!!Tezos it's look good to trade, hold and invest in the $3 USD approximately. I like this cryptocurrency and I admire this cryptocurrency and it's so similar with Ethereum or Cardano, but in the future, I interesting to know more of this cryptocurrency to invest by long term. But my main enfocous it's in Cardano, but in the future, this cryptocurrency show us that it's a solid cryptocurrency that you can to invest now or in the future if you have your main cryptocurrency working day to day.
Tezos could to go back to $8 USD in few weeks.

XTZUSD - Bullish Opportunities !Welcome to our Trade Setups - June 07th ( XTZUSD ) !
BUY XTZUSD
ENTRY LEVEL @ 3.8102
SL @ 2.3118
TP @ 8.3049
Max Risk: 1% - 3%!
Risk/Reward Ratio: 3
Leave us a comment or like to keep our content for free and alive.
Have a great week everyone!

XTZ $2 levels rejectinXTZ is in a clear $2 price level rejection. I think its a very significant red rejection candle on the daily. Bigger positions are most likely cashing out and accumulating orders right now. Prices will try to retest $5 levels again, and if sustain, move even higher on further accumulated buying activity
LONG ON XTZ

Weakness in XTZUSD Sell in sell zone
S < 3.33 if 1D close
1W + 1M candles closed under 3.94-4.47.
Falling was very fast and i think that many traders have been locked in zone 3,94-4,47. That's why i expect this zone as sell zone, where selling pressure will be strong.
Also i want to point zone of interest under 3.33, where good short signal (if 1D candle close <3.33) could appear.
To cancel this scenario 1D candle should close > 4.50


Last expectation: XTZ under 1.92I hope this is the final leg down, and after this the bull market will come back.
Today we had yet another dump, and I've cleaned up my graph and tried to make something out those Fibonacci's.
0.382(7.1USD) was resistance two times.
0.618(6.3USD) was resistance two times.
0.786(5.8USD) was support two times.
Once 0.786 was broken through with ease, 1(5.1USD) was support once, 0.786 became resistance, then it dumped hard.
May 19th to 24th (today)
0.236(4.4USD) was resistance two times.
Price floated around 0.618(3.4USD) with 0.5(3.7USD) being resistance.
0.786(2.9USD) was support two times.
Today at 12:30 we fell right through 0.786, to retest 1(2.4USD) as support. It held, once.
My last expectation:
0.786(2.9USD) will be retested tonight. If it continues to be resistance, we'll retest 1(2.4USD) and I hope we fall right through it (like on May 19th), in order to be saved by 0.236 of the next period (1.9USD).
Otherwise, if we come over 0.786, I might be really tempted to buy back once we're in the clear over 0.618. I see already that my previous idea linked here (If we remain under 3.32...) is somewhat being attacked, because we dumped through 2.89 but we are currently back up a bit.
Short in the short term, long in the long term.
Note: a much better view would be obtained by looking at BTC or ETH, not XTZ. But I look at this becaus this is what really interests me.
This is not financial advice, I'm just a noob that discovered Fibonacci's.
Opinions?

XTZ/USD Looking Back aLooking back at the analysis this trade gave a quite good profit range of 250% to 300% return on the spot position.
If you took a spot trade and take you profit near TOP. A big Congratulation!
Now it this a quite on the verge of transition to declining stage. Let us see what the market will do. Be Patience.


Tezos Nice Dip BuyTezos is within a MASSIVE channel on the daily chart
i expect this to correct upward and continue..
Added a line to add a bit of 3D'ness

If we remain under 3.61 or 3.32 more dumps are comingThis is in line with what happens to BTC and ETH.
My new expectation is to not buy anything over 2.9USD.
Let's get to the bottom of this!

XTZUSD D4: 350% gains BEST level BUY/HOLD(SL/TP)(NEW)Why get subbed to me on Tradingview?
-TOP author on TradingView
-15+ years experience in markets
-Professional chart break downs
-Supply/Demand Zones
-TD9 counts / combo review
-Key S/R levels
-No junk on my charts
-No MACD / RSI /MA/FIBONACCI
-Frequent updates
-Covering FX/crypto/US stocks
-24/7 uptime so constant updates
-no moonboy/crazy targets
-TA that makes sense and
-setups that payout
XTZUSD D4: 350% gains BEST level BUY/HOLD(SL/TP)(NEW)
IMPORTANT NOTE: speculative setup. do your own
due dill. use STOP LOSS. don't overleverage.
🔸 Summary and potential trade setup
::: XTZUSD 4days/candle chart review
::: CORRECTION MODE next 4-8 weeks
::: is correction over in crypto now?
::: NO it's not OVER. just started!
::: BULLS need to sit out the correction
::: best reload later near 2.50 USD
::: 40% downside remains from here
::: expecting correction 4-6 weeks
::: then expecting reversal
::: BEST RELOAD bulls is near 2.50USD
::: final TP bulls is +350% gains
::: bull run not over yet
::: BUY/HOLD setup TP +350%
::: for now bulls should stay out
::: correction mode for 4-6 weeks
::: alternatively you can DCA in range
::: do your own due dill
::: and use proper risk management
::: TP bulls is +350% gains
::: details: see chart
::: FINAL TP is 350% gains
::: SWING TRADE: BUY/HOLD IT
::: bull run not over yet
::: good luck traders!
::: BUY/HOLD and get paid. period.
🔸 Supply/Demand Zones
::: N/A
::: N/A
🔸 Other noteworthy technicals/fundies
::: TD9 /Combo update: N/A
RISK DISCLAIMER:
Trading Futures , Forex, CFDs and Stocks involves a risk of loss.
Please consider carefully if such trading is appropriate for you.
Past performance is not indicative of future results.
Always limit your leverage and use tight stop loss.

I am looking to buy some undervalued coins!XTZ looks pretty shit! It was smashed as well as the other coins but it looks pretty promising.!

ichimoku trade : short positionichimoku signal:
short position:
enter at 3.88$
stop loss kijunsen with buffer


0,786 (4USD) also a short term resistance point for XTZWaiting for the dip to keep dipping :)
Just to see this more clear, check the previous post, Patiently waiting for XTZ to go down
Opinions?

XTZUSD H16: BEST level to BUY/HOLD 100% gains.(NEW)XTZUSD H16: BEST level to BUY/HOLD 100% gains.(NEW)
IMPORTANT NOTE: speculative setup. do your own
due dill. use STOP LOSS. don't overleverage.
READ ENTIRE IDEA BEFORE BUYING!
🔸 Summary and potential trade setup
::: XTZUSD 16hour chart review
::: speculative XABCD BULLS setup
::: deeper pullback possible now
::: focus on buying re-test of the lows
::: near point D/PRZ at 3.50 USD
::: right now CORRECTION MODE
::: BUY/HOLD and get paid after correction
::: BULLS should remain on sidelines
::: until we hit 3.50 USD end of month
::: wait for the correction to complete
::: before buying low near point D
::: Speculative bullish setup
::: do your own due dill and use tight SL
::: strong mirror S/R level
::: get ready to BUY low / hold it
::: 100% gains possible from my level
::: strategy: BUY LOW after pullback
::: TP bulls is +100% gains BUY/HOLD setup
::: buy near my level and get rewarded
::: TP bulls is +100%
::: good luck traders
🔸 Supply/Demand Zones
::: dem/supp N/A
🔸 Other noteworthy technicals/fundies
::: TD9 /Combo update: N/A
::: Sentiment short-term: BEARS/CORRECTION MODE
::: Sentiment outlook mid-term: BULLISH
RISK DISCLAIMER:
Trading Futures , Forex, CFDs and Stocks involves a risk of loss.
Please consider carefully if such trading is appropriate for you.
Past performance is not indicative of future results.
Always limit your leverage and use tight stop loss.

TEZOS CRYPTOCURRENCYWE ARE BUYING THE CRYPTOCURRENCY AS THERE IS MORE CHANCES FOR THE CRYPTOCURRENCY TO RISE IN PRICE

Patiently waiting for XTZ to go downSold at 7.5USD, will buy more at 5USD. It seems to be a good support, corresponding to BTC at 42k.


Tezos Accumulation and PatiencePotential Targets:
Buy More At: $5.00
If Broken,
Buy More At: $4.5
Long Term Bullish

