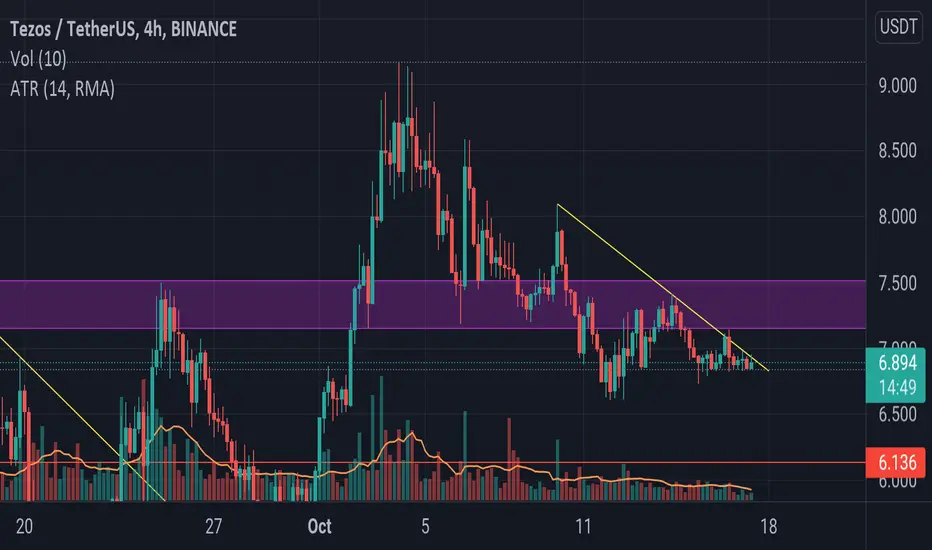
XTZUSDT WILL BREAK FALLING WEDGE?My trading plan by using falling wedge pattern as stated below:
Confirmation Entry when Break above white line.
Target is next resistance (green dash).
Stop Loss if fall below red line.
#TAYOR HUOBI:XTZUSDT
XTZUSDT.P trade ideas

XTZ broke symmetric triangle 9.9 TPT.Hello friends, bull flag on XTZ, RSI broke and symmetric triangle breakout, target 9.9
Follow and like for free breakout signals (:

XTZ going to break all time highsXTZ looks like it has already started or is about to do a reversal of its down trend. It has been in a down trend since the start of October, but sign are showing up that it is about to reverse.
As of the time of writing, the chart shows that it has broken above the trendline of a bearish wedge triangle. ( I hope the daily candle closes above the trendline).
Stoch is also very very low, last time XTZ's stoch was at this level, BTC was around 30k and XTZ has went up 300% since then.
Current price is also sitting around 0.382 fib level, which shows we are currently in a support area.
If daily candle closes above the wedge, then there is a high chance we touch 10.600 price point before seeing another consolidation or retest of supports.
However, if price does not close above the wedge, then we would have the chance to buy some more at around 6.150 price before bouncing hard to new ATH.

$XTZ breaking outXTZ made a new all time high earlier this month.
Good chance this is the end of the correction.
Price has broken out of its descending triangle.
Expecting to retest previous resistance levels.

XTZ great increaseAs I said in the previous idea XTZ is necessary to break the green resistance line to increase the price.
The chart shows that the green line is both a bear trend channel line and a falling wedge line.
It can also be seen that the price is currently trying to bounce off the blue trendline and break the green resistance line, and that the RSI has bounced off the orange ressistance line.
I am bullish and I think that today during the day the price will break the green resistance line and go significantly up.
For long
TP1: 7.400 (0.786 Fibbonachi)
TP2: 9.080 (1 FIB)
TP3: 11,000 (red resistance line)
TP4: 13.600 (1.618 FIB)
Disclamer: This is not financial advice.
You trade at your own risk.


Lovely XTZHi guys.. Today I brought you the analysis of a valuable but a little lazy currency, buy it in two steps and wait until you are successful ... The first goal is ten dollars😉

XTZ/Tezos looks super bullishIt seems that XTZ just finished its wave 2 on a 4h time frame that would lead to a snowball of waves 3. As you can see it looks like it completed à triple combination and wave 2 would end up perfectly at 78.6% of wave 1. Not only that but the last move would be perfect ratios too since Z would be 78.6% of Y and C would be 123.6% of A.
For those that are not familiar with Elliot you could also see a beautiful bullish wedge.
I would wait for further confirmation with a breakout of the upper channel and would be completely bullish as soon as XTZ trades above the last "X" at 7.432.


XTZ 8H : BEST TIME TO BUY AND HODLHello Everyone, If You Like The Idea You Can Support With A Like And Comment .
Keep In Mind ❗
🟣 Purple structure -> Higher TimeFrame Structure.
🟢 Green structure -> Daily Structure.
⚫️ Grey structure -> 4h Structure.
🟡 Yellow structure -> <4h Structure.
Important : Please Use RM (Risk Management) and MM (Money Management) If You Decide To Use My Ideas, There Will Always Be Unprofitable Ideas, This Will Definitely Happen, The Goal Of The System Is That There Will Be More Profitable IdeasXt A Distance.

XTZ is going to break up the trendline and explode 🤯🚀Xtz has been going down for a while and has found its support on 6.81. I think accumulation is done and soon it will break up the trendline 🚀
XTZ close to breakout downtrendGood support of 200 MA on 4h.
Expect to break a downtrend on Monday the latest.

XTZ 4hr AnalysisXTZ looking really bullish as it sits just above the 0.3 fib level being the refill zone. A breakout is imminent

🔥 XTZ Long-Term Bullish Channel: UpdateOver 2.5 months ago, I made a long-term analysis on XTZ and the bullish channel it has been trading in since it's inception.
It appears that investors were watching the exact same channel. Since the price touched the upper resistance of the channel, XTZ has seen a bearish move to the downside.
Assuming that the price will follow the channel in the coming weeks, I'm expecting a move towards the green reversal area. This would also be the area where potential investors will be stepping in again.
However, I'm aware that the current market outlook is overly bullish. So there's a decent chance that the price will never reach this reversal area. In case of a bullish move, I'm looking for a break out of the channel and the re-test following that break out. A positive re-test would be a great signal for the price to continue going up.
Long term bullish target: $20.
Happy trading!

XTZ // Tezos Looks like Tezos will test again ATH at 2017
10$ it's target and i'm waiting for new Higher High
fib. 61.8
R;R 8


xtzusdtHello everyone 😃
Before we start to discuss, I would be glad if your share your opinion on this post and hit the like button if you enjoy
4 hr

XTZ 🤑🤑 ALL THE WAY🚀🚀Another BULLISH moment for one of the most potential altcoin. I personally hope for a BULLISH trade, but if things goes sideways, I believe it take a fall to the bearish potential target before picking up for BULL.
And plz always remember proper risk management for proper trading. A good trader trades with strategy and great risk management, wish you luck


XTZVery bullish on XTZ for the mid term .
If we close a 4h candle bellow the blue line it could indicate that we’re going down .
Target : 8.5$

XTZ shortwhat is better than an engulfing candle stick pattern right at the resistant zone and upper median line of a pitchfork for a short position which is rejected at 50 level rsi? what could possible go wrong ;)?

