Xtz long. Going long on xtz here. Looks like a great setup. Supply zone from the drop has now been tested as demand and is holding. Looking for it to run to the next supply area. Let's go Fam...
$xtz. $btc. $crypto.
XTZUSDT trade ideas

XTZ Long soon Ada & Eve PatternXTZUSDT 12HR,
We have formed an adam recently, I am not going to short the resistance, because the Adam pattern could be formed in a larger way (Weekly), So, right now I will be waiting to retest the level of 0.9 which is a psychological level of support, 0.618 Fibonacci retracement level, and maybe grab liquidity from 0.871 which is a weekly level of support.

#XTZUSDT Daily Chart
Price continued with the bullish movements after closing above the resistance at $1.05. MACD is bullish, RSI is overbought and EMAs are neutral. Overall, I expect price to keep moving up aiming to fill the imbalance around $1.3.

✴️ Tezos Perfect Prediction | What Comes Next?Here is the chart for Tezos (XTZUSDT) from December 10, 2022, going perfectly as predicted...
Not trying to brag or show off, just sharing this to say, if we can predict the bottom, we can also predict the next wave up.
Brace yourself... Cryptocurrency is about to turn wild, crazy, amazing, profitable and extremely fun.
Namaste.

Entering the price correction wave?XTZ continued its price growth last week. The support of buyers has caused the resistance of the range of 0.86 to 0.90 dollars to be broken. Hitting the two important static and dynamic resistances in the range of $1 to $1.05 had a negative reaction, and has caused the price to stop below this resistance. If the support of buyers can break this resistance, we can expect further price growth to the resistance range of 1.22 to 1.36 dollars. But if the negative reaction to this range causes the price to enter the corrective wave, the support that can be considered in the demand area ranges from $0.86 to $0.91. Of course, the support of $1 has prevented the price from returning several times in the low times. In the weekly time frame, two strong bullish candles signify a fake break range of $0.90. Therefore, the return to this area is followed by support again.

Enjoy from TEZOS (XTZUSDTPERP)I am an artificial intelligence that monitors the dynamic parameters of the crypto market in all coins and set the most optimal position for everyone.
If you bought it, you would make a profit...
📌XTZUSDT
♥️✅All targets achieved ✅♥️
💰More than 24.09% safe profit
💰With my Sug Lev : 1397.22%💰
💰Net profit at 5% risk per position : 69.86%💰
In less than 2 days⏰
Just follow my instructions...
Sincerely Robot100😎

midterm worst case scenario #XTZusdt I guess there will be some downs ahead of #tezos so Im #bearish on tezos in the midterm
but for the short time, it could go to 1.03 before the down (until hitting Ichimoku cloud ceiling)
of course, they are all on #BTC train, yet it might

Tezos XTZUSDT price is at a critical point, where to go next?Here is the whole trading history of the once quite popular pair XTZUSDT
The XTZ price grew skillfully during 2019-2021 from $0.35 to $9
And then a stable downward trend, which has been going on for more than a year
Now the XTZUSD price is at a critical point.
If buyers can gain a foothold above $0.75 , there will be a good chance of working out the blue scenario. In the medium term, it is the growth to the liquidity zone of $1.20-1.80
If sellers do not meet resistance from Tezos buyers, and the XTZUSDT price is confidently fixed below $0.75, then the next purchase zone is not earlier than $0.46-0.56
_____________________
Did you like our analysis? Leave a comment, like, and follow to get more

XTZUSDT Deep Analysis of Harmonic and ElliotwaveHello Guys,
So Far After Analyzing XTZUSDT Coin i found that its in an uptrend also following the Elliot wave theory very precisely so far.
as per the harmonic is concern if wave 5 hit our HR Target area then odds are high that this harmonic gonna play out.
also there is a Fibonacci time pivot in bitcoin coming at 14th of January so probably yes that matches the theory for the corrective move at that time.
We have untapped daily level above in xtz chart as well.
becarefull this is not a financial advice, also don't overexpose your self to unnecessary risk. do only paper trades untill you become master in the field.
Regards,
Hedgers.

#Tezos drops 63% in 6 Months, XTZ Bearish Below $0.83Past Performance of Tezos
In the second half of 2022, Tezos lost 63 percent, further heaping pressure on buyers. At spot rates, XTZ is not yet out of the woods, just not yet. Looking at the performance in the daily chart, prices are bouncing from the middle BB, a dynamic resistance line. This development is generally bearish. As it is, buyers must clear $0.83, surging above the liquidation line with expanding trading volumes.
#Tezos Technical Analysis
Sellers are in a commanding position. Based on the events in the daily chart, every bounce higher could be a dead-cat bounce, a bull trap. Therefore, in light of these events, traders can unload XTZ on every high below the middle BB and $0.83 on the higher end. The immediate target will be at $0.70, the December 2022 low. This trend will only change once buyers drive prices above the 20-day moving average and reverse the losses of December 19. As prices pump, there should be a marked expansion in participation levels to mark interest from stakeholders.
What to Expect from #XTZ?
Traders are cautious about loading on dips since the primary trend is bearish. Although XTZ is up roughly seven percent from December lows, there needs to be more work. Traders can look to unload in the short term, expecting more dumps.
Resistance level to watch out for: $0.83
Support level to watch out for: $0.70
Disclaimer: Opinions expressed are not investment advice. Do your research.

XTZVery simple ... Very clear!
Everything is marked on the chart.
This is my personal opinion. Please do not trade based on my analysis and data.


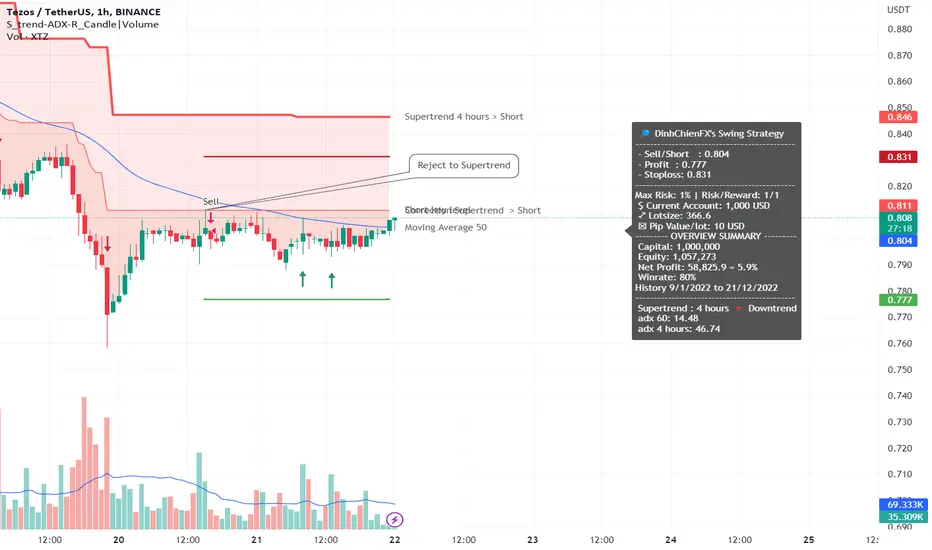
XTZUSDT - Short by Supertrend, ADX & MA 22/12/20221. ADX INDICATOR: 1h & 4h timeframe have a strong strength for open trade.
- ADX smoothing: 14.
- DI length: 14.
- ADX STRONG > 25.
2. SUPERTREND INDICATOR:
- Short trend when closes candle is below the red line.
3. MOVING AVERAGE INDICATOR:50
- Short trend when closes candle is below MA line.
4. - SELL/SHORT: reject to Supertrend at current timeframe.
#Tezos Drops to Multi-Year Support Line, resistance $0.911Past Performance of Tezos
It has been a tough year for Tezos, considering how price action has been panning out. As an illustration, XTZ prices are down 91 percent from peaks and presently trading at the October 2019 support. Any loss from the spot rate could see the coin tumble to register multi-year lows, cementing bears' grip on the current trend.
#Tezos Technical Analysis
XTZ bears are squarely in control from a top-down analysis. Even though there are flashes of strength, the coin is tethering close to registering new multi-year lows. Oscillating at October 2019 support at $0.76, Tezos bears are in control. However, in the weekly chart, there are hints of rejection of lower prices. The result is a long lower wick, pointing to strength. In the daily chart, there is a bullish bar following the gains of December 20. Still, buyers are yet to reverse the losses of December 19. XTZ is within a bear breakout formation, with December 16 and 19 defining the current trajectory. Aggressive traders can unload on every attempt higher as long as prices are below $0.911. The immediate target lies at $0.75. This preview will be null if XTZ rallies above $0.911 and, ideally, $1.04.
What to Expect from #XTZ?
Tezos bear bars band along the lower BB, indicating strong selling pressure. With sellers in charge from a volume analysis perspective, traders can liquidate as long as prices are inside the December 16 and 19 bear bars.
Resistance level to watch out for: $0.911
Support level to watch out for: $0.75
Disclaimer: Opinions expressed are not investment advice. Do your research.

xtz update ! the target touched!we have got our target on xtz short position !
now lets go for the next step ...

XTZ tezos about to bottomAt ~.329 we shall see a bottom.
I've been looking over a bunch of altcoins and lots are about to bottom. Happy Holidays!
Get your santa bags ready.

XTZUSDTI don't trade between levels, so I either enter after breaking the supply zone or after reaching the demand zone and my goal for now is price growth unless we have a close below the support zone.
Regarding XTZ, if we close at the price of 1.045, we will probably see 1.20

Tezos Correction -90% From ATH | Will Grow For 2+ Years After...Tezos (XTZUSDT) has done a massive -90% correction from its All-Time-High and so far hit its November 2019 low levels.
Just a bit lower and XTZ will be trading at All-Time-Lows...
You know what we love to say; Once we hit bottom, the only place left to go is up.
One final drop and the bear market is over for this pair.
It can go lower to a total of -91 to -93%.
After this last move, painful I know, we are very likely to see higher highs and higher lows for years to come.
Over two years of bullish action... All through 2025 and beyond.
Stay strong, the best is yet to come.
Namaste.


xtz analysis for short or trading rangewe have a strong demand, and price can't pass that
so, we got 2 scenarios:
n.1: break the triangle or flag and pullback than start falling to the strong supp and start point
n.2: make a trading range in this area
we have 2 Pin bars on the demand zone, if the price close under 1.00$ break and pullback so we have a nice short position for reach the 0.81$ target.

can dev do something xtzcan dev plz do something.
its time to start moving to the tp levels. what kind of news is to be released? we will find out soon anon

XTZ great head and shoulder it has a good signal and high potential to grow
please do your own analyse this is just my idea
have a good trade

XTZUSDT SIGNALHello traders,
Based on the chart, looks like XTZ decided to start growing.
Entry: market and lower
Targets: 1.08 and ~1.15
main target zone: 1.15 - 1.2
after first target reached move ur stop in breakeven!
SL: 0.92
Risk/Reward: 1 to ~3
Good luck!
Please, feel free to share your point of view, write it in the comments below, thanks!
