XTZUSDT - 1D Long Signal💡💡#SIGNAL 💡💡
XTZ / USDT
▶️ Buy NOW + Block
🔴 SLT - 1D (Trigger)
There is an uptrend on 1D and 4h. I think we should see a shot up soon.
#XTZUSDT_1D_020722
XTZUSDT trade ideas

XTZUSDT | BULLISH PARALLEL CHANNELXTZUSDT has been trading in bullish parallel channel . Recently price has approached to the bottom of the channel and bounced back. The overall trend is bullish .
We are expecting the upper boundary of the channel to be targeted by bulls. The break above upper boundary will favor bulls. While any rejection from upper boundary will give strength to bears and price may fall to horizontal support zone .

XTZUSDTHello Crypto Lovers,
Mars Signals team wishes you high profits.
This is a one-day-time frame analysis for XTZUSDT
In this chart, we have R2 as our resistance line and the disability of the price to rise is seen. R1 used to be a support line and even S1 and S2 are our other support lines that express the support of the price at some points. At the present, the price is fluctuating in R1 area and we believe it will fall toward the bottom of this area and then it will experience a rise to R2. The lowest amount of R1 is the point that we can consider our long position. If the price fixes over R1, then we predict more rise for it to R2. Even it is possible for the price to face more decline when it reaches S1 and it can move below it (which is not so probable at this time).
Warning: This is just a suggestion and we do not guarantee profits. We advise you to analyze the chart before opening any positions.
Wish you luck

XTZUSDT is testing the 0.618 Fib level1D Timeframe: Correction
After an bearish impulse, the price is testing the 0.618 Fib level on 1D timeframe after a bouch from
The price is testing the 0.618 Fibonacci level on the 1D timeframe after a bouch from weekly's support
4HTimeframe: Impulse
The price is testing the 0.618 Fib level on 4H timeframe after a bounce from the local support (4h support at $1.35)
The trading plan :
If the price is going to breakout the descending trendline on 1D timeframe, and retest it as a new support, we will consider to set a nice order.

XTZPrice double bottomed and nailed the 50 and 100 MAs. Growth may continue to 200 MA and the indicated trend line

XTZHello everyone. its my expected scenario of XTZ. I myself set alarm for taking position for Tezos.

Imbalance on XTZ chartThere's an imbalance on the Tezos $XTZ charts that need and will be filled.
Expect sharp price movement upward!
Entry: your choice
Exit/TP: 1.432
SL: 3% of your entry
good luck!

XTZUSDT needs to recover the monthly supportthe price lost the ascending channel after the market got liquidity for a bearish impulse from the 2.2$ level.
Now the price is testing the 1.4$ below the monthly structure.
How to approach it?
The price needs to flip the monthly resistance into new support, According to Plancton's strategy , we can set a nice order
–––––
Keep in mind.
🟣 Purple structure -> Monthly structure.
🔴 Red structure -> Weekly structure.
🔵 Blue structure -> Daily structure.
🟡 Yellow structure -> 4h structure.
–––––
Follow the Shrimp 🦐

Tezos 6.27.22Looking for a move back up for the king tezos. Beautiful bottom structure, respecting the charts and tools perfectly. I like the way that tezos charts out with bitcoin. It makes things easier to read much like the Ethereum chart was easier to interpret than bitcoin. Wants to test some old support and attempt to flip it back into support

XTZ/USDTXTZ / USDT
Form a reverse head and shoulders and break your dynamic resistance line.
To complete this pattern, we will be able to increase the price up to $ 1.7.
#XTZ #XTZUSDT #BTC #BTCUSD #LUNA #LUNC #UST

XTZ BULLISH <LONG POSITION>Going long on XTZ/USDT on a 5x leverage. Entry, take profit and stop loss on the chart. Do your own research and remeber BTC determines the market trend.


$XTZ/USDT - Long - Potential 42.72%$XTZ/USDT - Long - Potential 42.72%
Exchanges: Binance, Bittrex, Huobi.pro, KuCoin
Signal Type: Regular (Long)
Entry Targets:
1) 1.39677 - 100.0%
Take-Profit Targets:
1) 1.462 - 50%
2) 1.541 - 30%
3) 1.995 - 20%
Stop Targets:
1) 1.176 - 100.0%
Entry Trigger - Binance supported network upgrade
Trailing Configuration:
Entry: Percentage (0.0%)
Stop: Breakeven -
Trigger: Target (1)

⚡️ #XTZ/USDT - Potential 600% ⚡️⚡️ #XTZ/USDT - Potential 600% ⚡️
Entry Conditions:
- Bullish divergence on long term support
- Binance Supporting Upgrade
- Deeply Oversold and nearing the bottom
- Optional to wait until breakout of long term trendline
Entry: 0.973 - 1.4
TP1: 2.25
TP2: 3.97
TP3: 5.3
YOLO: 7.1
SL: 0.74 or HOLD

#Tezos Resistance at $1.54, XTZ Prices in a Bear Flag FormationPast Performance of Tezos
Tezos prices are trailing the USDT after a relief rally. At spot rates, the coin remains within a bear breakout formation, sliding six percent in the last trading week. In the immediate term, the primary support and resistance levels lie at $1.22 and $1.54, respectively.
#Tezos Technical Analysis
From the daily chart, sellers are in a commanding position. XTZ prices are tracking lower in a descending channel within a bear flag. With sellers unwinding gains, traders can wait to trade the breakout in either direction. Preferably, the surge in either direction can be with rising trading volumes. A close below $1.22 will nullify the bullish outlook, confirming sellers of June 13. In that case, XTZ may slide to $1.20 and even $1.10 in the medium term. Conversely, gains above $1.54 may see Tezos bulls drive prices towards May 2022 lows at $1.64.
What to Expect from #XTZ?
Buyers are confident, but bulls are struggling to tame the wave of recent liquidation. While recent gains may slow the sell-off, a break above $1.54 is required to restore traders’ confidence.
Resistance level to watch out for: $1.54
Support level to watch out for: $1.22
Disclaimer: Opinions expressed are not investment advice. Do your research.

XTZ Potential Reversal SoonXTZ is one of the most legit projects in the crypto space.
I have a short term price target of $1.86 and $3 by the end of the year.
Looking forward to read your opinion about it.

XTZThe price is at the lower border of the channel at the Fibonacci level of 78.6%. Bullish scenario - price rebound to the upper border of the channel and the Fibonacci level of 61.8%. The bearish scenario will reduce the price to the level of 100% Fibo

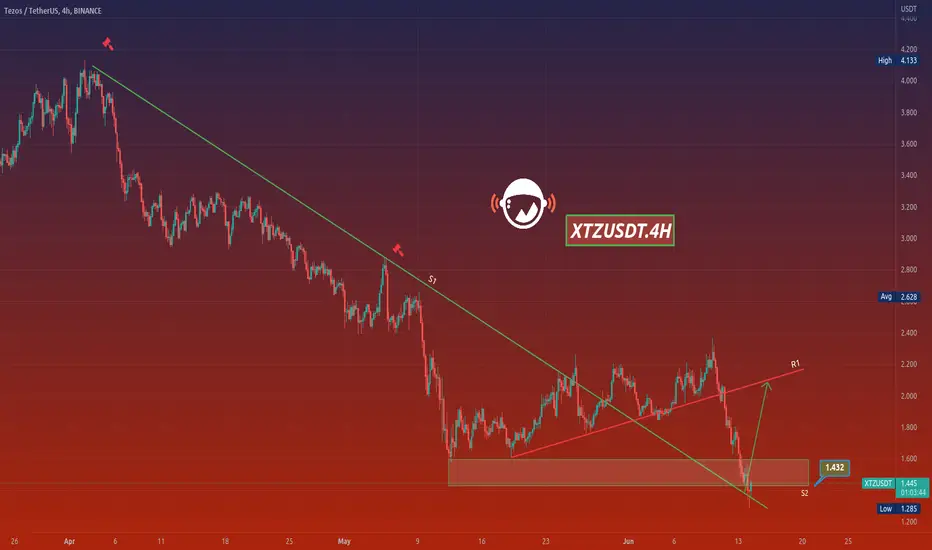
XTZUSDTHello Crypto Lovers,
Mars Signals team wishes you high profits.
This is a 4-hour-time frame analysis for XTZUSDT
As we predicted a falling trend in our last analysis on May 29, we observe here that it came true. In the current chart, we have S1 which used to be a resistance line and also R1 used to be a support line which shows the well support of the price at several points. Now the price is fluctuating below in S2 area and on S1 line and we expect this is a pull back of the price to S1 and then we will have a rise for it to R1 line. But if the price moves below S1 and fixes there, then we will have more decline for it.
Warning: This is just a suggestion and we do not guarantee profits. We advise you to analyze the chart before opening any positions.
Wish you luck
XTZUSDT: Bearish Channeling, Bearish Bias doesn't end yet?Hello Fellow Tezos Coin Investor/Trader, Here's a Technical outlook of XTZUSDT!
Support our content by smashing the like and follow button, you also can share your opinion in the comment section below.
XTZUSDT is creating a bearish channeling. Furthermore, The MACD indicator created a death cross, which confirmed a potential downside momentum to the target area.
All explanations are presented on the chart.
The roadmap will be invalid after reaching the target/resistance area.
"Disclaimer: The outlook is only for educational purposes, not a recommendation to buy or sell the cryptocurrency"

XTZ is in a Rising Wedge...what will Happen?XTZ is in a Rising Wedge Pattern. This is Of course a bearish Pattern which means we Should Expect the Price to Reach Lower Levels Even From Now! The Price can Decrease and It Should be Clear To you That No Break Out Has Happened yet So It is not Safe to Take Short Position (For Now!) There is also a Regular Bullish Divergence (-RD) on MACD which Strengthen The Idea Of Tezos Being Bearish! The Expected Target and Support Point Right now Is around 1.600$
-XTZ is in a Rising Wedge Pattern
-No break out yet
-(-RD) on MACD
-Expected Price and Support Point 1.6$
_ _ _ _ _ _ _ _ _ _ _ _ _ _ _ _ _ _ _ _ _ _ _ _ _ _ _ _ _ _ _ _ _
Thank you for seeing idea .
Have a nice day and Good luck

XTZ to 1.85Keeping this one short.
Head and shoulders forming on the 4H chart and a strong RSI and CCI bearish divergence currently which XTZ reacts to wach time. Expecting a drop down to the neckline at around 1.85.

XTZ AnalysisXTZ Analysis
This is my idea. I have tried my best to bring the best possible outcome to this chart, Do not consider it FINANCIAL ADVICE.
So let's see how the market reacts in the coming days.
This chart is likely to help you in making better trade decisions
I am not a market maker I could be wrong.
Everything is on the chart.
Everything Depends On BTC Movement
Thank you

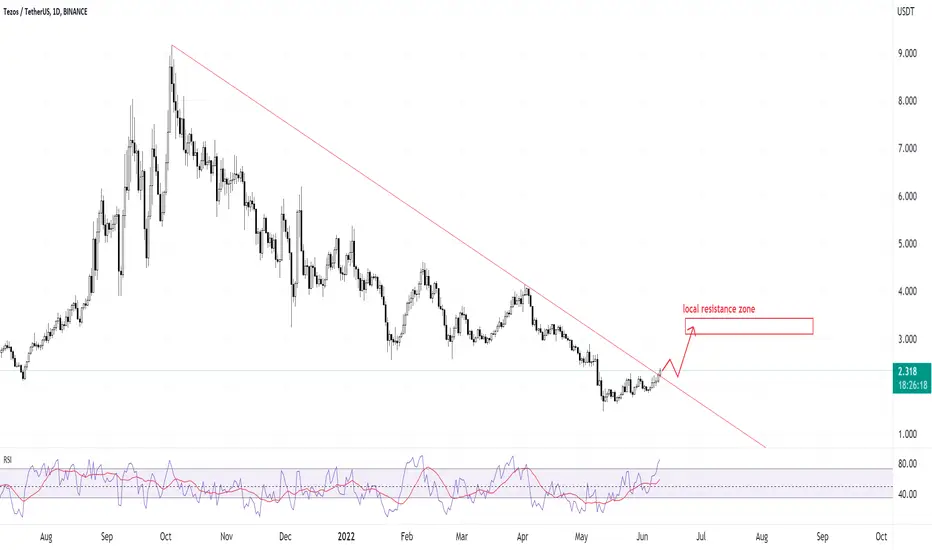
XTZ has broken the long resistance - time to go upFirst thing, red resistance line has been broken coming from many months back. Price is indicated to have a good bullish +30% to +40% in the coming month, depending on BTC stability.
In that case, I have marked the local resistance zone.
For a quicker time frame we are actually in a resistance zone right now, and it's very much possible that it will go down towards $2.00 before finally going up. But please keep in mind, overall XTZ is bullish on long term. (4-6 months)
I am linking the shorter time frame (45 min candles) chart below, so you can keep track. With the daily chart above, now you can keep track of important zones.
Good luck!
P.s. I walk the talk, and my trade performance can also be seen on the 45 min chart below. Scroll to the bottom to see my net profit in one year! and my success rate.