XTZ- Tezos Breakout
Expected to be a leader and perhaps it's time to shine like a bright star.
TEZOS is a winner.
One Love,
the FXPROFESSOR
XTZUSDT trade ideas

XTZUSDTHello Crypto Lovers,
Mars Signals team wishes you high profits.
This is a 4-hour-time frame analysis for XTZUSDT
The price started its falling trend since April 3, and after forming this long-term resistance line and reaching for at some points, it was not able to move over it and then it was rejected. Also you see the support line at the bottom which shows the support of the price at some points. At the moment, the price is fluctuating on the resistance line and we believe it will continue its falling trend toward the support line and we will have more decline in the price.
Warning: This is just a suggestion and we do not guarantee profits. We advise you to analyze the chart before opening any positions.
Wish you luck

Tezos (XTZ) - May 25hello?
Traders, welcome.
If you "follow", you can always get new information quickly.
Please also click "Like".
Have a nice day.
-------------------------------------
(XTZUSDT 1W Chart)
Anything below 1.942 is likely to be a mid- to long-term investment area.
From a mid- to long-term perspective, to continue the uptrend, it needs to rise above 2.822.
(1D chart)
If support is found above 2.012, it is expected to turn into an uptrend.
(buy)
- After confirming the support in 2.012
(Stop Loss)
- After falling below 1.942 and confirming resistance
- When it falls below 1.769
(Sell)
- When resistance near 2.398
- When receiving resistance near 2.822
If it rises above 2.822, it is expected that full-scale investment will be possible.
-------------------------------------
(XTZBTC 1W Chart)
You must climb over 0.0000 9730 to get out of the bottom section.
------------------------------------------------------------ -----------------------------------------------------
** All indicators are lagging indicators.
Therefore, it is important to be aware that the indicator will move accordingly as price and volume move.
However, for convenience, we are talking in reverse for the interpretation of the indicator.
** The MRHAB-T indicator used in the chart is an indicator of our channel that has not been released yet.
** The OBV indicator was re-created by applying a formula to the DepthHouse Trading indicator, an indicator disclosed by oh92. (Thanks for this.)
** Support or resistance is based on the closing price of the 1D chart.
** All descriptions are for reference only and do not guarantee a profit or loss in investment.
(Short-term Stop Loss can be said to be a point where profit and loss can be preserved or additional entry can be made through split trading. It is a short-term investment perspective.)
---------------------------------

TEZOS (XTZ) - BREAKOUT to 3 usd The small golden coin for today with the possibility to increase to 3 USD.
It's interesting to watch it out coming 72H.
This is an expectation depending on technical analysis and not finance advice.

XTZUSDTHello everyone, in this analysis I used a moving average weight with a period of 100 and a symmetrical triangle pattern, it is a strong analysis that requires a lot of patience, be successful and professional.

TEZOS - STABLE STABLECOINSWhich is the safest stablecoin?
USDC gained in market capitalization while USDT slipped billions of dollars post UST fiasco.
Stablecoins form a crucial part of the crypto ecosystem bridging traditional currencies and crypto assets. They contribute to more than 90% of the all crypto transactional volume on a daily basis. It has received widespread adoption mainly because of the fact that it is stable (as it is pegged to an external asset in most cases). However, stablecoins has received a lot of flak in the past and has intensified recently since the downfall of algorithmic stablecoin TerraUSD (UST). Market participants prefer the non-volatile nature of stablecoin especially during periods of high volatility and uncertainty where profits from crypto are moved into stablecoins waiting for the right buy opportunity. With Bitcoin (BTC) currently well on track to register losses for the eight consecutive week and the negativity surrounding the stablecoin ecosystem, it is time to discuss the safety of the most prevalent stablecoins in the market. In today’s article, we will analyze the top 2 stablecoins and understand the tradeoffs between them.
Tether (USDT)
Tether (USDT) is the top stablecoin of the crypto market. With a market capitalization of $74 billion, USDT is the most transacted and US dollar-liquid stablecoin making it one of the strongest contenders for the safest stablecoin. According to Tether, it has never failed to process a redemption request for USDT at a value of $1 per USDT token since 2015.
When a depeg occurs, it doesn’t mean USDT is no longer backed by 1-to-1 with reserves, or that USDT peg is lost, or that Tether redemptions are being processed at less than $1 per USDT. It just indicates that selling pressure on exchanges has dried up the liquidity.
In instances where exchange liquidity is too low, investors come to Tether to request a redemption. On May 11 and 12, the price of USDT deviated from its typical price of $1 on a few exchanges. This caused investors to purchase USDT on those exchanges for a discount and then redeem those USDT tokens with Tether on a 1-to-1 basis for a profit.
Since May 11, Tether reported that it has successfully processed $7 billion of USDT redemptions (for 1-to-1 with USD peg) for verified individuals. The size of this redemption has earned the trust of investors and has explicitly shown the capability of USDT to handle redemptions.
USDC or USDT?
During the recent crash post the UST drama, when USDT slipped in billions of market cap, USDC has increased its market cap from $48 billion to $52 billion. Though not a great jump, it shows that USDC might be well on its way to give a tough battle to the market leader and become the most trusted stablecoin during unstable times.
Despite the large number of stablecoins (both asset-backed and algorithmic-backed) available, USDT and USDC have a commanding presence in terms of liquidity, security and market cap. In terms of market cap, USDT is the sole winner but when it comes to transparency, USDC has a clear upper hand.
However, we strongly encourage investors to only use stablecoins for short-term trade objectives and refrain from investing in them for high-risk interest rates. Bitcoin is and will continue to be the safest crypto asset in the market.
Long on TEZOS here,
the FXPROFESSOR

XTZ ascending triangle break upwards. Bullish break, target is $2.2
Overall bullish on the daily time as well.
XTZ Big pump incomingHello Traders!
XTZ has formed a bullish accumulation pattern at the bottom and now it's broken towards the upside.
I am expecting a 38% rise in this bull run.
XTZ Buy limit@ 1.908
Stoploss 1.84(-3.61%)
Target 1, 2.16(+12.8%)
Target 2, 2.36(+23.8%)
Final T.P 2.64(+38%)
Risk management tip,
Use 10% of account max with 10x leverage.

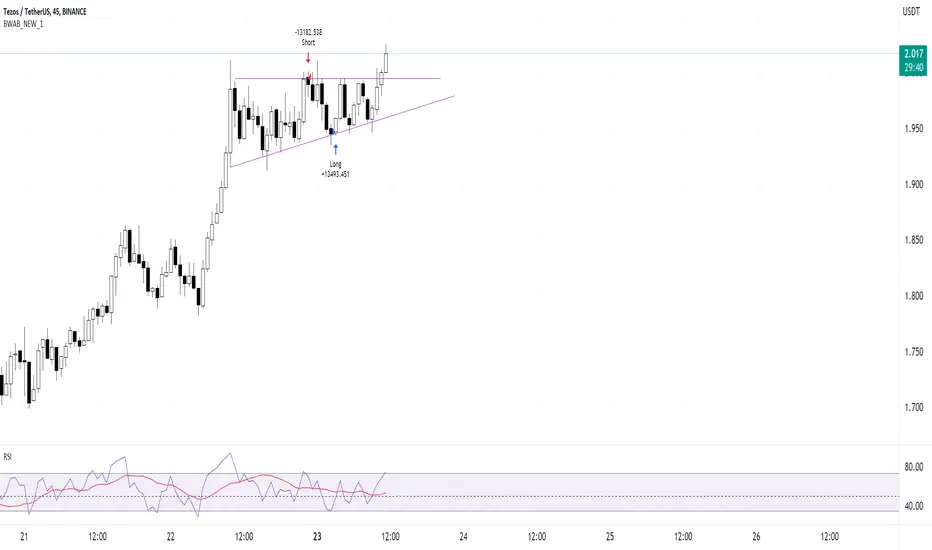
XTZ - Great RR Trade Setup Here we can see $XTZ is fighting the psychological $2 level. It was our old support (green arrow) currently flipped into new resistance (red arrows). Shorting here with the stop loss just above our last 2 highs (double top?) around $2.011 gives us a great risk/reward trade setup for the short term. Good luck!

TEZOS- Updated LevelsOur TEZOS chart shows a promising rebound to 2.998 could be in play.
Price has support at 1.823 that has already been checked, as well as resistance at 2,04. After that level the rise should be able to accelerate.
FOOD FOR THOUGHT:
LUNA's disaster could be good news for Tezos: www.nytimes.com
One Love,
the FXPROFESSOR

TEZOS SHORT TERM BUY BIAS 🌱 Spotted a bullish triangle breakout on XTZUSDT. I'm only taking this trade because the BEAR PRESSURE is weakening. This may be a short term buy before we continue with the down trend. Let's see how this goes.

XTZ/USDT-1D-BINANCEThis is not a financial advice. Always do your own research and always put stoploss in your trade (SL) :) If you want more detailed info
how to study and read charts or just need help with some coin, just write to me here a comment, i will try to answer to everybody...
i can help you :) all for free, don't worry, BE HAPPY!

#Tezos Stabilizes, but XTZ Is Bearish Below $2Past Performance of Tezos
Technically, XTZUSDT remains in a bear breakout formation despite recent gains at the tail-end of last week. Tezos is trading at near 2022 lows, posting lower lows versus the USDT when writing. The coin is down four percent in the past 24 hours but at near break-even in the past trading week.
#Tezos Technical Analysis
Presently, XTZ is in a tight $0.05 trade range with clear resistance at $2 and $2.6. In the immediate term, the coin has support at $1.5, flashing with 2022 and last week's lows. Since there are lower lows and prices are within May 12 bear candlesticks, sellers may find entries to liquidate, targeting $1.5 in the short term. On the reverse side, sudden flash gains above $2 may trigger demand, pointing to price reversals (XTZ bottoming) and the current consolidation as accumulation. In that case, XTZ may float to retest Q1 2022 lows of $2.6.
What to Expect from #XTZ?
The primary trend is bearish and XTZUSDT below the middle BB. The failure of buyers to build on last week's gains points to general weakness and dominant sellers. Nonetheless, the tide could shift if XTZ floats above May 12 highs, setting the ball rolling for a possible surge to Q1 2022 lows.
Resistance level to watch out for: $2
Support level to watch out for: $1.5
Disclaimer: Opinions expressed are not investment advice. Do your research.

XTZ ascending triangle - close to breaking it, becoming bullishLet's hope XTZ breaks the ascending triangle. The resistance area is expected around 2.2, and the local support area around 1.48. However, let's hope it goes for the best! We love Tezos, and it's currently around its yearly bottom as well.
The chart below outlines are trading indicator which is still in a long phase, however, it should have shorted a while back. This is why chart patterns are useful in addition to indicators!

XTZ at lows - time to buy?There is a lot of potential here as we are near all time low supports, ranging around the ~$1.3 mark. I have outlined the zones in the chart.
The red zone is where there will be a lot of resistance.
Green is the buying zone, and expect volatility here.
The black trendlines are old support lines coming from many years back. It's currently struggling to keep above the lowest line. Once it breaks this going up, it should be face resistance at the other two trendlines.
Is it a good time to buy? Maybe not with your whole bag because BTC crashes are still looming around and it's not showing a lot of bullish strength.
To play it safe, it would be best to buy it when it drops down to around ~1.3 , or if BTC goes past 35.5k.
Otherwise, let's just play it safe and manage your own risk. Leave a comment with your analysis.

#XTZUSDT 3H Chart
Price previously tapped into the major daily demand zone from where it bounced from and it is currently moving up from there. MACD is showing bullish momentum, RSI is neutral but EMAs are bearish. Price needs to break above the previous high at $1.94 for short term bullish confirmation, we would then look for an entry aiming potentially for the major 3h supply zone around $2.8 as a FVG (fair value gap) is present below it which needs to be filled with a major level of equal highs below it so huge liquidity is resting at that area as well which needs to be taken out.

Tezos Snaps back, adds 10% but will #XTZ clear $2?Past Performance of Tezos
XTZ prices are printing higher at spot rates, adding 10 percent in the previous trading day. Like the rest of the crypto markets, the coin appears to be finding its footing after deep, double-digit losses of the past trading week. Overall, sellers are still in control though the tide could change in the immediate term if XTZ prices are sustained above this week's lows.
#Tezos Technical Analysis
Tezos bears have been brutal in the past few trading days. As per the arrangement in the daily chart, sellers are still in control. However, the recovery on May 13, reversing the losses of May 12, may signal exhausted bears. Nonetheless, it should be observed that since XTZ prices are within a bear breakout formation below H2 2021 lows at $2, sellers have the upper hand. Optimistic buyers expecting recovery can wait until there is a comprehensive close above $2 before loading on every pullback lower. Conversely, it would be dashing if XTZ slips below $1.4. In that case, there will be confirmation of the May 9 bear breakout, setting the pace for further losses towards $1, registering new 2022 lows.
What to Expect from #XTZ?
Tezos is within a bear breakout formation as per the formation in the daily chart. The reaction at $2 would confirm whether the bear run is over or the current trend will continue.
Resistance level to watch out for: $2
Support level to watch out for: $1.4
Disclaimer: Opinions expressed are not investment advice. Do your research.

xtz usdt perpihns
==============
entry : market price or 2,126 ( save entry area )
stop loss : 2,059 (3%)
===============
take profit :
-2,158
-2,183
-2,200
-2,218
-2,240
-2,275

xtzxtz has completed a bullish shark pattern on weekly time frame and there is a good chance we might see a reversal from here .
NFA DYOR

XTZUSDT - potential 144%With green lines, I indicated the reversal week and strong impulses main set of positions will occur now, as well as on the breakdown of upward support from the bottom up and consolidation above the rising global support

XTZUSDT AB==CDAB=CD
The AB=CD pattern is easy to identify on charts and consists of 2 equivalent price legs. It has specific Fibonacci measurements of each point within its structure, eliminating room for flexible interpretation. The C point must retrace to either a 0.618 or 0.786 and the BC projection is either 1.27 or 1.618. When the BC projection and the AB=CD completion converge closely and define a small area, the chance of a reversal increases.
The first target would be the 382 retracement of AD and the second target the 618 retracement of AD. A common stop level is behind a structure level beyond the D point. Conservative traders may look for additional confirmation before entering a trade, for instance an aligning RSI value or a specific candlestick pointing at a reversal. TradingView has a smart ABCD Pattern drawing tool that allows users to visually identify this pattern on a chart. There are several variations, based on CD being an extension of AB such as the 1.27 AB=CD or the 1.618 AB=CD pattern.

#XTZUSDT 4H Chart
Price is still ranging in a downtrend and it recently left a freshly printed 4h supply at $2.7. MACD is not showing clear indications, RSI is sold and EMAs are bearish. Price needs to close above this supply and once it does we would look for long opportunities. However if a rejection is seen then we will short and aim lower. Waiting for confirmation.

XTZ (TEZOS) UPDATETwo scenario here... after breaking out of the falling wedge price retested and couldn't continue the bull run hence, breakdown, which turns to a descending triangle.
Right now there's no sign of reversal as volume is absent in the market and price could possibly poke out to touch the weekly support trendline.
Hold while we keep watch and update you on the next move.
