XTZUSDT trade ideas


My personal idea about XTZ | USDTIn my opinion, the value of XTZ against USDT will rise in few days and we will be able to earn profit of up to 70 %.

🆓Tezos (XTZ) Mar-24 #XTZ $XTZ
XTZ has conquered the $3.2 zone and with the current buying force, it is possible for XTZ to continue to rise to the $4 and $4.8 zone in the near future. The risk is quite low but we still need to watch out in case XTZ loses the $3.2 area and will fall into a long-term downtrend.
📈RED PLAN
♻️Condition : If 1-Day closes ABOVE 3.2$ zone
🔴Buy : 3.2
🔴Sell : 4 - 4.8
📉BLUE PLAN
♻️Condition : If 1-Day closes BELOW 3.2$ zone
🔵Sell : 3.2
🔵Buy : 2.6 - 2
❓Details
🚫Stoploss for Long : 10%
🚫Stoploss for Short : 5%
📈Red Arrow : Main Direction as RED PLAN
📉Blue Arrow : Back-Up Direction as BLUE PLAN
🟩Green zone : Support zone as BUY section
🟥Red zone : Resistance zone as SELL section

XTZ/USDT TRADE SETUP! READY TO PUMP 150% LONGHi guys, This is CryptoMojo, One of the most active trading view authors and fastest-growing communities.
Do consider following me for the latest updates and Long /Short calls on almost every exchange.
I post short mid and long-term trade setups too.
Let’s get to the chart!
I have tried my best to bring the best possible outcome in this chart, Do not consider it as financial advice.
IOST is about to breaking out from a descending triangle in daily time frame.
Entry range:- $3.5 to $3.4
SL:- $2.7
This chart is likely to help you in making better trade decisions, if it did do consider upvoting this chart.
Would also love to know your charts and views in the comment section.
Thank you

Great buy lvlLast line of the pitchfork holding XTZ, expecting to run till the mid line of the channel, and after that ML.
NFA

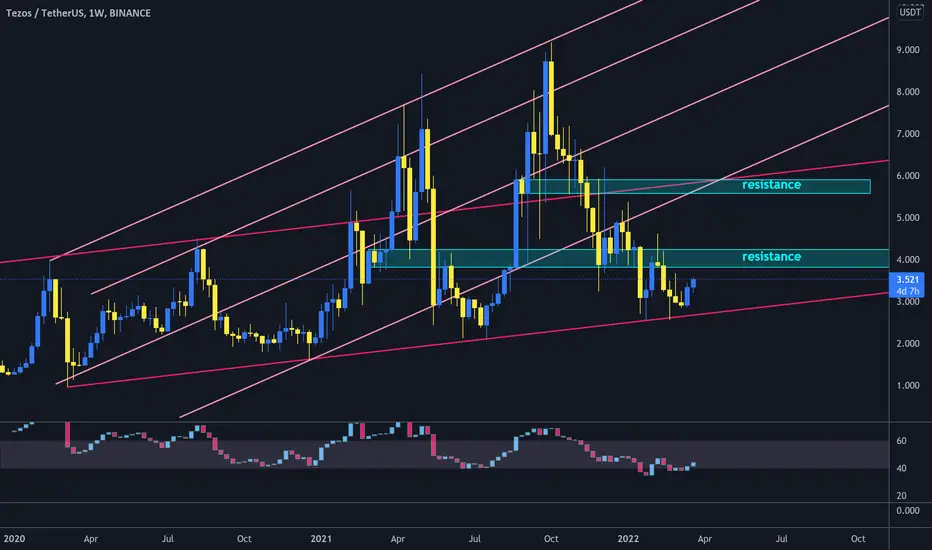
XTZ inside broadening wedge#XTZ/USDT
$XTZ touched the lower line of broadening wedge and hold it as support. and now try to break out from descending resistance in daily time frame.
🐮 price can head up to resistance zone around $4.
break out from $4.3 can increase price to resistance zone around $6 that is the same with 2 ascending trend lines.
pretty conservative if you ask me xtzthank you for coming to my tedtalk this is just my personal journal and tradingview wont let me post this unless is write more characters here we go lets go!!

10 Interesting NFT Platforms on Web3 Right NowWhat's been happening in the NFT space since the downturn in the crypto market? A lot, actually.

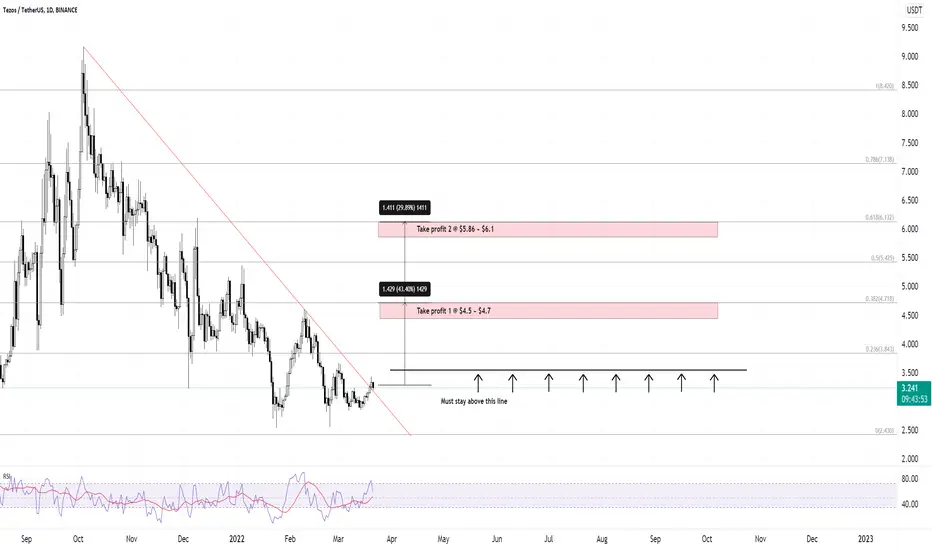
Tezos - XTZ Idea - Mar 21/'22Please take a look at the chart.
We have broken a long resistance line.
TP levels around
@ 4.5
@ 6
XTZ Yükselen Trend HareketiXTZ bu trend içinde kaldıkça trade işlemlerine devam edicem. Tabi ki $BTC paritesinde ters bir durum yaşanmadığı sürece


Tezos looking to blast off! Looks like a very bullish setup - perfectly bounced off the lower rail, MACD & RSI turning up, volume supporting recently price low & a nice green candle to break the recent downtrend line! Send it!

XZT/USDT Analysis #TheCryptoCityXZT/USDT
Since October XTZ is in a downtrend and making
the perfect channel. The market is very volatile and
unpredictable these days. But it is making good
support at 2.9 and if makes good support here and
breaks the channel resistance and structure then you can take
benefit from this coin.
Everything Is On The Chart.
Always Manage Your Risk
I am Not A Financial Advisor Do Your Own Research.
Every Thing Depends On BTC Movement
#TheCryptoCity #XZT
we are not market makers :)

XTZ: Death or Moon?XTZ is one of the best buys right now that you must have in your wallet ! There is a HUGE hidden bullish divergence (i did not include it in the chart cause naked charts are easier to understand). Entry 2.850 - 2.650 SL close 1W candle below 2.5

Welcome to XTZ/USDT trade setup update Welcome to XTZ/USDT 1DAY quick analysis
I have tried my best to bring the best possible outcome in this chart.
xtz/usdt currently broke the upper trend line and retesting, here we can take a position for 200% potential rally.
Entry:-CMP $2.91,$3.17
Target:-200%
Stoploss:-$2.52
With leverage 2x to 5x
And long term hold and good profit 😉🙂😊✈️✈️
Q:-What do you think about this?
Do you think we will see a new ATH of XTZ in the next quarter?
Share your views in the comment section.
Remember:-This is not a piece of financial advice. All investment made by me is under my own risk and I am held responsible for my own profit and losses. So, do your own research before investing in this trade.
Happy trading.
Sorry for my English it is not my native language.
Do hit the like button if you like it and share your charts in the comments section.
Thank you.

#Xtz / #Usdt#Futures / #Scalp
❇️Buy zone 1 : 3.044
lev 5~10x
🎯Targets : 3.09 / 3.119 / 3.155 / 3.19 / 3.22
⛔️Stop loss : 2.951
🛑Don't risk more than 3% of capital.

XTZUSDT: RETESTING SUPPLY ZONE, ALTCOINS CONTINUE MOVING LOWER?Hello CryptoTrading Enthusiast! Help the Channel Growth by smashing the FOLLOW and LIKES Button, then Share your opinion on the Comment Section below :)
XTZUSDT created falling wedge pattern. Macd Indicator start crossing down toward the zero level area, it signify the potential bearish movement ahead on XTZUSDT.
*Now We put all the explaination on the chart* Enjoy!
*DISCLAIMER:
This isn't a recommendation to buy or sell cryptocurrency, only an Outlook from technical perspective.
*FOLLOW FOR MORE CONTENTS AND UPDATES*

$XTZ Tezos Expanding DiagonalReal nice broadening wedge here on XTZ at support. Divergence on your local double bottom there and hidden bullish divergence on your last discernable low. Expanding diagonal, after an .886 retrace could imply a 1.618 extension.

Buy Tezos/ XTZUSDTLooking at the market, Tezos looks nice to buy at this current moment on the 15 minute chart based on market trends.

#XTZUSDT 12H Chart
Price bounced perfectly from the 5h demand zone at around $2.55 and did a clear break of structure. MACD lines crossed and is now bullish, RSI and EMAs are currently neutral. I expect to see a small pullback from here before leaving a higher low before continuing with the bullish movements towards the 12h supply at $5.

Tezos (XTZUSDT) TA: 22.2.27Tezos is located at the bottom of the canal for a long time, which is well supported every time it hits the bottom of the canal. If it leaves the red channel, it can continue its long-term upward trend. But if it leaves the blue channel, it can see 1.85 support.
⚠️ This Analysis will be updated ...
👤 Sadegh Ahmadi: @SDQ_Crypto
📅 27.Feb.22
⚠️(DYOR)
❤️ If you apperciate my work , Please like and comment , It Keeps me motivated to do better

XTZUSDT (Long)XTZUSDT in an upward trend
Long
Entry at 3.435
Take Profit at 3.650
Stop loss at 3.248
Risk/reward ratio of 1.25
