XTZ Double bottomed and we are now looking at some returnsI just noticed that my XTZ had double bottomed. Usually that is a good sign of reversal.
XTZUSDT trade ideas

Just thought this was a cool look. Cup and handleIt's done two cup and handles in a row. Could this be a third? Or will we get another market crash before then? The daily indicators all look pretty good.

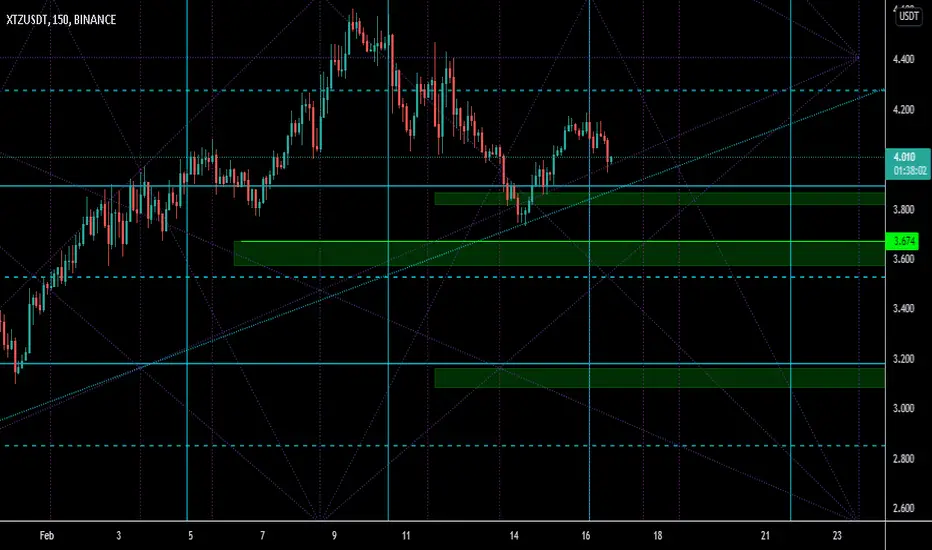
DEMAND ZONE , POSSIBLE BREAKOUT AND RALLY ?
Hello Traders
- Please push the like button if you like the content or drop a comment to share your idea!
- Looking into XTZ at 1D time chart, price action is respecting our strong non horizontal support ( area of value ) , meanwhile XTZ is trading inside an descending channel since 4 October 2021 , obviously sellers has lost their momentum
by making a new lower lows , since then buyers have strong interest buying on this of level support marked in green 2.2$ ~ 2.6$ , price bounced back many times strongly from that support suggestion that buyers are willing to take the
price higher and have steam for another rally , buyers will protect this level in case price bounced back.
- I would like to see buyers breaking the descending resistance trendline of this channel 4.2$ - 4.5$ ( Trigger ) with a good amount of buying pressure volume taking the price higher towards resistance level 5.7$ by then we will have
confirmation after breakout which will confirm our valid scenario, meanwhile XTZ is still in bearish mode trading inside the channel if buyers failed to break the descending trendline , price could bounce back to level support marked
in green or even consolidate.
Good Luck Traders!

TEZOS TA : 02.26.22 : $XTZ : +35% ✅As you can see the price after reaching and returning to The Bullish Order Blocks reacted positively and increase more than 35% . the Next targets are $ 3.9 , $ 4.32 and $ 5.36 .
All the supports and resistances are marked on the chart and everything is clear in this analysis , but , just in case , if you had any questions or doubts Please feel free to ask in the Comment section .
Follow us for more analysis & Feel free to ask any questions you have, we are here to help.
⚠️ This Analysis will be updated ...
👤 Arman Shaban : @ArmanShabanTrading
📅 26.Feb.22
⚠️(DYOR)
❤️ If you apperciate my work , Please like and comment , It Keeps me motivated to do better ❤️

XTZUSDTGiven the good news and also mentioned on social media, I can suggest a step for point buyers, but the $ 4 resistance is very important, and if the price goes up quickly and changes a little, the $ 5 resistance is easier. Will break. Becomes. And I'm even thinking about the $ 6 target, but if the $ 4 price tag shows a lot of boredom, we will have a correction from $ 5, and it can range above $ 5, depending on market conditions.
DISCLAIMER:
This is not financial advice! This is an opinion-based show. I am not a financial adviser. Please only invest what you can afford to lose, and we encourage you to do your own research before investing.
everyone should buy and sell according to their own strategy.
Everything you need to know is outlined in the chart and keep in mind that we are moving forward with probabilities and the analysis may be wrong so take capital management seriously.

My scenario for XTZ when the pump will comeThis is only my opinion but I think it could look like that !
Give me your viewpoints !

Tezos possible path and Fib levelsA projection based on the trend that Tezos (XTZ) has shown since the day of its KuCoin launch. If true, big buying opportunity should be happening around March '22

XTZ 2.2 AreaProbably the last opportunity for buying tezos, maybe touch 2.2 area and boom, maybe spiking down, or maybe fly already, who knows :)

XTZ : SCALPING15 Min. TF
.
.
no professional financial advice please trade at ur acceptable risk. :P
TP at about 80% of actual target would be ideal
Trade safe and fun
.
Feel free to comment & share ur ideas
-----------

Update For XTX/USDT Analysis 📈📉What's up Guys , in this analysis I gonna talk about TEZOS!
As we see on the WEEKLY timeframe for XTZ/USDT ,since it has reached highest price $9.171 ,
it hasn't successful to rise again and record a new ATH ,now by retracement of last bullish wave ,it recently reached
to 0.236 fibo level , after its recent downfall tried to close above pivot zone but the selling
pressure pulled it back below this range which is now a resistance zone , but its still above
its strong support zone and can have a growth to higher resistance levels and even top ascending trend line .
but otherwise in view point of price action, if it not be able to maintain current support level and trendline ,
it maybe drop again to lower support area . in another case maybe being in side way for while ,
and fluctuate between higher and lower volume ranges zone .
🛑resistance level: $6.42 -$6.7/// 5.2$-5.55$///trenline
🆚pivot zone: $4.2-4.4$
❇️support levels: $2.8-3.2$///$2-$2.18///$1.456///trenline
--------------------------------------------------------------------------------------------------------------------
👉This analysis is my personal opinion ,not a financial advice ,so do your own research.
💜 if you're a fan of my analyses PLZ follow me and give a big thumbs 👍 OR drop comment 🗯💭

XTZ - Detailed Video Analysis!Hello everyone, if you like the idea, do not forget to support with a like and follow.
Here is the top-down analysis for XTZ , feel free to request any pair/instrument or ask any questions in the comment section below.
Best of luck!


XTZUSDT , 4H , 19.02.22As you see, XTZ build HEAD & SHOULDER pattern and break the neckline. right now complete the pullback, next will see it at nearest support 3.23$
if support dont act the next one is 2.73$.
19.02.22
DYOR

XTZ analysis Previous analysis failed
It is located inside a descending channel to the bottom of the 3.30 channel
And the uptrend will go from here to 3.8

XTZUSDT Analysis (LOCAL VISION)Hello friends.
Please support my work by clicking the LIKE button👍(If you liked). Also i will appreciate for ur activity. Thank you!
Everything on the chart.
Since we have received a beautiful upward impulse and are now in a correction to it, there is no doubt that we will update the local top.
2 options on the chart, I tend more towards the yellow option, but if bitcoin shows a complication with the 40k test, then xtz will also adjust to the ~3.5$ and only then will show growth.
Entry: market and lower
Target: 4.5 - 4.9 - 5.3
Stop: (depending of ur risk). ALWAYS follow ur RM .
risk is justified
Good luck everyone!
Follow me on TRADINGView, if you don't want to miss my next analysis or signals.
It's not financial advice.
Dont Forget, always make your own research before to trade my ideas!
Open to any questions and suggestions.

DCA this Oscillator - XTZLong Zone
3.5 - 3.3 $
Target
4.3 $
5.5 $
6.0 $
7.5 $
SL 2.9 $
The price is under the C wave of ABC correction and reaching the 0 fib extension level which also coincides with the recent low at 3.3 $
RSI and Vol are low so a 3.3+ $ range is expected and this is where we should long.

⚡️⚡️ #XTZ/USDT ⚡️⚡️- 13%⚡️⚡️ #XTZ/USDT ⚡️⚡️- 13%
#BLOCKSHOT
Signal Type: Regular (Long)
Note: ABCD Harmonic in play, looking to catch BTC bounce - high risk
Entry: 3.899
Target 1: 4.186
Target 2: 4.409
Stop-Loss: 3.729
If you like the content then please like and comment

xtz usdtDistribute your purchase by 40% of the first price cluster, 40% of the second, and the last cluster 20%
XTZUSDT , 1W , 15.02.22Hi guys
Just take a look in long term for XTZ.
we have an important resistance around 4.3, to see middle of channel (around 5.6) should stay above 4.6.
EMA200 at Daily time frame place on 4.6 which make the price more important.
we will follow patterns in lower time frame as soon.
15.02.22
DYOR

XTZUSDT possible targets Hello traders this simple analysis based on Ichimoku and price action and this is the scenarios for XTZ long .

XTZ a low risk midterm investmentHi guys,
XTZ has a key position at current prices, It's experiencing an expanding harmonic pattern and in the midterm, can have a decent profit.
Follow and comment

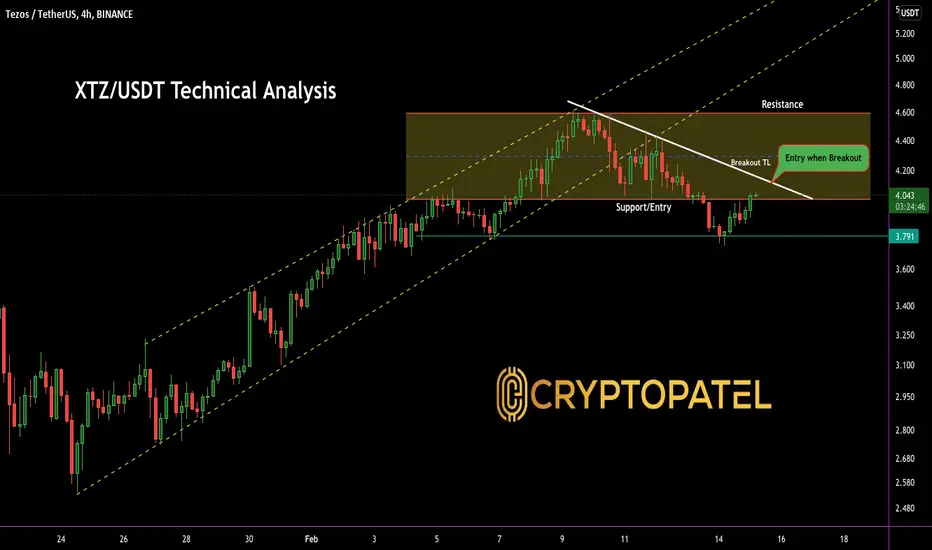
XTZ/USDT Current update after break down#XTZ/USDT
$XTZ dumped -7% after break down.
What now..?
Still not In trade zone.
I am buying only if Breaks White line Resistance.
White Line Resistance = $4.20
If break the Resistance then we can aee $6 in coming days.
But wait for Confirmations.
Support:- $3.80
Resistance:- $4.20
XTZ Currency AnalysisAs this currency is in an upward channel on a weekly basis, it is likely to break its ceiling, ie $ 13. Thank you for your supervision.
