XTZ/USDT 1DAY UPDATE BY CRYPTOSANDERSWelcome to this quick XTZ/USDT analysis.
I have tried my best to bring the best possible outcome to this chart.
Reason of trade:- XTZ/USDT Triangle pattern create and buy the dip and green zone
Entry:- $2.1
$2.6
Traget:- 75% to 100%
Stop loss:-$1.5
Remember:-This is not a piece of financial advice. All investment made by me is under my own risk and I am held responsible for my own profit and losses. So, do your own research before investing in this trade.
Happy trading.
Sorry for my English it is not my native language
Do hit the like button if you like it and share your charts in the comments section.
XTZUSDT trade ideas

XTZ/USDT Technical Overview#XTZ/USDT Technical Overview:-
$XTZ trading at $4.04
This is Good support.
If $XTZ prize hit $4.40 thats would be good price to Enter because of Confirmations.
I am buying some here around $4.00
If Price go below $3.90 then I will exit.
Targets:- $4.40
If Hit $4.50 then New Target would be $6
Need to break White TL.
Support:- $4
Resistance:- $4.60/$5.60

TLM longif tlm dont lost 3.93_3.89 zone and can tern back
the resistances are 4.11 4.23 4.32 4.33 4.55
i hope we dont lose this coin...
if it lose the 'D point zone' the final su [pport is 3.80$

RR=2 sell ideaBearish crab pattern + double top at resistance level + RSI divergence +5 impulsive elliot waves count we might be at the beginnig of the first leg of corrective wave : price might retest the 3.877 support level ***
PS : never risk more than 2% of your capital per trade

XTZUSDTwe must attention suplly and demand area and trend in triger time frame with trade line or classic patern
base timeframe : 4h
triger time : 15m

Sending XTZ to the moon Ascending triangle and ascending channel spotted in XTZ 4H chart. Considering the weekly moving average support and price movements, it's pulling back to both "horizontal S/R of ascending channel" and "ascending channel midline" which both will operate as strong supports. So fasten your seatbelts after the pullback is done.
Trade Safe ...

Price ActionFrom the technical beauties of El Brooks
I hope friends around the world trade logically


XTZ Midterm Movement Analysis 📊 XTZUSDT (TEZOS)
💹 Time Frame: Daily (Update)
➖➖➖➖➖➖➖➖
🟡 XTZ broke the downward trend line and is trying to hold above it. we have 2 scenarios for Tezos!!
✅ The current trend may retest dynamic support and bounce to S/R level and start another bullish Cycle to 0.618 Fibonacci level.
✅ The current trend directly heading forward to retest S/R key level and reject and break the dynamic support the pullback and start another bearish Cycle.
➖➖➖➖➖➖➖➖
👤 AmirHossein
📅 02.09.2022
⚠️ (DYOR)
BINANCE:XTZUSDT

XTZUSDTBuy after retest there are two possible ways to trade but according to market. The market is in uptrend for long.
Note:
Do not invest all of your fortune which you can not bear emotionally.
Happy trading:)

🔥 XTZ Bullish Channel Bounce UpdateRecently I made an analysis on XTZ and the bullish channel it was trading in. Since my last analysis, XTZ has appreciated around 40% in value. Congratulations if you took the trade.
Since the current run up has been vertical, I'm expecting a minor retracement in the coming days. Not sure when it will come, but I'm expecting the support area to hold. So, in case you're waiting for a decent entry, you might want to watch the support area in case we get there.
Be aware that we're bullish as long as the overall market structure points bullish.
Happy trading!

TezosThe first time I noticed these megaphone patterns was in March of last year and Tezos was apart of the few tickers that showed that pattern.
Since then, I understood how these patterns usually played out, however, the drastic increase and drop in price for the pattern to continue seemed impossible - given where we were at in the market. (April 21' - July 21' - Oct 21' - Jan 22')
After seeing these last 3 swings, along with price holding the long term lower trend line, to think a next leg up is impossible this time might be a bit insane.
Previous post with these findings are linked below. I may post a few old examples.

Correction complete time to long TEZOS XTZUSDTThis setup like any ALT/Derivative or Spot setup is and always will be dependable on how BTC is trading .
Please ensure you understand this as I have been trolled by individuals whom dont understand the distinction and thus probably lose money and take it out on me .
Ok well here we have the XTZ/USDT Pair on Bybit Perpetual contract .
As you can see from the drawing we have completed a full retracement down to the .886 fib and made a nice reaction off of this level ,
with a back test of the .382 back on the 5th Of Feb and now we are slowly building on some upwards movement again .
If you are looking to enter I would suggest that you set some alerts and maybe we pull back to the .382 when BTC throws a wobbly or the .236 if we were to
fast wick down ... again revolving around BTC !
Sitting at the .786 level is the POC so i would not expect to go straight through it as i anticipate a fair level of resistance here .
My targets would be around the 1-1 as marked and around the VAH .
Ensure to take profits on the way up in increments of 25% for example .
.Always use a SL and know your Invalidation

Tezos Breakout✔ #XTZ $XTZTezos, which has been on a low-slope ascending channel for 836 days, is now moving from the bottom of the channel to the top of the channel, breaking a 126-day downtrend line and after stabilizing the price, it is ready to move to the midline and The roof of the canal. There is also a positive divergence in the chart, which could be a sign that the trend is moving up.
I hope you find this analysis useful🌹
Follow for more...
#DYOR

XTZ/USDT is more like dogeHELLO FRIENDS, XTZ/USDT is forming Descending Channel Formation in Daily timeframe Chart. So far Bulls in Complete Control & Seems like Ready for Massive Upside Breakout..🏄♂️. FOLLOW FOR MORE

a corrective wave then fly to 6 $analysis with (ichimouko suply zone and price action and harmonic pattern(bat))

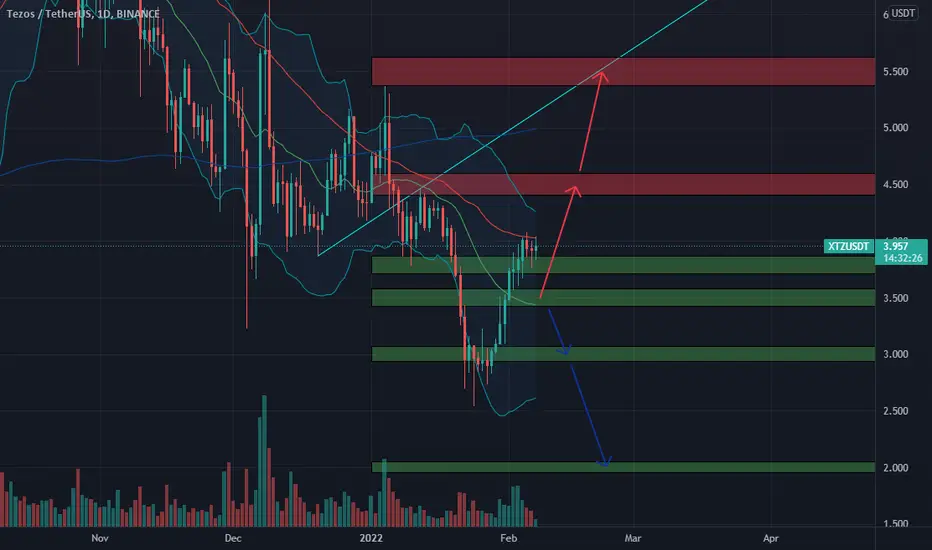
🆓Tezos (XTZ) Feb-07 #XTZ $XTZ
.
📈RED PLAN
♻️Condition : If 1-Day closes ABOVE 3.5$ zone
🔴Buy : 3.8 - 3.5
🔴Sell : 4.5 - 5.5
📉BLUE PLAN
♻️Condition : If 1-Day closes BELOW 3.5$ zone
🔵Sell : 3.5
🔵Buy : 3 - 2
❓Details
🚫Stoploss for Long : 10%
🚫Stoploss for Short : 5%
📈Red Arrow : Main Direction as RED PLAN
📉Blue Arrow : Back-Up Direction as BLUE PLAN
🟩Green zone : Support zone as BUY section
🟥Red zone : Resistance zone as SELL section
XTZ breaks its bullish lower channel Down! Go shortYou can open short position with money managment sell 2 steps lev less than 6 !

XTZUSDT-SHORTBased on technical factors there is a short position in :
XTZUSDT Tezos
Score 2️⃣
🔴Short Now or set on Key Level 4.015
🟢Target 1 3.690
🟢Target 2 3.390
🟢Target 3 2.750
❌Stop loss 4.115
#K_Level
Every signal has a score from 1 to 5, so accordingly adjust your risk for each signal. The signals with the score of 5 are the most probable ones.
Please support our activity with your likes and comments.

XTZ LongSTATUS:
Market Structure: Bullish if we close this week above weekly level
Weekly: Swept weekly demand and about to break weekly resistance.
Daily: Reclaimed range low
Entry: Retest 12H supply after reclaiming swing high
Exit: Weekly level
Invalidation: Below weekly level and under 12H supply with a 60m stop timeout or close the weekly below the level.

Tezos , Breaking the downtrend line !All supports and resistances are marked on the chart. As we can see, the price is in an important range and recommended to keep an eye on it ...
Follow our other analysis & Feel free to ask any questions you have, we are here to help .
📊#XTZUSDT ( Tezos )
💹 Time Frame : Daily
🔵 Personal Opinion : HODL
👤 Saeid.Mahbob
📅 02.05.2022
❤️ If you apperciate my work , Please like and comment , It Keeps me motivated to do better ❤️

TEZOS | Descending Channel Pattern..!!
#XTZ (Update)
Descending Channel Consolidation Continues..📉
So far Looks Bullish & In Case of Upside Breakout, expecting +100-120% Bullish Wave..
📍 Always Wait for Confirmed Breakout & Candle to Close and Only then ENTER..
Please like the idea for Support & Subscribe for More ideas like this and share your ideas and charts in Comments Section..!!
Thanks for Your Love & Support..!!

