XTZUSD Long from 7.6-7.7At the 7.6-7.7 level on Tezos we have thr weekly pivot, the 0.382 of the move, a 3 Day level, and the previous week value area high. If we retrace, expect demand to pick up at that level
XTZUSDT trade ideas

🆓Tezos (XTZ) Oct-4 #XTZ $XTZXTZ has just conquered the 8$ zone and it could move up towards 9.5$ and 11$ zone in next days. But if it loses 8$ zone, it will come back 7$ and 6$ zones
📈RED PLAN
♻️Condition : If 1-Day closes ABOVE 8$ zone
🔴Buy : 8
🔴Sell : 9.5 - 11
📉BLUE PLAN
♻️Condition : If 1-Day closes BELOW 8$ zone
🔵Sell : 8
🔵Buy : 7 - 6
❓Details
🚫Stoploss for Long : 10%
🚫Stoploss for Short : 5%
📈Red Arrow : Main Direction as RED PLAN
📉Blue Arrow : Back-Up Direction as BLUE PLAN
🟩Green zone : Support zone as BUY section
🟥Red zone : Resistance zone as SELL section
🅰️A : The Close price of 1-day candlestick is Above the zone
🅱️B : The Close price of 1-day candlestick is Below the zone


XTZ did not breakthrough the uptrend, shows really much strengthXTZ on larger time frame is still focused on completing the broadening wedge, rather than dipping out. In this monday dip every coin seem to break out negatively on the pattern they were busy with, but not XTZ. XTZ went not even out of the uptrend range within the broadening wedge as you can see. Very promising!

XTZUSDT 1DHi everyone
Possible routes for xtz price movement
The price of xtz has entered the saturation zone
To continue the bullish trend, the price needs to be adjusted to 7.24 and 6.49 to neutralize the buy saturation
If supported in these areas, the price can rise to 9.17 and if this range is broken, there is a possibility of an increase to 12.39
If the price of 6.49 is not supported, we can expect a further price reduction
In the other case, the buying pressure may increase and the price may not correct and increase
Tell us your opinion about the price trend of xtz
Thankful
have a nice day

Tezos is ready to go high. XTZUSDTHello my friends, the price was pumped after successfully breaking the neckline's CUP pattern and now I expect 260% growth. So consider and monitoring to buy at pullback and any correction is a buying opportunity IF the price does not lose the neckline support. Good luck.
If its useful please like it as a support and follow me for next analysis :)


BIG XTZ (Tezos) PUMP and BREAKOUT but be careful...Firstly, a huge congratulation to everyone who bought XTZ for $6. If you haven't bought yet, then I'd say wait for a correction to the next support level of $7-$8. I'd say this move is mainly driven by emotion and FOMO (no disrespect to Tezos, it's a great project) as it's still over-extended. I wrote all the analysis on the chart already so I won't be doing it here like I normally do.
Have a nice day and trade money you can only afford to lose!

XTZmay a pattern called ending diagonal, is completing,
always the price goes sharp after these patterns.
♥

Xtz continues strongly...According to xtz behavior in the last three days and also MACD , pivots and the ascending channel , the price can reach the 11$ target today . Be ready for today ride...

XTZ looks very promisingNow Xtz have good support around 7.5 .if bitcoin stiil stable for few days .i expect tezos can pullback to support area between 7.5 and 7 and after that go for another fly and rsi looks very good .this week is very important

XTZ longThe same picture here, currently near the previous ATH. Can go in a risky trade now or wait till the ATH breakout and make ur trades.
If BTC will not dump everything looks fine for me. DYOR

XTZ (Tezos) breakout targetsXTZ breakout and possible targets by measuring chart patterns. Which target is correct?

XTZUSDT , Near First Tp and Second Tp Hello everyone
Whats up guys ?
According to the last analysis about XTZ we were published it and now its moving according exactly to our wave and analysis
We should wait for first target then after some pullback we can take other position to the second target
be Patient guys
Good Luck
Abtin

xtzIt used to form an incremental triangle that grew exactly the size of the base of the triangle ($ 8), now it has formed it again ($15)

XTZ is in Ascending TriangleHi Every One
We Can See XTZ moving in ascending triangle channel and there is a major resistance at 8.2
we know in this situation price most break out the triangle up or dawn
i think in this scenario the possibility of breaking dawn is 70 % (back dawn to 6.8 to 7 for a while)
and according to the charts only 30 % possible for breaking 8.2 up
Good Trade To All

XTZUSDT DEEP CRAB FORMATIONDeep crab will complete when price achieve point D around 1.618% fibo extension.
This for short term target and CL(Cut loss) if price below 7.16 (red line).
#TAYOR BINANCE:XTZUSDT

#XTZUSDT (Watchlist) #XTZ maybe worth it to add this coin to your Watchlist. 👀
add to watchlist means the coin we mentioned is forming a pattern or moving near a historical bottom, around or above good support, increase in trading volume , showing a reversal candle, accumulation stage, etc, but no reaction from bulls, so we inform you to add it to your watchlist until the right time for entry.!!
Ps:
we avoid trading any coin if the entire project for it is based on gambling, prostitution, human trafficking, etc.
This is not financial advice, The purpose of these Charts to give you an idea about coin movement (not buy or sell signal) so before following any idea be sure to do your own research, and follow your risk management. Also, the information we mentioned here is a personal effort that is subject to success or failure and we welcome constructive criticism.
Pressing the "like button" and leaving your "comments" below our ideas is great and supports us in providing more ideas.❤️
Good luck to All.
🙏we ask Allah reconcile and repay🙏

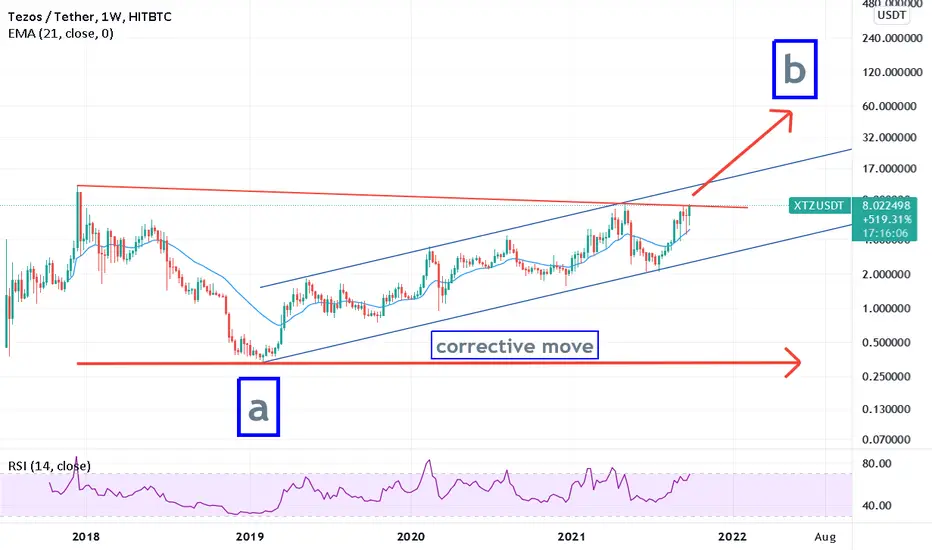
New ATH for TezosOver the next months XTZUSD will reach new ATH. The weekly bars have long wicks (green arrow), reaching to the 21-weekly EMA, which is bullish. The downwards trendline (red) will soon be broken, and later, the blue channel will be left to the upsite.
Anyway, tezos clearly showed a corrective pattern during the last years corrresponding to a wave b of an abc correction (which will be a running flat). Therefore perhaps during Q2 of next year a brutal downmove is to be expected.
₿ XTZUSDT 1W ₿ : 03.Oct.2021 : Long ✅🚀Well, as we know , According to the first time we introduced this currency and offered to buy it, this currency has gained 115% profit . Now is another great opportunity. the TEZOS is powerfully trying to break the Pitchfork midline resistance for the third time ... From here, we can expect at least 50% profit from this awesome cryptocurrency .
⚠️ This Analysis will be updated ... BINANCE:XTZUSDT
👤 Arman Shaban : @Ar_M_An_4
📅 03.Oct.2021
⚠️(DYOR)


#TEZOS #XTZ 4H CHART ANALYSIS#TEZOS #XTZ 4H CHART ANALYSIS
TARGETS:
1- 10$
2- 11$
3- 14$
STOP LOSS: 6.39
ENTRY 7.6-7$
Based on the formation of the triangle pattern as well as the movement channels and the use of Fibonacci, one can expect the price to grow to the specified targets.

XTZUSDT DThe XTZ has formed a triangle in the 4-hour timeframe that it has broken and has to pullback, and in the daily timeframe it is forming a cup pattern, and if the 7.9 resistance breaks, it has long-term goals that will move to $ 11.
