South Korea pumped Tezos!
Overnight, Tezos (XTZ) rose by more than 14% as trading volume in South Korea exceeded its monthly average by seven times.
This also led to the liquidation of about $500,000 worth of positions, after which the value of the coin, as is usually the case, began to gradually decline.
XTZUSDT trade ideas

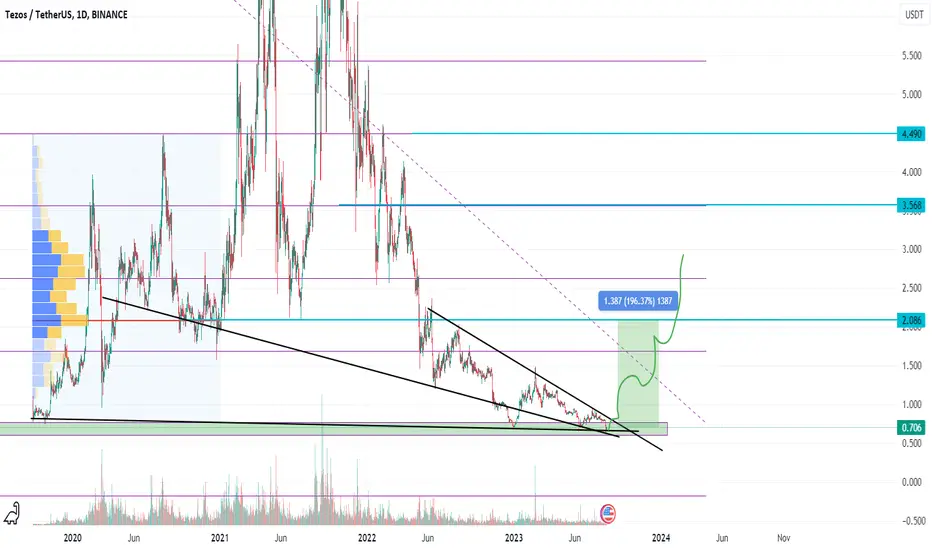
XTZUSDT → Breaking resistance, entering a new rangeBINANCE:XTZUSDT tried to break the support at 0.708 and let the price go lower, but at some point the market held the area, forming a local bottom. After a false break of support, the price breaks consolidation resistance
At the moment the market is testing the possibility of transition from the consolidation phase to the phase of realization of the accumulated potential, which can be accompanied by distributive growth. The price fixing above 0.708 level will confirm the entry into the range (new corridor) and in this case Tezos/TetherUS will open for itself the way to the setup resistance. The 3-4 month accumulation in the coin can give us a pretty good medium-term potential, within which the market can hit targets such as: 0.921 and 1.259.
The price is breaking MA-50 and aims to test MA-200.
Support levels: 0.708, 0.633
Resistance levels: 0.742, 0.921
In the long term, I expect the bulls to consolidate the market above 0.708 and form a distribution towards 0.921
Regards R. Linda!

XTZ - 04/10/23 #XTZ
Bounced off the $0.655 DEMAND and has rebounded into a pivot at $0.67 and was rejected this could have been a liquidity hunt on the fractal times, still needs to get above the 50 EMA to continue upwards!

XTZ/USDT WHAT NEXT? 👀 Tesoz today analysis💎 Paradisers, turn your attention to XTZUSDT! We've observed it poised for a remarkable move, having recently retested the descending trendline and now setting the stage for potential outcomes.
💎 A brief retrospective reveals that Tezos has been adhering to a descending trendline, facing rejection thrice. Interestingly, it managed to break above this trendline only to face another rejection from the upper daily resistance.
💎 Currently, as it retests the trendline, there's a strong likelihood that, after a minor pullback, it might experience a decline.
💎 However, there's a silver lining. Should the price surpass the 0.700 mark, we're hopeful that XTZ will embark on a bullish journey, potentially reaching the Extreme and Bearish OB and supply zones.
💎 Remember to employ prudent trading strategies and use proper stop-loss measures! Stay alert to market movements and look forward to more insights!

XTZ TEZOS Buy TF H4 TP = 0.6963On the 4-hour chart the trend started on Sept. 14 (linear regression channel).
There is a high probability of profit taking. Possible take profit level is 0.6963
But we should not forget about SL = 0.6276
Using a trailing stop is also a good idea!
Please leave your feedback, your opinion. I am very interested in it. Thank you!
Good luck!
Regards, WeBelieveInTrading

XTZ LONG IDEASETUP IN CHART..
TP : target the recent high
Entry: Order block
SL: Below the swing low

XTZ/USDT Will We See Further Drop?Hey traders👋
Short answer is YES, we should see a further drop from current market price! We are going to look for price to reach that lower support zone from where on we want to see a breakdown to happen!
But before the major movement here we need a smaller confirmations as well so we are keeping an eye on candle movements!!
If you like ideas provided by our team you can show us your support by liking and commenting.
Yours Sincerely,
Swallow Team
Disclamer:
We are not financial advisors. The content that we share on this website are for educational purposes and are our own personal opinions.

🚨 Trade Update: XTZ/USDT (3-5x)🚨 Trade Update: XTZ/USDT (3-5x)
📈 Long Entry: 0.612 - 0.696
OTE (Optimal Trade Entry): 0.651
SL: 0.565
B/E Move: When it moves close to TP2
TPs:
Short Term: 0.710 - 0.725 - 0.740 - 0.760 - 0.790 - 0.820
Mid Term: 0.860 - 0.910 - 0.970 - 1.05 - 1.15 - 1.33
**Disclaimer: Past profits do not guarantee future results.
Is there a risk? Of course. The whole financial market is subject to risk; any fundamental reason or sudden change in the market sentiment can reverse the current market dynamic and cause a loss. Do not take excessive risks which you cannot afford to lose. There is no obligation to take this trade; please avoid the trade if you disagree with the trade analysis.
EDK FORUM TRADING®

Movie to resistanceByo movie to high level with 10% profit
trend now is renge and wait for break at support and next open buy position

XTZUSDT - endless downtrendHello everyone! Today we will consider XTZUSDT. One thing is clear about the coin so far - the trend is not planned to change. Even though the most important coins of the crypto market - ether and bitcoin somehow try to look up, XTZUSDT can't even raise his head. Therefore, I am waiting for the price even lower, for the last local minimum of 0.55 to begin with.

XTZ/USDT longEntry
0.655 to 0.702
OTE: 0.680
Targets
0.709
0.716
0.725
0.735
0.745
0.760
0.775
0.795
0.82
0.85
0.89
0.94
0.99
1.05
SL
0.632

XTZUSDT - to the moon There is a buildup going on with the potential for an exit and a huge 200% pump up. It could happen this year. See my past ideas to see what has worked and how it has worked in the past. My description is not much different from the past, I don't know what to write here, it's all on the chart.
$XTZ, 2D Sell signal CRYPTOCAP:XTZ
just flashed a 2D Sell signal on the UCTS indicator, turning bearish once again.
First significant target based on Fib levels is at $0.75.

XTZ/USDT looks good for a buy...hmm?Hey traders 👋
XTZ/USDT is another coin that caught our attention here. We will keep it short. Support was almost broken, but still holding and EMAs have still room to have a small fall from upper zones in order to get closer to Market Price.
Waiting and keeping eyes opened!
Have a great start of the day
Swallow Team
P.S - If you like ideas provided by our team you can show us your support by liking and commenting.

XTZUSD ❕ descending wedgeThe asset formed a descending wedge.
XTZ reached the support level.
I believe that the asset will rebound after holding the support level.

XTZ groped the bottomLooks like XTZ hit bottom. Both RSI and ADX signal a divergence here. I consider about opening a pretty massive middle-term long position after downtrend breakthrough.

XTZ/USDT possible "double bottom" ???Hey traders 👋
ZTX if the first coin for today where we see a nice potential for some bullish movement to happen! It is very early still to talk about this gameplay BUT we see a good potential for it as we see a formation of "double bottom" pattern here. Keep an eye also on EMA lines as they will be the first indicators for bullish run here.
BUT be also prepared for some bearish movement here if we get a breakdown from that lower support zone!
If you like ideas provided by our team you can show us your support by liking and commenting.
Yours Sincerely,
Swallow Team
Disclamer:
We are not financial advisors. The content that we share on this website are for educational purposes and are our own personal opinions.

They call him: Jeff TezosXTZ has a special place in my memory for having one of the most, if not maybe the most unhinged community in the space.
I hope that's still the case.
I haven't touched it in a while but I started to like the look of the chart in higher time frames.
The daily chart looks very similar today when compared to AKRO a few days ago.
Same strategy, 10 EMA's, no candle patterns.
If I were to guess I would say we are still in an accumulation period. Maybe half way, maybe 3/4 of the way.
Actually this is a good case study for the strategy. If the price line fails to move through the lowest orange EMA it could create a resistance level and fall further but imo the market is looking strong.
Win, share, educate.

XTZ hitting bottom of channel, rise comingIt's a weird megaphone/parallel looking channel.
Regardless,
it's the bottom of the channel, and the it's expected to rise as the RSI MA and RSI (5) are both in oversold along with the channel.
Strictly from chart analysis, this is looking like it will rise ot $0.94 very soon.
Volume profile in comments below

XTZUSDTXTZUSDT is in neutral to bearish parallel channel. Currently the price is at support of the channel and it seems like price may grow from here. What you guys think of it ?

XTZ/USDT bouncing from one side to anotherHey traders 👋
Another coin that caught our attention is XTZ coin with a good potential for bigger drop here to happen. It is early now to enter but we have to always be ready in advance. Slightly downwards movement is here which is seeking for a bigger breakdown here to lower zones. Keep that in mind and search for good entry here!
If you like ideas provided by our team you can show us your support by liking and commenting.
Yours Sincerely,
Swallow Team
Disclamer:
We are not financial advisors. The content that we share on this website are for educational purposes and are our own personal opinions.

$XTZ, Looking for a higher high that enables continuationCRYPTOCAP:XTZ
Some PTSD trading this but the signal is there and I have to respect it
Looking for a higher high that enables continuation
will see how it goes.

#LQR #TOBTC #XTZ Tezos is below a great fibonacci level as resistance 0.866 need to break out first
first important Support for Deep Correction are Painted.
