XTZ IS BULLISHHi, dear traders. how are you ? Today we have a viewpoint to BUY/LONG the XTZ symbol.
For risk management, please don't forget stop loss and capital management
When we reach the first target, save some profit and then change the stop to entry
Comment if you have any questions
Thank You
XTZUSDT trade ideas

XTZUSDT wants the liquidity?XTZUSDT is a cryptocurrency pair that recently experienced a rejection from the 1.450 area, which is a significant daily resistance level. As a result, the price of XTZUSDT has pulled back and is currently testing the 4-hour support level at 1.080 area, where it has previously created a double bottom pattern.
If the current support level fails to hold, it could potentially lead to further downward pressure on the price of XTZUSDT. In such a scenario, traders may consider opening short positions and targeting the 1$ area, which is a key liquidity zone and demand zone for the market. This is because the price could potentially reach this level before a new bullish impulse occurs, according to market analysis.
According to Plancton's strategy , we can set a nice order
–––––
Keep in mind.
🟣 Purple structure -> Monthly structure.
🔴 Red structure -> Weekly structure.
🔵 Blue structure -> Daily structure.
🟡 Yellow structure -> 4h structure.
⚫️ black structure -> <= 1h structure.
–––––
Follow the Shrimp 🦐

#Tezos Drops 12% From March Highs, XTZ Finds Support At $1.06Past Performance of Tezos
Tezos remains under pressure despite bullish network enhancement. On March 30, bears quickly wiped out gains of March 29, swinging price action back to bearish territory. As it is, XTZ is down 12 percent from March highs and 24% from February highs. Based on the XTZ candlestick arrangement, the coin has support at $1.06 but is within a bullish trend following gains from mid-March.
#Tezos Technical Analysis
Even though Tezos is edging lower at spot rates, the coin is bullish, considering that the better part of Q1 2023 was a net positive for holders. Specifically, XTZ has support at around the 61.8% Fibonacci retracement of the Q1 2023 trade range. The immediate reaction points stand at $1.06 and $0.95. Losses at $1.06 may force even more losses. However, recovery from spot rates, preferably above $1.20, could be the building blocks for the leg up toward March high at $1.26 and later $1.50 if buyers press on.
What to Expect From #XTZ?
Tezos is bullish from a top-down preview. However, the coin has been oscillating from a wide trade range since early February. The first resistance level lies at March 2023 highs. If buyers reject bears, any breakout above this lie may see XTZ add to their gains in a buy trend continuation formation.
Resistance level to watch out for: $1.20
Support level to watch out for: $1.06
Disclaimer: Opinions expressed are not investment advice. Do your research.

XTZUSDT has changed the local trendHello everyone. Well, apparently there is a small growth ahead of us, since many coins have already taken a trend for a long time. So it will be based on the general picture. An adequate input in such a situation has XTZUSDT . The coin has broken through the trend on the short and is now testing both it and the support level at the same time. The goal of the movement is the area of 1.184. And we will put the stop at about 1.072 for the level.

$XTZ- oracle gang is a go .. waiting for link to break bad and the rest to follow this is too tempting to ignore so hopped on
invalidation below 10 ema and range low
target tad under $2
monthly end soon so may get stopped but will hop back on with a reclaim
stoch crossing in bullish territory .
made a killer trade on this last year and then shorted it as i took profit which was not a great move since this bubba goes to beast mode once it starts trending ..( gave back profits and more ;) )
this time around looking to not give back gains hence being a bit more conservative.. for now.

#XTZUSDT Daily Chart
Price previously bounced off the daily breaker zone around $0.96 and it recently retested the second daily breaker around $1.13 where it bounced off once again. MACD turned bullish, RSI is bought and EMAs are neutral. I expect price to keep moving upwards aiming towards the 4h supply around $1.4.

🔥 XTZ Climax Top Likely In: High Volume Reversal CandleXTZ has seen the most volume traded today since December 2021. This, combined with a reversal candle on the daily chart, makes me believe that today was a so called "climax top".
In my view, XTZ has most likely topped for now. I'm looking for a move back towards the $1 level.
However, if BTC can manage to see some gains in the near future, we might reverse before $1. Volume like this sets off alarm bells, so I'm waiting for $1.

XTZUSDT Idea and AnalysisHI dear traders!
The 200-Day SMA has become a support line for the uptrend and the bullish major channel is still valid.
After price crossing the short-term and downward trend line (The minor trend channel), the price moves bullish towards the daily pivot point.
✅ ✅ Risk warning, disclaimer: the above is a personal market judgment and analysis based on published information and historical chart data on The trading view,
And only some of these analyzes are my actual real trades.
I hope Traders consider I am Not responsible for your trades and investment decision.

XTZUSDT IdeaXTZUSDT XTZUSD BINANCE:XTZUSDT COINBASE:XTZUSD
✅ ✅ Risk warning, disclaimer: the above is a personal market judgment and analysis based on published information and historical chart data on The trading view,
And only some of these analyzes are my actual real trades.
I hope Traders consider I am Not responsible for your trades and investment decision.

XTZUSDTXTZ has strongly broken up the accumulation triangle and the MM200 and is now chasing the upper edge of the Keltner channel at 1.147
Tezos is a layer 1 (L1) independent blockchain, which means that it runs independently. One of the main advantages of Tezos is on-chain governance. This means that the core protocol can be updated through a democratic process, integrated into the blockchain code itself.
On-chain governance allows regular fork-free updates without the need for complex consensus and policy.
After a proposal is injected, voting is done on the chain and anyone who owns XTZ has voting power. After a majority vote, the protocol automatically implements the update without third-party interference.
Follow the support and resistance on the 8H
S: 1,038 / 0,945
R: 1,147 / 1,205

XTZ wait for the bulls ↗️ Analysis #18/50Hello TradingView Family / Fellow Traders. This is Richard, also known as theSignalyst.
on DAILY: Left Chart
XTZ is overall bearish , however we are approaching a strong support and round number 1.0 So we will be looking for buy setups on lower timeframes.
on H4: Right Chart
XTZ is bearish from a short-term perspective trading below the red trendline.
🏹 Trigger => for the bulls to take over, we need a new high to form and then a break above the upper red trendline and red zone.
Meanwhile, until the buy is activated, XTZ can still trade lower till the 0.95 - 1.0 support zone .
📚 Always follow your trading plan regarding entry, risk management, and trade management.
Good luck!
All Strategies Are Good; If Managed Properly!
~Rich

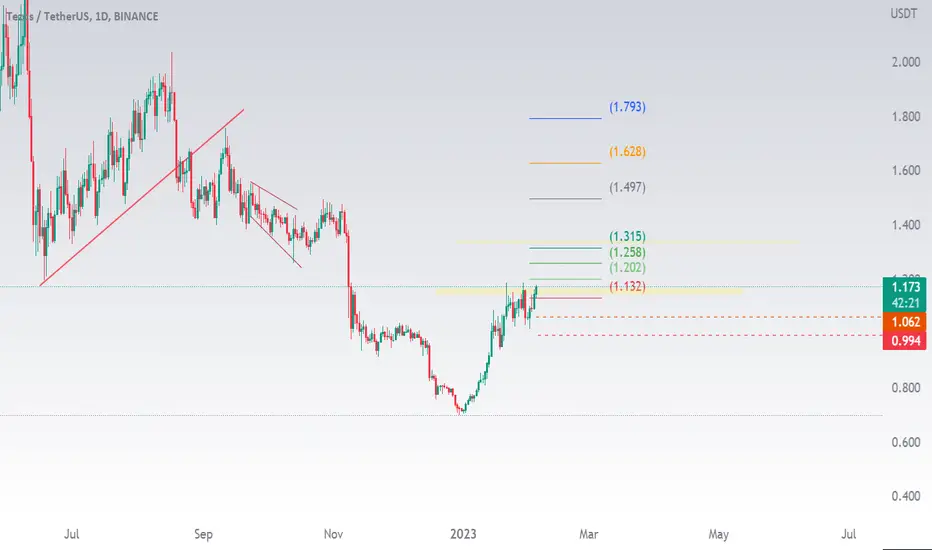
Tezos possible Path...After the price growth to the resistance area of 1.5, we see a drop back to 1.2. Here it is necessary to wait for the next move and determine the direction of the trade.

TezosToday is the second day of the speech of the head of the FRS, Mr. Jerome Powell. All traders are looking forward to its end, because most likely it will decide the future fate of the financial markets. During yesterday's speech, Bitcoin showed increased volatility throughout the hour. But it closed at the opening price of the hour. As for altcoins, after their dump they made a deeper correction than Bitcoin. Cryptocurrency Tezos is one of my trades that I opened at the beginning of this year, and still have not fixed a profit. Although the results exceeded all expectations. I remain optimistic and I think that after today's speech, Bitcoin will continue to grow and pull altcoins with it. I plan to close my positions when Bitcoin reaches $30,000. The chart shows how Tezos formed a diverging channel. Now we are near the lower level of this channel. And most likely we will make a U-turn and go up after Bitcoin.

Tezos possible Path...Due to the failure to break the resistance zone, it is possible to correct the price up to the range of 1.2.

#XTZUSDT 6H Chart
Price retested the support around $1.15 where it bounced from and it is currently in a range showing no major movements. MACD is showing bearish weakness, RSI is slightly sold and EMAs are neutral. I expect price to retrace toward the $1.3 area where we have a minor breaker zone before continuing to move down towards the 12h demand around $1.04.

Finally Xtz Breakingout Formed & breaking Descending channel In Daily Timeframe
After Successful Breakout Expecting 150 to 160% bulish Move Keep Eyes On Xtz


XTZUSDT bounce possible longToday let's look at XTZUSDT. The coin has been walking between two levels for about a month. The price tried to break through the level 1.185 twice, but could not hold and went down. Now the picture is as follows: we are following the trend and it is already fixed at the resistance level, which now serves as support. Therefore, it is quite possible that we will go up to the next resistance level at 1.343. Let's put a stop behind the trendline at 1.199.

XTZUSDT wants the breakout?The price of XTZUSDT has been attempting to break out from the resistance level at $1.2, which is a significant level of resistance that has been tested several times in the past.
However, the price of XTZUSDT has recently made a clear breakout from a descending channel, which is a bearish technical pattern that is formed by connecting the price highs and lows with two downward sloping trend lines. A breakout from a descending channel is a bullish sign that suggests that the downtrend is coming to an end and the price may be ready to move higher.
Furthermore, the price of XTZUSDT has bounced off the 0.618 Fibonacci retracement level, which is a commonly used technical analysis tool that is based on the Fibonacci sequence. This retracement level is considered to be a significant level of support and resistance in the markets, and the fact that the price bounced off this level is a bullish sign.
Taken together, the breakout from the descending channel and the bounce off the 0.618 Fibonacci retracement level suggest that the price of XTZUSDT may be ready to break through the resistance level at $1.2 and move higher., so According to Plancton's strategy , we can set a nice order
–––––
Keep in mind.
🟣 Purple structure -> Monthly structure.
🔴 Red structure -> Weekly structure.
🔵 Blue structure -> Daily structure.
🟡 Yellow structure -> 4h structure.
⚫️ black structure -> <= 1h structure.
–––––
Follow the Shrimp 🦐

Hidden Bullish Divergen ?i just found this hemm looks promising!, hope PUMP SOOON
because : 1. Price Make Higher Low
2. Indicator Make Lower Low


XTZ Trade Setup in short time>>>>>>>Hello EveryOne
I Have Tried My Best to Bring the best Possible outcome in this Chart.
XTZ can break out from static resistance ,
and completed pullback from support area .(Entry point)
dou to the more support market We can set buy position in daily correction.
Short term Support & resistance's marked on the chart.please buy in correction and set your stoploss.
All TP marked on the chart.
SPOT & Futures trade.
It's just an analyze,
Not a financial advise.
PLZ DYOR
With hopping success>>>>>>>>
xtz usdt tezos possible playout chart in the next few weekstezos playing out the fractal as drawn previously. now lets wait and see if it holds the accumulation marked in a few weeks.
