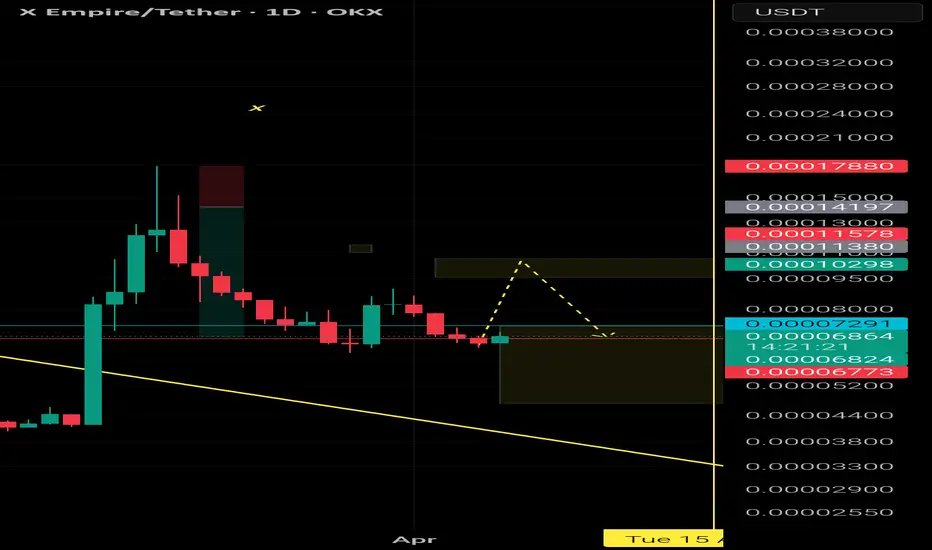
XUSDT ( new Update )It appears that we will witness a price decline to the range specified in the image. It is expected that an upward movement will emerge from the identified zone, which will not result in a new peak. (This is because the previous upward movement did not create a new peak, and based on this analysis,

X Empire AnalysisX's position is now in the B wave of its second wave. In the picture everything is telling
This is just my opinion
The decision is with you
Good days are on the way

XUSDT Bullish zoneIn my opinion, the downward trend of XUSDT will continue until it reaches the specific level indicated in the image, which is expected to occur in April. At that point, it will be poised for its main upward movement.


Xusdt If it's meant to happen, which time do you think it will rise? I myself believe in the first time.

X : reversal head and shouldersSetup will be fulfilled with high part of a possibility. There are clear reversal head and shoulders pattern that must be gone to support zone and get /or no reaction from there.

X/USDTBulish run is starting...
It tuch 0.000062 that is static support then move to give it's target 🎯.
What is the target??? 🎯🎯

#X #XUSDT #XEMPIRE #LONG #Scalp #Scalping #Eddy#X #XUSDT #XEMPIRE #LONG #Scalp #Scalping #Eddy
XUSDT.P Scalping Long Setup
Important areas of the upper time frame for scalping are identified and named.
This setup is based on a combination of different styles, including the volume style with the ict style. (( AMD SETUP ))
Based on your stra

Xusdt I think it continues like this.It takes a bit of time, but we're growing insanely—beyond insane!

See all ideas
Summarizing what the indicators are suggesting.
Oscillators
Neutral
SellBuy
Strong sellStrong buy
Strong sellSellNeutralBuyStrong buy
Oscillators
Neutral
SellBuy
Strong sellStrong buy
Strong sellSellNeutralBuyStrong buy
Summary
Neutral
SellBuy
Strong sellStrong buy
Strong sellSellNeutralBuyStrong buy
Summary
Neutral
SellBuy
Strong sellStrong buy
Strong sellSellNeutralBuyStrong buy
Summary
Neutral
SellBuy
Strong sellStrong buy
Strong sellSellNeutralBuyStrong buy
Moving Averages
Neutral
SellBuy
Strong sellStrong buy
Strong sellSellNeutralBuyStrong buy
Moving Averages
Neutral
SellBuy
Strong sellStrong buy
Strong sellSellNeutralBuyStrong buy
Displays a symbol's price movements over previous years to identify recurring trends.