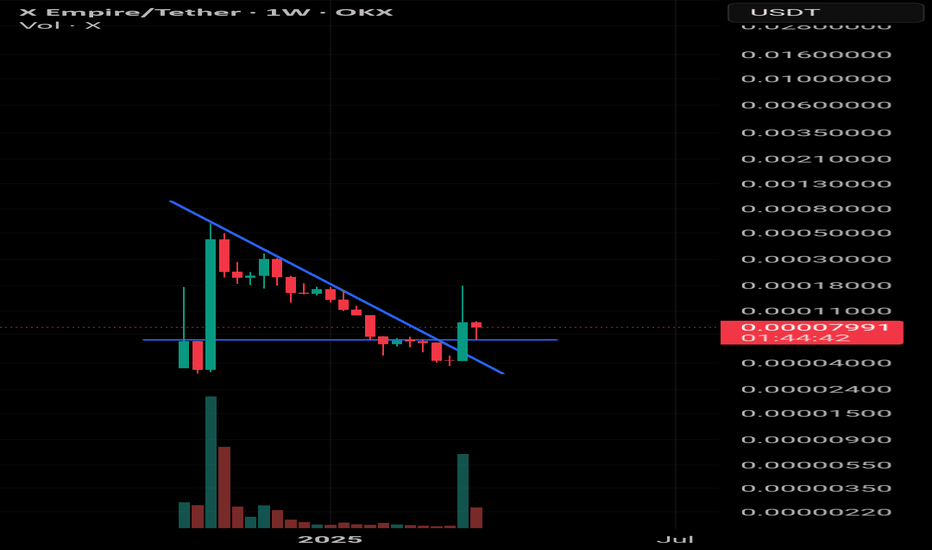
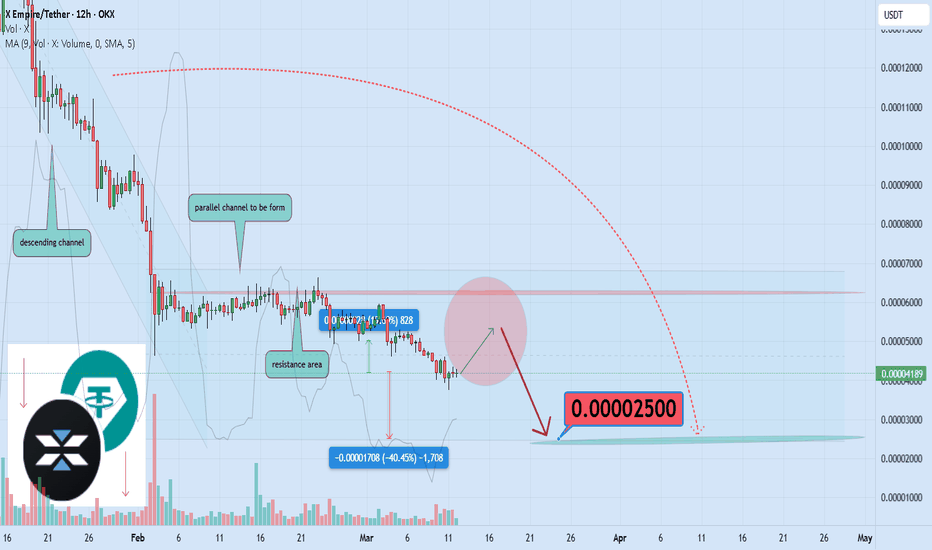
X EMPIREOKX:XUSDT x is about to come to the end of the convergence and consolidation zone of the large triangle area, and is about to give out the direction, whether it is up or down, let us see this Alt coinby phoa09Updated 262669
#xusdt #x_EMPIREwe are passing accumulation phase after 2 week also we break 25 D trendline plus we are touching golden pocket for last big upward wave I prefer to have this 3 long option setup furthermore there is big time Divergence happening Goodluck Longby MSHLFXUpdated 9976
Don't Feed Stop Hunters !Bad Location for short Bad location for Stop Loss equals to Feeding Stop Hunters ... Trade Smart :)by hosseinshamloo558
#xusdt #X_Empire log setup 15Mwe are going to pass accumulation phase. we broke downward trendline delta showing upward we need some volume to smash resistance level Longby MSHLFX1120
XUSDTit seems a 3rd or 5th wave of a five wave pattern. first target should be at 0.00075Longby navidh19912221
X is bullish !#X is making an ABC pattern which the B wave has 5 waves like ABCDE after making the E wave the market should go down to make the C wave as usual i looked for a good liq that market is looking to grab and i found it in 2 demand zones which has overlap with fibo levels !Longby stratus_co17
XUSDT | Mapping Out Possibilities | Near Term (4HR)XUSDT | Mapping Out Possibilities | Near Term (4HR) As part of my profit taking strategy, I like to go through and map out potential levels of interest based on semi-bullish to very bullish mock up price action using fractals and fibs. Based on concept of money flow... BTC, then ETH, then Large Caps, Then Mids and Smalls, I am personally heavier skewed loaded up on mid to small cap coins with bullish chart setups and high profit potentials. I think its that time again for X... I enjoy and target coins like this without any historical price data, that enter into price discovery. Additional altcoin near term and midterm chart ideas listed below. OLUSDT | Mapping Out Possibilities | Near Term (4HR) GRASSUSDT | Mapping Out Possibilities | Near Term (12HR) ALGOUSDT | Mapping Out Possibilities | Near Term (12HR) GRASSUSDT | Mapping Out Possibilities | Mid Term (1D) XUSDTUSDT | Mapping Out Possibilities | Mid Term (1D) MYRIAUSDT | Mapping Out Possibilities | Mid Term (1D) GHSTUSDT | Mapping Out Possibilities | Mid Term (1D) DOGSUSDT | Mapping Out Possibilities | Near Term (4HR) DEGENUSDT | Mapping Out Possibilities | Mid Term (1D) MANEKIUSDT | Mapping Out Possibilities | Mid Term (1D) CSPRUSDT | Mapping Out Possibilities | Mid Term (1D) WLDUSDT | Mapping Out Possibilities | Mid Term (1D) GODSUSDT | Mapping Out Possibilities | Mid Term (1D) AXSUSDT | Mapping Out Possibilities | Mid Term (1D) CHZUSDT | Mapping Out Possibilities | Mid Term (1D) OGNUSDT | Buy Now, Thank Later | Near Term (4HR) XCHUSDT | Buy Now, Thank Later | Near Term (4HR) VRAUSDT | Buy Now, Thank Later | Near Term (4HR) CSPRUSDT | Buy Now, Thank Later | Near Term (4HR) PERPUSDT | Buy Now, Thank Later | Near Term (4HR) TLMUSDT | Buy Now, Thank Later | Near Term (4HR) DODOUSDT | Buy Now, Thank Later | Near Term (4HR) LPTUSDT | Buy Now, Thank Later | Near Term (4HR) VRAUSDT | Buy Now, Thank Later | Near Term (4HR) XCHUSDT | Buy Now, Thank Later | Near Term (4HR) CSPRUSDT | Buy Now, Thank Later | Near Term (4HR) VELOUSDT | Buy Now, Thank Later | Near Term (4HR) UMAUSDT | Buy Now, Thank Later | Near Term (4HR) OGNUSDT | Buy Now, Thank Later | Near Term (4HR) DOTUSDT | Buy Now, Thank Later | Near Term (4HR) VIDTUSDT | Buy Now, Thank Later | Near Term (4HR) BTCUSDT | Alts Poised to Explode | Near Term (2H) Mock Up Price Action for ALGOUSDT | Mid Term (12HR) MYRIAUSDT | Interested to see where this goes | Mid Term (2D) Mock Up Price Action for VRA w/ Timeline | Mid Term (3D) Mock Up Price Action for XCH | Mid Term (12HR) OGNUSDT | Interested to see where this goes | Mid Term (3D) Mock Up Price Action for CSPRUSDT | Near/Mid Term (2D) VIDTUSDT | Interested to see where this goes | Mid Term (3D) RAREUSDT | Interested to see where this goes | Mid Term (3D) Longby Trevictus14
X Empire (X): Growth in Crypto Gaming and Market MomentumAs of December 14, 2024, X Empire (X) is trading at $0.0002245, reflecting a 7.93% gain over the past 24 hours. The token's 24-hour trading volume reached approximately $163 million. Over the past week, X Empire's price increased by 14.41%, although it remains down 18.91% over the last month. Its all-time high was $0.0005613 on November 10, 2024, while the all-time low was $0.0000333 on November 3, 2024. Key Highlights: Gaming Integration: X Empire is a Telegram-based game combining empire-building and financial rewards. It leverages unique gaming mechanics and an engaging ecosystem to attract users. Market Activity: The token experienced a significant surge earlier, driven by strategic liquidity injections from major market-makers like DWF Labs, which enhanced trading activity and reduced price volatility. Community and Features: X Empire plans additional features such as referral programs and enhanced gameplay mechanics, further cementing its position as a prominent player in crypto gaming/ X Empire's dynamic performance highlights its potential in the crypto gaming and blockchain sectors, with a focus on community-driven growth and innovative gameplay. Disclaimer: Not Financial Advice, Only for Research Purposes.Longby putraworks8
XUSDT | Personally Loading Here | Mid Term (1D)XUSDT | Personally Loading Here | Mid Term (1D) As part of my profit taking strategy, I like to go through and map out potential levels of interest based on semi-bullish to very bullish mock up price action using fractals and fibs. Based on concept of money flow... BTC, then ETH, then Large Caps, Then Mids and Smalls, I am personally heavier skewed loaded up on mid to small cap coins with bullish chart setups and high profit potentials. I think its getting close for X to make another move... This looks like a good area to load up for me personally. Additional altcoin near term and midterm chart ideas listed below. DEGENUSDT | Personally Loading Here | Mid Term (1D) DARUSDT | Personally Loading Here | Mid Term (1D) VRAUSDT | Personally Loading Here | Mid Term (1D) DRIFTUSDT | Mapping Out Possibilities | Near Term (4HR) XUSDT | Mapping Out Possibilities | Near Term (4HR) OLUSDT | Mapping Out Possibilities | Near Term (4HR) GRASSUSDT | Mapping Out Possibilities | Near Term (12HR) ALGOUSDT | Mapping Out Possibilities | Near Term (12HR) GRASSUSDT | Mapping Out Possibilities | Mid Term (1D) XUSDTUSDT | Mapping Out Possibilities | Mid Term (1D) MYRIAUSDT | Mapping Out Possibilities | Mid Term (1D) GHSTUSDT | Mapping Out Possibilities | Mid Term (1D) DOGSUSDT | Mapping Out Possibilities | Near Term (4HR) DEGENUSDT | Mapping Out Possibilities | Mid Term (1D) MANEKIUSDT | Mapping Out Possibilities | Mid Term (1D) CSPRUSDT | Mapping Out Possibilities | Mid Term (1D) WLDUSDT | Mapping Out Possibilities | Mid Term (1D) GODSUSDT | Mapping Out Possibilities | Mid Term (1D) AXSUSDT | Mapping Out Possibilities | Mid Term (1D) CHZUSDT | Mapping Out Possibilities | Mid Term (1D) OGNUSDT | Buy Now, Thank Later | Near Term (4HR) XCHUSDT | Buy Now, Thank Later | Near Term (4HR) VRAUSDT | Buy Now, Thank Later | Near Term (4HR) CSPRUSDT | Buy Now, Thank Later | Near Term (4HR) PERPUSDT | Buy Now, Thank Later | Near Term (4HR) TLMUSDT | Buy Now, Thank Later | Near Term (4HR) DODOUSDT | Buy Now, Thank Later | Near Term (4HR) LPTUSDT | Buy Now, Thank Later | Near Term (4HR) VRAUSDT | Buy Now, Thank Later | Near Term (4HR) XCHUSDT | Buy Now, Thank Later | Near Term (4HR) CSPRUSDT | Buy Now, Thank Later | Near Term (4HR) VELOUSDT | Buy Now, Thank Later | Near Term (4HR) UMAUSDT | Buy Now, Thank Later | Near Term (4HR) OGNUSDT | Buy Now, Thank Later | Near Term (4HR) DOTUSDT | Buy Now, Thank Later | Near Term (4HR) VIDTUSDT | Buy Now, Thank Later | Near Term (4HR) Longby Trevictus13
xOnce in the green box area, we had an upward reaction. If this time, this area is broken, we can buy at lower points. The first resistance in the lower time frame is the red box.by hosseinghaffari677
XUSDTUSDT | Mapping Out Possibilities | Mid Term (1D)XUSDTUSDT | Mapping Out Possibilities | Mid Term (1D) This one is ready to pump again As part of my profit taking strategy, I like to go through and map out potential levels of interest based on semi-bullish to very bullish mock up price action using fractals and fibs. Based on concept of money flow... BTC, then ETH, then Large Caps, Then Mids and Smalls, I am personally heavier skewed loaded up on mid to small cap coins with bullish chart setups and high profit potentials. Additional altcoin near term and midterm chart ideas listed below. XUSDT | I am curious to see if it hits | Near Term (12H) MYRIAUSDT | Mapping Out Possibilities | Mid Term (1D) GHSTUSDT | Mapping Out Possibilities | Mid Term (1D) DOGSUSDT | Mapping Out Possibilities | Near Term (4HR) DEGENUSDT | Mapping Out Possibilities | Mid Term (1D) MANEKIUSDT | Mapping Out Possibilities | Mid Term (1D) CSPRUSDT | Mapping Out Possibilities | Mid Term (1D) WLDUSDT | Mapping Out Possibilities | Mid Term (1D) GODSUSDT | Mapping Out Possibilities | Mid Term (1D) AXSUSDT | Mapping Out Possibilities | Mid Term (1D) CHZUSDT | Mapping Out Possibilities | Mid Term (1D) OGNUSDT | Buy Now, Thank Later | Near Term (4HR) XCHUSDT | Buy Now, Thank Later | Near Term (4HR) VRAUSDT | Buy Now, Thank Later | Near Term (4HR) CSPRUSDT | Buy Now, Thank Later | Near Term (4HR) PERPUSDT | Buy Now, Thank Later | Near Term (4HR) TLMUSDT | Buy Now, Thank Later | Near Term (4HR) DODOUSDT | Buy Now, Thank Later | Near Term (4HR) LPTUSDT | Buy Now, Thank Later | Near Term (4HR) VRAUSDT | Buy Now, Thank Later | Near Term (4HR) XCHUSDT | Buy Now, Thank Later | Near Term (4HR) CSPRUSDT | Buy Now, Thank Later | Near Term (4HR) VELOUSDT | Buy Now, Thank Later | Near Term (4HR) UMAUSDT | Buy Now, Thank Later | Near Term (4HR) OGNUSDT | Buy Now, Thank Later | Near Term (4HR) DOTUSDT | Buy Now, Thank Later | Near Term (4HR) VIDTUSDT | Buy Now, Thank Later | Near Term (4HR) BTCUSDT | Alts Poised to Explode | Near Term (2H) Mock Up Price Action for ALGOUSDT | Mid Term (12HR) MYRIAUSDT | Interested to see where this goes | Mid Term (2D) Mock Up Price Action for VRA w/ Timeline | Mid Term (3D) Mock Up Price Action for XCH | Mid Term (12HR) OGNUSDT | Interested to see where this goes | Mid Term (3D) Mock Up Price Action for CSPRUSDT | Near/Mid Term (2D) VIDTUSDT | Interested to see where this goes | Mid Term (3D) RAREUSDT | Interested to see where this goes | Mid Term (3D) Longby TrevictusUpdated 40
New MC Shaped (X Empire)!Watch 4H: The new MC inside a bigger MC has been shaped. If crosses and closed both EMA: Strong Bearish Target 1: $0.0002188, Target 2: $0.0001795 Strong Bullish Target 1: $0.0003356, Target 2: $0.0004137by forexise13
Candlestick Analyzes - Part OneThe Weakest Candle A Spinning Top/Bottom (a candle with the same sized upper and lower shadow) is the weakest and the most important candle for us. Note that the body size of the candle is not important. We analyze it like this: 1. if it appears in the middle of a trend, we expect the trend to continue, as a medium-sized candle in the direction of the trend. otherwise, most likely we will get into range or reversal. 2. If it appears at a key level, until observing the next candle, we cannot analyze what could happen. If there is at least a medium-sized candle in whatever direction, we expect the price to continue in that direction, otherwise, it's a range! Let's look at the chart: - Candle #1 is in the middle of a trend, but after it, we see a bearish candle. So, it's a range or reversal. - After seeing candle #1, we draw the box for the MC candle. So, candle #2 is shaped at the support of it. We have to wait to see what will come after it. Because the next candle is a bearish one, we expect the bearish movement to continue, and it continues. - Candle #3 shaped after a strong breakout. If trends tend to continue, we expect at least a medium-sized candle in the direction of the trend. Otherwise, it'll be a range or reversal coming.Educationby forexise11
X Empire gained mementumX Empire gained mementun,Alt Bull run season is backkkk. Check my previous post for analysis. Longby Taofiqfx9
Using CMP Par indicator for lor long scalpsIn this video I will give tips as to look for good Long Scalp trades using the CMP PAR indicator and spotting hidden bull divsLongby bgoode717
In the worst-case scenario, do nothing!As mentioned previously, when EMAs are close to each other, they become ineffective. This proximity warns that radical behaviour may be imminent, especially when the price is between them. When Bollinger Bands converge, a breakout is close to happening. The direction is unclear. This represents the absolute worst-case scenario a trader can encounter: do nothing!by forexise34
Bearish momentum has been decreased on XUSDTIts risky but It seems neck line of double bottom has breakout, Bear trap ? everything is possible but looks like liquidity taking,Longby hosseinshamloo101060
$xusdt in support zon!?Hi to everybody hold OKX:XUSDT We are in the H4 order blok buy If market maker want can 80%pump U think side way can be 2days ago and we move on 0.00045$ Take care(black friday near) Crypto is hopeby farhadtbn47
EMA, The correct way of usage - Part 4 - minor structure_2To confirm a minor trend, we need to see a Strong Break of Structure (BoS) with the body of a candle, in the direction of the trend. This means in the ARZ Trading System, shadows do not count as breakouts for confirming a trend continuation. let's elaborate on the concept: - after receiving pullback from 13&20EMA in A, the previous low has been broken strongly and made a stBoS. This confirms we are in a minor downtrend. So, from now on we are looking to go short any chance we get. - in B & C we are looking for a reason to sell. but weak BoS after will make us cautious and at #1 we are analyzing and not trading until the direction of the minor trend gets clear. - the strong bullish candle after #1 tells us we are indeed in a ranging market! Not an uptrend. Please note that: the minor uptrend should be confirmed. - in D we see buyers are weak, and at #2 it confirms that a minor uptrend is not going to happen. Now wait for a confirmation of a minor downtrend. - stBoS after E confirms we are in a minor downtrend, so we look for opportunities to sell after F, G, H, & I. - at #3 we are officially in a range again. So, we trade as a ranging market, until J tells us we have to trade downward. - a wBoS after K warns us, and we see the price reversed upward. Weak continuation downward at #4 & #5 confirms it. - the stBoS upward after #5 tells us we are in an uptrend, but a weak pullback up until 6 tells us the uptrend might be done. - Then, there is a stBoS downward after L. So, until it breaks upward and has a strong BoS in that direction, the price could continue declining. Keynote: Short-term traders must always trade in the direction of the minor trend. Unless they are to trade in a ranging market or are medium or long-term traders. Question: do we have to just use periods 13 & 20 for analyzing short-term trends? Answer: Absolutely not! It's the trader's choice only. Educationby forexise22338
XusdtMust be pump with listing in binance future..but market makers moms is…🍪hold for every to target🫡Longby farhadtbnUpdated 6647
X Empire long entrySpot a good long entry here, let see if price will respect my strategy. Longby Taofiqfx18
Don't panic! Uptrend is still valid!As we can see, the price has maintained a minor trend in #1. If we see the same thing in #2, the price will continue upward, and TP targets are based on MC high.Longby forexise26