XVG Ascending Triangle0.045 - 0.055 should be a good support for XVG. Only ideas not financial advisors, Thank you and Happy New Year 😇
XVGUSD trade ideas

XVGUSD, comme un air de skyrokettePendant que ETH XRP et BTC monopolise l'attention des médias et des médiocres, je vous proposes une crypto qui avait déjà fait des riches au précédent Bullrun.
- Large base former
- Test de la résistance à trois belles reprise
- Des plus bas de plus en plus haut
- Pattern de retournement
Pour les agressifs, prendre une position sous résistance avec un stop rechercher en 4H, pour les plus confirmer, attendre la cassure de la résistance avec un pull back, cependant avec un market cap comme celui de XVG, le pull back peut ne jamais arriver, comme XRP quand il casse à la hausse.
Va t'il y avoir de nouveaux gains exceptionnelles.

SOME CRAZY TARGETS FOR XVG VERGEWe may have a zigzag or flat correction as long as it stays above Wave circle b

XVG INVERTED HEAD & SHOULDER PATTERNits a pattern
its big
its perfect
will verge break through that neckline?
stay tuned

XVG TESTING CHANNEL & W PATTERNW pattern of rising lows and highs has the potential to break the neckline
a break of the downtrend channel is also on the table as the upper limit gets tested for support

XVG Parabolic to $0.10 by End of JanuaryNow would be a really good time to consider going heavy on Verge Coin.
This bad boy is setup in the Perfect Parabola. I mapped out what I project the Elliott Waves could look like, and it's way more Bullish than my previous analysis.
Not sure where this Moon Shot will take us, but it reminds me of a quote...
"Shoot for the moon. Even if you miss, you'll land upon the stars."
It doesn't matter if we hit $0.01 or $0.10. Wherever we end up by the end of January is going to be way higher of a % than any other token on the Market so it's an Obvious Buy from me dawg.
**DYOR - NOT FINANCIAL ADVICE**

SEND IT$XVG going to $0.
JK. $XVG broke above the resistance line and has now turned it into support. #MoonBoi
TTM Squeeze on the weekly lit up. MACD crossover.... confluent events $$$$ #profit
Quality content? Yes.
Support the content please.
XVG: D9ghB35MqqUZFQAQExye3LSaoEuPLH5PXe
BTC: 3F5RbadiVapcAeCedxuNkUgpJ7gxfYj9Xh
Hold on for the ride Mr. WeakHands

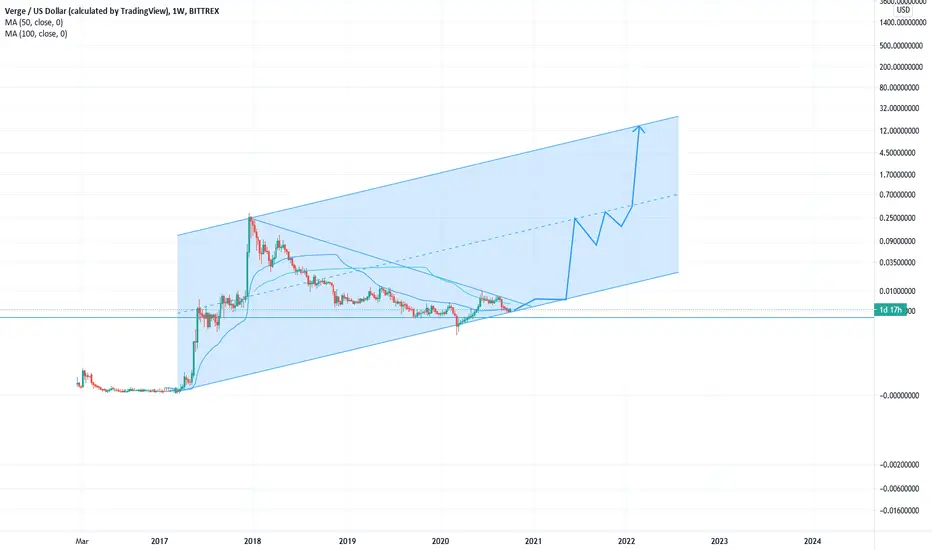
XVG longterm wave 3 just started targeting 5-20 $the long term target is very high.
it could be between $5-20
it is the same for the most altcoins. Be cleaver en wait moon again.

XVG , Moving Above Support !We have a Good resistance on 0.0055 if make a shadow from there we can see good pump to 0.0072


Multi-months Inverse Head N' Shoulder about to conclude Currently drawing the 2nd shoulder of a multi-months Inverse Head & Shoulder pattern on XVG USD, whose neckline is there at 0.01 USD.
But guess what... 200 weekly EMA is sitting on that key level too (at the time I'm writing). It clearly acted as a resistance during last week rally, but if retested will be demolished by the bulls sooner or later.
Always remember, the 200 weekly EMA is certainly the most powerful "ally" of a BULL during a bull-market.
A smart "LONG" call is to eventually trade the breakout, definitely not FOMOing before: there is litterally a "starway to heaven" all above, which will make your entry price ridiculous at the end of the next bull cycle!
NO FINANCIAL ADVISE. INVEST AT YOUR OWN RISK AND ALWAYS DO YOUR OWN RESEARCHES.


Inverse Head&Shoulders $XVG #XVG #VergeFam #VergeCurrency $USDInverse Head & Shoulders...
Expecting .05-.09 cent range in Q1 2021.
Looking to the left seems to be some good resistance there. Similar to what Bitcoin did pushing to 14K back in June 2019.
Not Financial Advice.
Good luck Traders and Hodlers!

XVG .006 SUPPORTthat may be the last time verge is under .006
breaking quickly of 18 MA high/low channel and long term support .006
what is next for xvg?

XVG - EMERGENCYVerge must rally or die
18 wma as resistance
last possible fib retracement
Verge needs to get back over .01 to join in the bull run
I am holding Verge so I want to see this succeed
not financial advice

Verge Currency $XVG fractals and trend-based fib projectionsIs this possible? Probable?
I think it sure has potential. Most of our money supply is on paper anyway.
What do you think?


XVG DYORthere may be some meat on the bone yet
why buy verge when you can just watch it?
not financial advice

another scenario of xvg !As the trading volume did not increase, the probability of this scenario has increased !

Bullish divergence on the dailyXVG has had a rough go since the peak.
There is signs of a reversal though. The daily time frame is showing bullish divergence.
RIP XVG. Long live XVG!

The Bulls are Back in TownRIP XVG. Dropped 80 places in marketcap. Out of the top #100. Next stop!!! #200.
RIP XVG

XVG 1-2 year roadmapTypical shit coin pattern (XVG, XRP, DOGE, TRX ). If you don't set to sell you'll never be able to get out. I doubt it will ever reach $3 unless Donald Trump is going to pump it. McAfee will not be able to pump it the 2nd time.
XVG is forming bullish reversal moveThe priceline of Verge coin has broken down the $0.005 support and moving between $0.005 to $0.003.
SMAs on weekly chart:
On weekly chart the priceline has broken down the 100 and 25 simple moving averages and now likely to break down 50 SMA as well.
Bullish BAT move:
The price action of XVG coin is completing final leg of bullish BAT pattern on long term weekly chart.
As per Fibonacci sequence of bullish BAT the targets are as below:
Potential reversal or buying zone: $0.003321 to $0.002484 (this should be used as stop loss as well otherwise the priceline can move down to form Crab )
Fibonacci projection or sell zone: $0.005317 to $0.008313
Ichimoku cloud on weekly chart:
On weekly chart the priceline has formed a double top at Ichimoku bearish cloud’s upper top. Now the price action of XVG is at the bottom of this cloud and can move more down for the completion of BAT.
Conclusion:
The priceline is likely to take bearish move to the downside. But infact this move can be a bullish reversal, because for the completion of bullish reversal BAT pattern this bearish move is needed.
