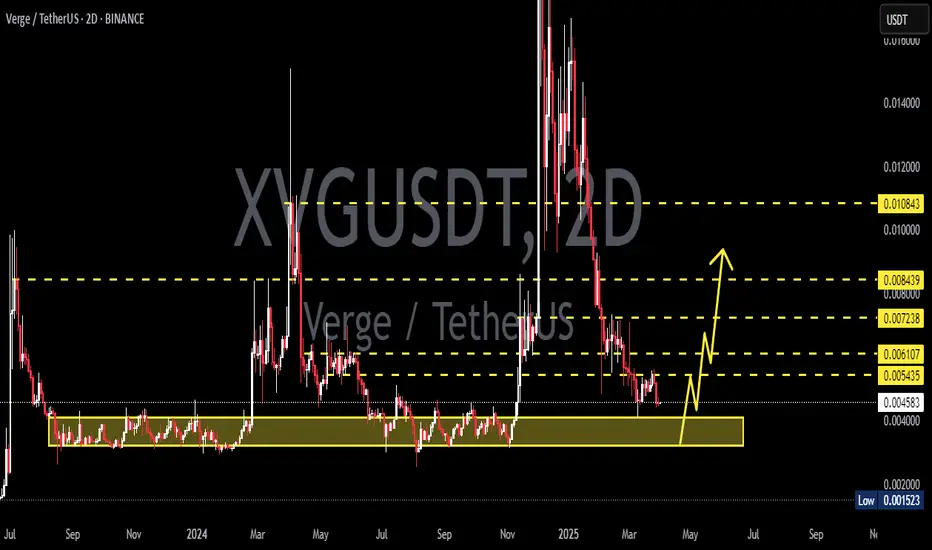
XVGUSDT 2DXVG ~ 2D Analysis
#XVG Buy gradually from here with a short -term target of at least 15%+. This is the previous accumulation area.
XVGUSDT trade ideas
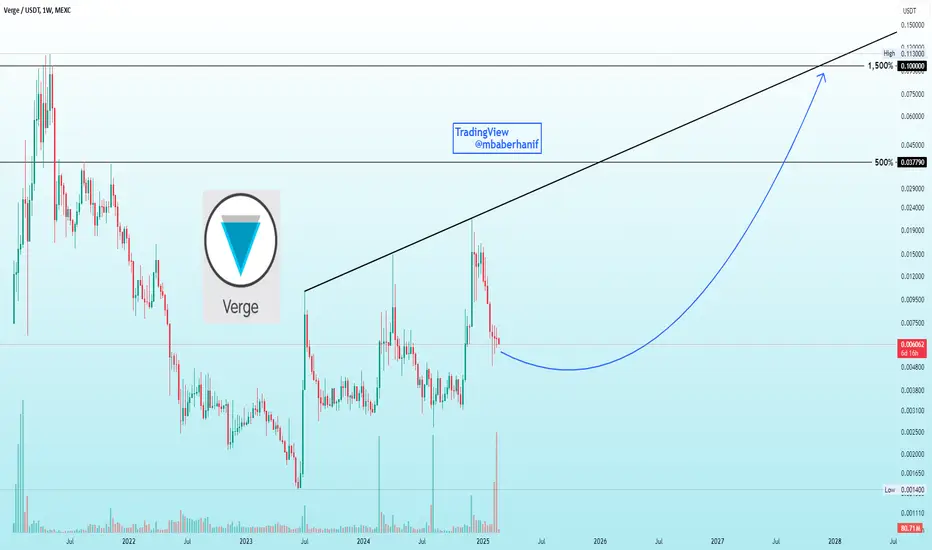
XVG | Will this coin skyrocket 500% to 1,500%?Hey everyone! If you missed OM Coin, which saw more then 36,500% increase in value over the course of a year – trading at $0.025 in December 2023 and recently reaching a high of around $9.17- this is an example of such huge gains. Some people thought it was impossible in 2023, but it already happened in 2025. With altcoin season ahead, I’m considering a potential 1,500% gain in XVG Coin, which seems possible since its previous high was $0.113 in May 2021. Such gains could be achievable in 2025.
This is not a financial advice, just my thoughts. I recommend doing your own research before making any investment decisions. Feel Free to share your ideas in the comments below. Thanks!
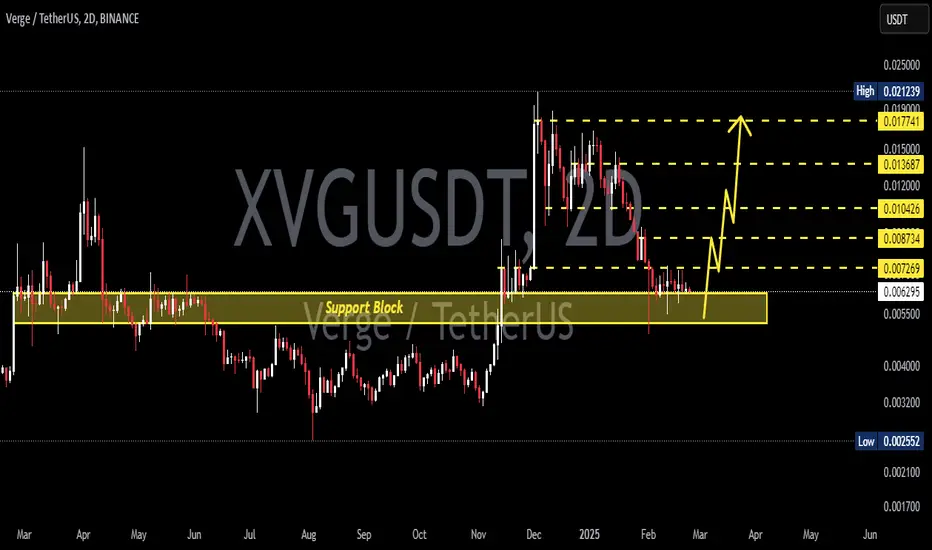
XVGUSDT 2DXVG ~ 2D Analysis
#XVG Support blocks that you might be able to consider to start buying back from here. with a minimum target of 15%+
Verge: Highest Volume EverOn the 19th of February XVGUSDT produced the highest volume ever on the daily timeframe.
See chart below:
This occurrence can signal the start of a new market phase.
Good afternoon my fellow trader....
Here we can see a consolidation channel that is more than two years long. Each time this channel is violated it happens on the upper boundary, resistance, support remains unchallenged as Verge has been producing long-term higher lows.
These are bullish signals. Now we have a very strong weekly volume bar after a mild corrective phase. We are looking at the start of a new bullish market phase.
This is just a friendly reminder. Verge (XVGUSDT) is about to blow-up.
Thank you for reading.
Namaste.

XVG - on the "VERGE" of breaking out!Hello TradingView Family / Fellow Traders. This is Richard, also known as theSignalyst.
📈 XVG has been in a correction phase trading within the falling blue channels.
🏹As XVG approaches the lower bound of the channels, which lines up perfectly with the demand zone marked in red, it would be an attractive zone (at least for me) to look for longs.
🏹On the other hand, for the bulls to take over long-term, a break above the last major high marked in blue around $0.015 is needed.
For now, we wait! ⏱️
📚 Always follow your trading plan regarding entry, risk management, and trade management.
Good luck!
All Strategies Are Good; If Managed Properly!
~Rich

Xvg : verge : is on the verge of breaking higherXvg has formed a nice channel to the downside.
I think she will pump hard.
Time for her to get back at 10 cents .
Soon all time highs , it is the year of OGs.
She will follow xrp.

#XVG/USDT Analysis 📈 #XVG/USDT Analysis 📈
SGX:XVG is holding strong at the 4H bullish Order Block and showing potential for a long entry.
📌 Resistance: PWH $0.014538

XVG/USDTKey Level Zone: 0.013030 - 0.013460
HMT v4.1 detected. The setup looks promising, supported by a previous upward/downward trend with increasing volume and momentum, presenting an excellent reward-to-risk opportunity.
HMT (High Momentum Trending):
HMT is based on trend, momentum, volume, and market structure across multiple timeframes. It highlights setups with strong potential for upward movement and higher rewards.
Whenever I spot a signal for my own trading, I’ll share it. Please note that conducting a comprehensive analysis on a single timeframe chart can be quite challenging and sometimes confusing. I appreciate your understanding of the effort involved.
Important Note :
Role of Key Levels:
- These zones are critical for analyzing price trends. If the key level zone holds, the price may continue trending in the expected direction. However, momentum may increase or decrease based on subsequent patterns.
- Breakouts: If the key level zone breaks, it signals a stop-out. For reversal traders, this presents an opportunity to consider switching direction, as the price often retests these zones, which may act as strong support-turned-resistance (or vice versa).
My Trading Rules
Risk Management
- Maximum risk per trade: 2.5%.
- Leverage: 5x.
Exit Strategy
Profit-Taking:
- Sell at least 70% on the 3rd wave up (LTF Wave 5).
- Typically, sell 50% during a high-volume spike.
- Adjust stop-loss to breakeven once the trade achieves a 1.5:1 reward-to-risk ratio.
- If the market shows signs of losing momentum or divergence, ill will exit at breakeven.
The market is highly dynamic and constantly changing. HMT signals and target profit (TP) levels are based on the current price and movement, but market conditions can shift instantly, so it is crucial to remain adaptable and follow the market's movement.
If you find this signal/analysis meaningful, kindly like and share it.
Thank you for your support~
Sharing this with love!
HMT v2.0:
- Major update to the Momentum indicator
- Reduced false signals from inaccurate momentum detection
- New screener with improved accuracy and fewer signals
HMT v3.0:
- Added liquidity factor to enhance trend continuation
- Improved potential for momentum-based plays
- Increased winning probability by reducing entries during peaks
HMT v3.1:
- Enhanced entry confirmation for improved reward-to-risk ratios
HMT v4.0:
- Incorporated buying and selling pressure in lower timeframes to enhance the probability of trending moves while optimizing entry timing and scaling
HMT v4.1:
- Enhanced take-profit (TP) target by incorporating market structure analysis

Prepare to BUY Spot XVGUSDT (D1 Cycle)
🌟 XVGUSDT is entering a new D1 cycle – A great opportunity for short-to-mid-term gains! 🌟
🌍 Market Overview:
XVGUSDT is showing strong bullish potential on the D1 timeframe. This creates a strategic entry to capitalize on the upward movement once the bottom is confirmed.
📊 Trade Plan:
📌 Entry Point:
Around $0.0088 or near that level after forming a clear bottom on D1.
With Indicator: Use your trusted setup to confirm the entry for optimal precision.
🎯 Target:
100% gain from the bottom – Targeting a significant profit based on the market's performance.
⏳ Hold Time:
2–3 weeks – Perfectly aligned with the projected D1 cycle.
💡 Note:
Combine the suggested price point with your indicator setup to ensure precise entry. Stay flexible and adjust your strategy as the market evolves.
🔥 XVGUSDT is gearing up – Don’t miss this short-to-mid-term trading opportunity! 🔥

*XVG* IS AWESOMEhello friends
This token has been modified after hitting a higher ceiling.
Now we can buy step by step with capital and risk management and move to the goals we specified.
*Trade safely with us*

XVG Looks bearish (4H)From where we entered "Start" on the chart, XVG correction seems to have started. This correction seems to be a diametric. By maintaining the red area, it can move towards the green box.
The low risk range for sell/short positions is the red box.
Closing a daily candle above the invalidation level will violate this analysis.
For risk management, please don't forget stop loss and capital management
Comment if you have any questions
Thank You

XVGUSDT 1WXVG ~ 1W
#XVG So far it continues to maintain its bullish structure. Buy when retesting this Golden Ratio,. Minimum target 20%+

XVG / USDT : Preparing for a breakout Above trendline resistanceXVG/USDT: Preparing for a Breakout Above Trendline Resistance
XVG/USDT is gearing up for a potential breakout 📈 as it approaches a key trendline resistance zone 📊. The price has been consolidating tightly, creating a promising setup for an explosive move 💥. If the breakout materializes, we could witness a strong bullish trend emerge 🚀. Keep this pair on your radar 👀 and wait for confirmation before taking action.
Key Insights:
1. Trendline Resistance: XVG/USDT is nearing a long-standing trendline that has acted as a significant barrier. A break above this level could signal the start of a robust upward trend.
2. Volume Surge: Monitor trading volume closely; a notable increase during the breakout will confirm buyer strength 🔥.
3. Bullish Indicators: Momentum indicators like RSI and MACD are showing positive trends ⚡, supporting the case for a bullish breakout.
Steps to Confirm the Breakout:
Wait for a clear 4H or daily candle closing above the trendline 📍.
Look for a spike in trading volume during the breakout to validate strong buying pressure 📊.
A retest of the broken resistance as a new support zone will enhance the credibility of the move ✅.
Stay cautious of fake breakouts marked by sudden reversals or wicks above the trendline ⚠️.
Risk Management Strategies:
Use stop-loss orders to protect your capital effectively 🔒.
Ensure your position sizing aligns with your broader trading strategy 🎯.
This analysis is for educational purposes only and is not financial advice. Always conduct your own research (DYOR) 🔍 before making investment decisions.

xvg We start a new year with xvg This price channel pattern is still rising around these points
Keep calm in the buying positions and take profits with each step or invest in the medium term as the market is still rising

XVG 0.45$ soon! Don't tell me you not seeing this massive hidden bullish divergence on the daily time frame.
This divergence indicates a huge upward potential.
I believe XVG will be around 10$ at the top of this cycle.

XVG up!MA10 just crossed over MA21 and it kinda formed a bullish pennant. I have two targets atm, we'll see how the market goes.
📈📈📈


Xvg longOne of th OGs .
Here since 2015.
I think it is the time for her to show up and reach the all time highs .
Starting from this year ..
Might dip a little bit ,but overall this is bullish.
Long and strong .

XVGUSDT (Verge) Updated till 29-12-24XVGUSDT (Verge) Daily timeframe range. PA stuck between 0.017649-0.010266 for a while now. staying above 0.010266 will eventually push it toward to 0.017649. alltho it needs some more volume here to break 0.017649 clean.

XVG/USDT Chart Analysis #Verge ( SGX:XVG ) is trading at $0.012428, showing bullish potential after bouncing off strong support near $0.011854 (0.786 Fibonacci retracement). The price is forming a descending wedge pattern, indicating a possible breakout toward $0.019481 as the first target, followed by $0.024136 and $0.028229. Entry near $0.011854 with a stop loss below $0.010000 offers a favorable risk/reward setup. If support holds, Verge is well-positioned for a strong upward move.

XVG Is Bullish And On FireI privately traded this token, SGX:XVG yesterday. Where I analyzed and draw the pattern seen on this chart below, I shared the idea in the chatroom, before it shoot up.
Sorry I did not publish it then. I am seeing another setup building up on the Daily TF , so i want to share it publicly before it began.
Verge (XVG) is a decentralized, open-source cryptocurrency that prioritizes user privacy and anonymity . Originally launched as DogeCoinDark in 2014, it was rebranded as Verge in 2016. Verge uses the TOR network to obfuscate IP addresses, ensuring that transactions are private and secure.
I have spotted another bull flag developing on the daily level, I am heavy on SGX:XVG , it is one of the most cheapest privacy coin at this time. HODLers are still early to the game .The bull flag is clearly identified on that chart, with recent support and resistance levels.
There's a wall of support around 0.012794 - 0.011997 , this offers a likely good entry price. A major Support level is seen at 0.009683 . The micro levels are already overbought, may be gearing up for pull-back soon.
👍 Like if you agree. Comment if you disagree.

$XVG Prediction! Daily chart..Hello Traders,
As of Late market showing sending mixed signals while BTC correcting. Altcoin market wide correction took place last couple of weeks and most coins deeply corrected! One can't be sure weather correction is fully completed or not but last few days some altcoins holding their grounds well while BTC correcting including XVG. On a daily chart $0.0018-$0.002 seems grenade proof support. Most importantly daily candle doesn't seem like want to close below $0.002 level.
When I placed Fib retracement lines , it is clear that price action following the main retracement points as it is clearly marked on the chart.
Moving Averages clearly bullish on daily timeframe while oscillators remain neutral. My favorite Chipher_B_divergence indicator flashing low green Dot! RSI indicator in the neutral zone which could mean that lots of room to go either direction.
We also have Symmetrical Triangle .As the price moves toward the apex, it will inevitably breach the upper trendline for a breakout and uptrend on rising. Traders should watch for a volume spike and at least two closes beyond the trendline to confirm the break is valid and not a head fake.
I am personally very bullish on this chart and will update this chart as we move along. We do have a different outcomes that could take a place next few months. I applied 7 different line arrows to simulate the possible price actions. Timeline is arbitrary. It could take shorter or longer time to achieve!

XVG Big Triangle PatternXVG big triangle pattern in D1 chart
This is insane when other people talking about AI, this coin just like sleeping giant
Lastest massive correction on bitcoin just move XVG to support trendline when other coin breakout trendline
