XVG up!MA10 just crossed over MA21 and it kinda formed a bullish pennant. I have two targets atm, we'll see how the market goes.
📈📈📈
XVGUSDT trade ideas


Xvg longOne of th OGs .
Here since 2015.
I think it is the time for her to show up and reach the all time highs .
Starting from this year ..
Might dip a little bit ,but overall this is bullish.
Long and strong .

XVGUSDT (Verge) Updated till 29-12-24XVGUSDT (Verge) Daily timeframe range. PA stuck between 0.017649-0.010266 for a while now. staying above 0.010266 will eventually push it toward to 0.017649. alltho it needs some more volume here to break 0.017649 clean.

XVG/USDT Chart Analysis #Verge ( SGX:XVG ) is trading at $0.012428, showing bullish potential after bouncing off strong support near $0.011854 (0.786 Fibonacci retracement). The price is forming a descending wedge pattern, indicating a possible breakout toward $0.019481 as the first target, followed by $0.024136 and $0.028229. Entry near $0.011854 with a stop loss below $0.010000 offers a favorable risk/reward setup. If support holds, Verge is well-positioned for a strong upward move.

XVG Is Bullish And On FireI privately traded this token, SGX:XVG yesterday. Where I analyzed and draw the pattern seen on this chart below, I shared the idea in the chatroom, before it shoot up.
Sorry I did not publish it then. I am seeing another setup building up on the Daily TF , so i want to share it publicly before it began.
Verge (XVG) is a decentralized, open-source cryptocurrency that prioritizes user privacy and anonymity . Originally launched as DogeCoinDark in 2014, it was rebranded as Verge in 2016. Verge uses the TOR network to obfuscate IP addresses, ensuring that transactions are private and secure.
I have spotted another bull flag developing on the daily level, I am heavy on SGX:XVG , it is one of the most cheapest privacy coin at this time. HODLers are still early to the game .The bull flag is clearly identified on that chart, with recent support and resistance levels.
There's a wall of support around 0.012794 - 0.011997 , this offers a likely good entry price. A major Support level is seen at 0.009683 . The micro levels are already overbought, may be gearing up for pull-back soon.
👍 Like if you agree. Comment if you disagree.

$XVG Prediction! Daily chart..Hello Traders,
As of Late market showing sending mixed signals while BTC correcting. Altcoin market wide correction took place last couple of weeks and most coins deeply corrected! One can't be sure weather correction is fully completed or not but last few days some altcoins holding their grounds well while BTC correcting including XVG. On a daily chart $0.0018-$0.002 seems grenade proof support. Most importantly daily candle doesn't seem like want to close below $0.002 level.
When I placed Fib retracement lines , it is clear that price action following the main retracement points as it is clearly marked on the chart.
Moving Averages clearly bullish on daily timeframe while oscillators remain neutral. My favorite Chipher_B_divergence indicator flashing low green Dot! RSI indicator in the neutral zone which could mean that lots of room to go either direction.
We also have Symmetrical Triangle .As the price moves toward the apex, it will inevitably breach the upper trendline for a breakout and uptrend on rising. Traders should watch for a volume spike and at least two closes beyond the trendline to confirm the break is valid and not a head fake.
I am personally very bullish on this chart and will update this chart as we move along. We do have a different outcomes that could take a place next few months. I applied 7 different line arrows to simulate the possible price actions. Timeline is arbitrary. It could take shorter or longer time to achieve!

XVG Big Triangle PatternXVG big triangle pattern in D1 chart
This is insane when other people talking about AI, this coin just like sleeping giant
Lastest massive correction on bitcoin just move XVG to support trendline when other coin breakout trendline

THE STABLE TRADER - EMA Cross Dynamic High-Low FiltersThis indicator is designed for traders seeking refined entry and exit signals based on precise EMA crossovers. By leveraging dynamically calculated average high and low thresholds over a customizable lookback period, this tool enhances decision-making by filtering out noise and providing clear, actionable signals.
Key Features:
Dynamic Thresholds: Calculates average high and low values over a specified number of candles, ensuring adaptability to market conditions.
Refined Signal Logic: Generates buy signals when the EMA crosses above the average low, and sell signals when the EMA crosses above the average high or drops below the average low. This ensures logical progression and avoids redundant signals.
Customizable Settings:
Lookback period for high-low averages.
EMA period for precise crossover calculation.
Signal appearance: Choose between arrows or labels for better chart visibility.
Adjustable signal colors to match your preferences.
Alerts: Set alerts for buy and sell signals, enabling you to stay updated in real-time.
How It Works:
The indicator calculates average high and low prices over a user-defined number of candles.
An EMA is plotted based on the closing price and your selected period.
Buy and sell signals are triggered based on how the EMA interacts with the dynamic high and low levels:
Buy: EMA crosses above the average low and no active buy signal exists.
Sell: EMA crosses above the average high or below the average low after a buy signal.
Visual Guidance:
Plots the average high (red), average low (green), and the EMA line (blue) for clear visualization of key levels and price interactions.
Signal markers are plotted directly on the chart for quick identification of potential trades.
Use this indicator to enhance your trading strategy, reduce noise, and focus on high-probability setups.

Prepare to BUY Spot XVGUSDT on the D1 Cycle
🌟 Get Ready for the Next Move with XVGUSDT! 🌟
🌍 Market Overview:
XVGUSDT is showing bullish potential on the D1 timeframe, offering a promising setup for short-term gains.
📊 Trade Plan:
📌 Entry: $0.011 - $0.013 – Accumulate within this range for optimal positioning.
🎯 Target: $0.022 or x2 – Aim for a potential 2x gain with a favorable risk-to-reward ratio.
⏳ Hold Time: Up to 1 week – Designed for short-term traders seeking quick returns.
🔍 Strategy Insights:
My custom indicator RainBow MG3 confirms strong potential for a breakout.
The current market trend aligns with a high-probability D1 cycle setup.
🚀 Next Steps:
💬 Contact me if you need personalized guidance or more strategy insights!
💡 Note: This is not financial advice. Always DYOR before trading.
🔥 XVGUSDT is primed for action – Don’t miss the opportunity! 🔥

XvgusdtVerge can easily touch /016 again. Based on price action, it is at support and according to Ichimoku, it has the potential to turn higher.

XVG {Read the caption}hello friends
After a heavy fall, this coin was able to enter an ascending channel and hit a higher ceiling and floor, which we showed you in the picture.
Now, after hitting the roof for the third time, we have seen a correction.
Now the best option is to buy a staircase, one step here and in case of deeper modification, the next steps that we specified for you...
Its target is its initial price, which means we expect it to reach its supply price, and if it breaks and hits a new ceiling, we will give you a new update.
If you like, support us with like and comment.

XVG/USDTKey Level Zone : 0.014580-0.015480
HMT v1.0 detected. The setup looks promising, supported by a previous upward/downward trend with increasing volume and momentum, presenting an excellent reward-to-risk opportunity.
HMT (High Momentum Trending):
HMT is based on trend, momentum, volume, and market structure across multiple timeframes. It highlights setups with strong potential for upward movement and higher rewards.
Whenever I spot a signal for my own trading, I’ll share it. Please note that conducting a comprehensive analysis on a single timeframe chart can be quite challenging and sometimes confusing. I appreciate your understanding of the effort involved.
If you find this signal/analysis meaningful, kindly like and share it.
Thank you for your support~
Sharing this with love!


$XVGUSDT - A reversal SpotBINANCE:XVGUSDT - There seems to be a reversal coming up in this zone. Upside before hitting resistance is approx 30-40%, not a bad profit margin until there. All the best

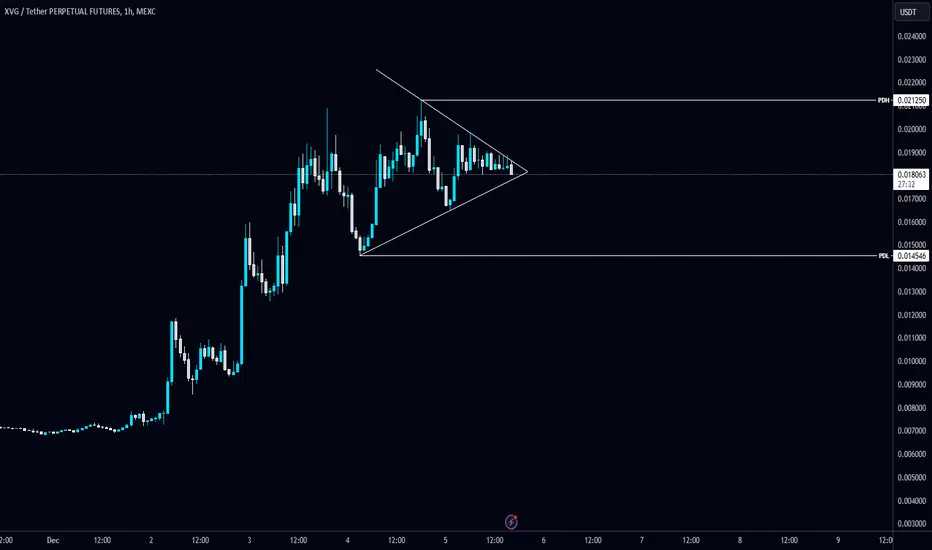
#XVG/USDT is forming the Peanut Pattern in 4-Hour TF!#XVG/USDT is forming the Peanut Pattern in 4-Hour TF!
Wait for a BO and successful retest to long $XVG. The local support level is PDL $0.014546 and the resistance level is PDH $0.02125.
XVG NEW RUN ON WAY..Is verge(XVG) starting for a new cycle..
XVG looks to have new data that can get confirmed into a new break.
It is interesting to watch out for XVG in the coming time for a new run.

#XVGUSDT LONGAh, SGX:XVG , the mysterious Verge, a coin that's been around longer than the last Earth Mark II project! Here's what i think...
Short Term (The Next Few Weeks - What we in the biz call "A Galactic Minute"):
- Current Trend: Looks like SGX:XVG has been showing some signs of life, much like a petunias thinking about the nature of existence right before it hits the ground. If it can maintain above the recent support levels, we might see a bit of a bounce back.
- Potential Move: There's a shimmer of hope, or perhaps just my screen reflecting light. If SGX:XVG can break through the resistance at around $0.021, we could see a move towards $0.025ish. Not a meteoric rise, but enough to make you feel like you've found the answer to life, the universe, and everything (which, by the way, is 42, but let's keep that between us).
Wait for that neck line break! #XVG at the 15min. Target $.0257. Why is this so significant? Because that will break our 6 year accumulation triangle!! $.03 is my target to start the breaking point!! I expect major news announcement or positive news to hit the
I opened LONG from 0.0174. I will fix profit at 0.021 and will wait breaking resistance at 0.021

Verge (XVG)Verge is a project based on the Bitcoin source code that is focused on privacy and stealth transactions. Anyway, XVG has been in a downtrend almost since the beginning. As can be seen, when XVG broke the second downtrend line, a strong upward wave started. Now, Verge is oscillating in a sideways channel. Let's see when XVG breaks this area upward.


Xvg/UsdtBINANCE:XVGUSDT
🚨 **XVG Price Analysis** 🚨
- **Current price**: **$0.0011500** 💲
- This price level is currently sitting on the **support zone** 📉. Support is a price level where the asset tends to find buying interest, making it less likely to drop further.
- If **XVG** holds above this level, it could potentially **bounce back up** towards higher levels. 🔄
- **Next resistance levels**:
- If the price holds at **$0.0011500**, the **next resistance** (where selling pressure might occur) is at **$0.01300** and **$0.01500** 🚀.
- Resistance is a price point where an asset struggles to rise above, often facing downward pressure. A break above this would signal potential **bullish momentum** 📈.
- **Price breaks support**:
- If the price breaks below **$0.0011500**, it could fall towards the next **support zones** at **$0.009500** or **$0.00700** ⚠️.
- When the price drops below a support level, it indicates the possibility of further declines. This is a key area to watch for potential reversals.
---
**Important Reminder**:
🔴 **This is not financial advice**! Always do your own research and consider your own risk tolerance before making any trades. 💡

#XVGUSDT (Watchlist) 9-2024XVG is hovering near its resistance level at $0.0049. A breakout above this could lead to potential targets at $0.008 and $0.012. Our last trade in XVG delivered around +250% / 350% profits, so it's worth keeping a close watch. The main support to monitor is $0.0029.
When we recommend adding a coin to your watchlist, it's typically due to forming a pattern, nearing a historical bottom, or approaching a strong support level. It may also show increased trading volume, reversal candles, or be in an accumulation stage. While we haven't observed a bullish reaction yet, we advise monitoring it until an optimal entry point emerges.
PS:
We avoid trading coins associated with gambling, prostitution, human trafficking, etc.
Note:
This is not financial advice but an analysis of coin movements. Conduct your own research and practice risk management before making any investment decisions. Remember, the cryptocurrency market carries significant volatility and risks.
Best wishes to all,
we ask Allah reconcile and repay. 🙏

