YFIBTC trade ideas

YFI BTC - Bullish Arrive!Hello !
Long
Reasons:
growing in ascending channel
Good luck !
Please consider to put a like to my idea for supporting me. My idea is not the financial advice!

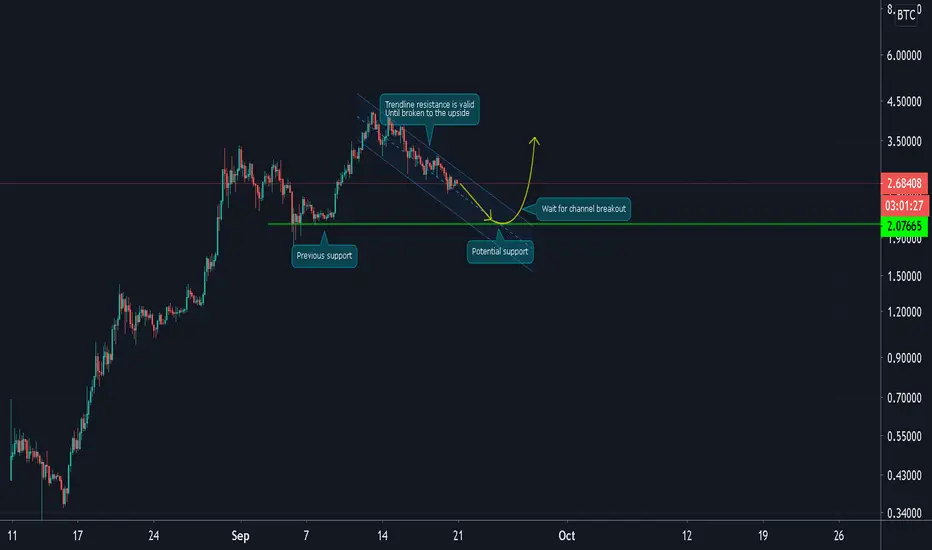
Update 1 The Chart is in a descending channel currently due to the high purchase. The Fibonacci retracement is measure from the previous high to low. The break of the channel would be devastating in a down trend but if we break the channel on top then expect the long term bullish chart as expected. The stop loss should be set on the channel break down point. Thank you.

YFI/BTC (Trading Inside a Descending Channel)BINANCE: YFIBTC
-YFI is trading inside a descending channel with a series of LH and LL
-If the price keeps respecting this channel, it may retest the key support at 2 BTC
-I recommend waiting for the price reaches key areas or until the channel is broken
-A drop to 2 BTC is more than -20% so let's wait and see how the market will react below
``````````````````````````````````````````````
Trading Involves High Risk
Not Financial Advice
Please Exercise Risk Management
``````````````````````````````````````````````
If You Like My Daily Published Ideas
A little Help By Supporting My Channel
Through Leaving A Thumbs Up, Comment & Follow
Happy Trading! --> Thank You! :)
``````````````````````````````````````````````
YFI/BTC Bullish Long term on 4hrThe Rsi shown in the charts marks in oversold territory. Previous instances of the same situation have been marked. The price if following the same bullish pattern like the last two ATH breaks could reach 4.925 Target as indicated by the green line taken from the previous build-up. Stop-loss should be set at 2.5. TVL on the defi pulse has reached backed to 942.58 M at the time of posting. Market Cap is at 887 M.

YFIBTC #YFIBTC Up Or Down ? Welcome Traders >> We Have Here Opportunity And Direction For $YFIBTC
! Tools Details On Chart !
♦️ We Have Down Trend Area >> Waiting For Break Out To Buy
♦️ We Have Up Trend » Waiting For Break Out To Go To 61.8 Fibonacci Area
♦️ We Have 61.8 Fibonacci Area » Waiting For Break Out To Sell
📚 Vision 📚
🔷 We Have 2 Ways 🔷
1- Buy » When The Price Break Out Down Trend Area And Test It .
2- Sell » When The Price Break Out Up Trend + 61.8 Fibonacci Area .
♣️ Vision ♣️
Buy Now For Tp On Chart >> Sl Also On Chart
!! Please Take care Trading Is Very Risk Don,t Risk On Any Position

Am I seeing a Bullish "Hidden Divergence"?Bullish "Hidden Divergence usually occurs when the price makes a lower low and the RSI indicator makes a higher low. Lets see how this plays out.


YFIBTC crush or next pump in next weekYFI is at limits of parabolic grow.
Most possibly it will stay one more week at same level and then will crush


YFIBTC - Long - Potential 17.07%YFIBTC - Long - Potential 17.07%
Enter- 3.60212
TP1- 3.90588
TP2- 4.04664
TP3- 4.20963
SL- 3.16501
Happy Trading! Like & Follow if you Agree!


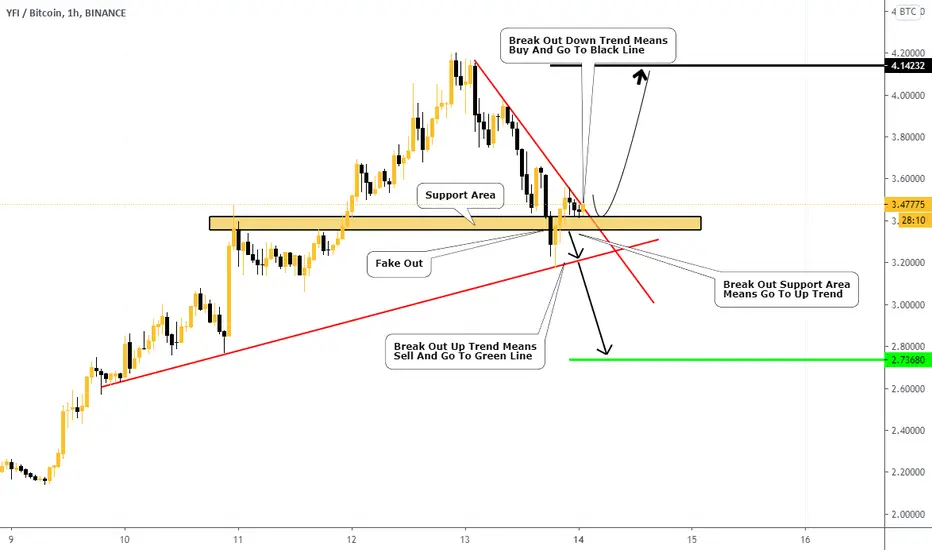
YFIBTC #YFIBTC Up Or Down ? Welcome Traders >> We Have Here Opportunity And Direction For $YFIBTC
♦️ We Have Down Trend Area >> Break Out It Means Buy And Go To Black Line
♦️ We Have Support Area >> Break Out It Means Go To Up Trend To Test It
♦️ We Have Up Trend Area >> Break Out It Means Sell And Go To Green Line
♣️ Vision ♣️
Waiting For Break Out Any Trend To Sell Or Buy
!! Please Take care Trading Is Very Risk Don,t Risk On Any Position !!
YFI, WedgeYFI, broke out of its downtrend, forming an ascending wedge, this could either break up, retest and go on, which would allow it to reset the RSI some, or it can break down and retake trend. Regardless, this will need to cool off some before continuing on.
Keep an eye on the volume.


YFIBTCYeaenfinance can start a new upward wave. This wave can be wave E of a diametric pattern. Please don't forget SL.

YFIBTC - 4H Following Pitch Fan
YFI is in a very bullish hype momentum.
Just broke the ATH.
Is respecting the Pitch Fan pattern.
Just got listed on Coinbase PRO.
Fomo is coming in the next days.
***Not a financial adviser, only playing around and learning.


YFI/BTC (Bearish Double Top - Confirmed)BINANCE: YFIBTC
-The bearish double top pattern is confirmed after the break of the neckline
-The downside target is around 1.4BTC or mover than a -30% decline
-Be careful as the market is not yet ready to settle down
-If you are interested adding positions to your midterm trade Altcoins
-Find the major support area and the confluence of previous support & resistance
-Because the chances of these zones will hold are high
**If you like my daily Published Ideas, Please don't forget to leave a thumbs up and comment below. Thank you!**
