Yfii financeYFII/USDT is showing a nice bull flag . Price action shows bullishness.
Good risk/reward ratio.
Price needs to close higher than the 4500USD (last weeks candle high)
RSI resistance seems to be broken. (need a candle close for confirmation)
Always us stop losses or you will get your ass burned!
N.1 mistake traders do is not to use them
-Jebu
YFIIUSDT trade ideas


BULLISH YFii/USDT - Easy 4X Long (Don't Sleep On This Trade)It's late, I simply don't have the energy to type up a long explanation as to why you should long this pair.
I will say this, I've seen patterns like this enough to be confident that we have an 80%+ chance this trade plays out.
My expected time frame should be between 1 - 2 weeks at longest.
We may see some volatility along the way.
Overall. Highly recommend you enter NOW.
Entry: $3305
Take Profit: $5195
Stop Loss: $2735
Reward/Risk = 4/1


YfiiusdtGo to buy target now
Sell target 1:1btc
Sel target 2:2btc
Sell target 3:3btc
Sell target 4:4btc
sell target 5 :up 5btc
target 🎯 time 60day~90 day

Yfiiusdt yfiusdt yfiibtc yfibtcBest price for buy and hold
Enter zone 1000$~6000$
Sell zone 10,000$~ 16,000$
total suply number coin 38500/40,000
like 💎 have low number world have 40,000 people to wanna buy 1 crypto and dont wanna sell if yfii or yfi go this people hands price 1 coin go up Than 100,000$

yfiiusdthave big bang in altcoins yfi and yfii seller in this price is big loser reall price is 7000~14000 in yfii total is 400,000,000,000$ total 2 148,000,000,000$ yfi markert cap 400,000,000$ YFII IS 65,000,000$ TOTAL NUMBER YFI IS 30,000/30,000 YFII 40,000/40,000 WHY DFI MONEY? best network for sent and recive coin polic dont can find coin sender or riciver in yfii or yfi network wanna have 0.15 btc than 21,000,000 or 1yfii than 40,000 new technology ,yfii coin like dimond and gold ,this coin dont have bilyon number like dgb or doge or trx ... please study and work with brain fall reasen is website margin lequid ,dont sell big bang is near

YFII Again Rejected By Resistance | Was It A Bull Trap ???Hey friends, hope you are well and welcome to the new update on YFII token.
Previously the price action broke down the support of the pennant on daily chart. But in a very next candlestick we can observe a powerful buying volume therefore while re-testing the previous support as resistance the price action of DFI.Money re-entered in pennant. Finally the price action of YFII token also broke out the resistance of this pennant. But the priceline is still below the exponential moving averages with the time period of 10 and 21. For confirmation of the change in trend from down to upside we need crossing above these EMAs 10 and 21 and a bull cross between these EMAs as well.
In my previous post we have seen that on small time period 4-hour chart the priceline of YFII token broke down all simple moving averages with the time period of 25, 50, 100 and 200 and there was a big distance between all these moving averages and the candlesticks. At the moment the price action is again breaking out the 25 SMA and soon it can also breakout the other simple moving averages as well. For complete trend change from down to up we need the closing above all these SMAs.
On daily chart the price line is also completing final leg of bullish Butterfly. But the priceline cannot complete this leg because if we see the trader’s interest as per volume profile of complete price action of this butterfly. Then it can be clearly observe that trader’s has no interest to trade below $800 and this can be last support as well. The priceline has also a very strong resistance at $2600. In my previous article I also mentioned this resistance and now the priceline is rejected by this resistance. So the previous short rally to the upside worked as a bull trap for many traders. However the priceline is moving with the pivot 1st support and point of control of the volume profile.
Conclusion:
The priceline is moving with pivot 1st support and point of control of volume profile therefore is the priceline would be moving here sideways and in the meanwhile if it will cross up the EMA 10 and 21 on daily chart and simple moving average 200 on 4 hour chart. Then it can be possible that the trend will be completely changed from down to up side. And if the volume profile will start showing interest of traders below the $800 level in coming days then more drop can be possible as well.

yfiiusdtbuy and hold we have technical and fundamental reasen number total this coin is 40000 this market cap redy to fire like big brother yfi .dfi money have new sistem very beter than bitcoin or other altcoin now have best price dfi sistem in yfii is best of world polic dont can search adress and sent dont have comison you wanna have for now 6/40000 or bitcoin 1/21000000 i say for all best technical we have 700% pump

Short Term Bullish on DFI.Money (YFII)HUOBI:YFIIUSDT
Not a financial adviser but i do believe this ponzi token will rise for the last before wick to 800 or something.
Today Target $1852.
Tommorow Target $1732.
First Support 1506.
Second Support 1422.
PS: im nt holding $YFI token atm!

Warning !!! YFII Has Broken Down All SupportsHey friends hope you are well and welcome the new update on DFI.Money token.
On small time period 4 hour chart the priceline of YFII token was moving in a descending triangle and finally broke down the support.
On 4 hour chart the priceline also has broken down all simple moving averages with the time period of 25, 50, 100 and 200. Therefore once the priceline will move up it will need to breakout all these resistance levels of SMAs.
On the daily chart the priceline of DFI.Money has broken down the support of pennant.
On daily chart the priceline of YFII token is likely to continue its movement within a down channel. At this time the priceline is likely to test the support of this channel again. The moon phases indicator is showing a new dark moon is appeared below the support of down channel that is another bearish signal. The lowest support on daily chart at $800 can be seen as well. Volume indicator showing powerful sell volume. Volume oscillator is showing powerfull sell oscillation with the value 35.
Conclusion:
As in my previous article I predicted that if the priceline will break down the support of Gartley then it can move more down to form Butterfly pattern.
In order to complete final leg of Butterfly the price action of YFII token needs to retraced between 1.27 to 1.618 Fibonacci levels. But these levels are in negative territory therefore it is not possible for priceline to move down than $0 level. The volume profile of complete price action is showing traders interest upto $716. Therefore We can expect that in most bearish scenario the priceline may hit the spike upto this level and then it can reverse bullish. The point of control of volume profile is at $1250 and the pivot point of daily chart is at $5700. So in case of bullish reversal the priceline can move between these levels.


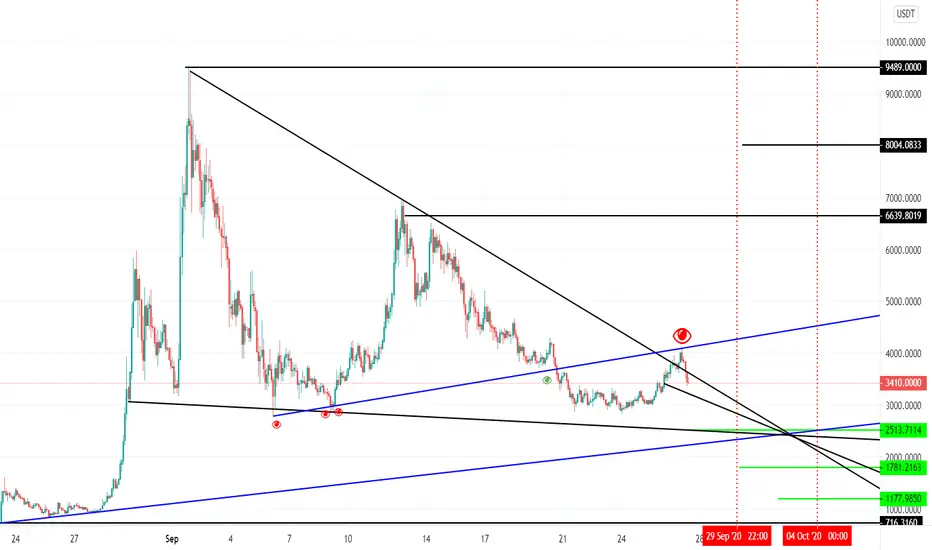
YFIIUSDT seems a bit risky at this point in the short termA trader asked me about this coin YFIIUSDT which seems a bit risky here IMO.
I would wait at least for the monthly close before to take any decision.
This coin risk to plunge down to one of those green support, therefore we prefer to eventually lose an opportunity than losing money.
We stay aside for the moment
YFIIUSDT formed bullish Gartley | Upto 205% move expected
The priceline of YFIIUSDT has formed bullish Gartley on long term weekly chart, the targets as per Fibonacci sequence of Gartley are:
Potential reversal or buying zone: $4067 to $2627 (this should be used as stop loss as well)
Fibonacci projection or sell zone: $5248 to $8020
Regards,
Atif Akbar (moon333)


YFII/USDT Price currently at 0.618 fibonacci retracement.
If the support doesn't hold here I expect a deeper drop in price to the 6h demand zone + 0.786 fib retracement. If we don't see a bounce from here, the price will drop even further and we will make a new lower low.

Target 13400My very first graph, sorry if it has mistakes.
But i think 2nd elliott is coming and target will be 13400 if it starts here.
Please comment freely, whether this analysis could be true or not.

YFIIUSDT This could be the beginning of a new bull runThe down channel has been broken to the upside on a strong support area. We see on the chart how price gave us a double bottom on a support area.

