YFI long and strongI think this is the best chance to enter a long position .
Yfi looks really good , retest has been met , all it needs to do is to pick up volume and there we go , to the moon.
YFIUSDT_824167 trade ideas

YFI/USDT Ready to Capture Above Liquidity? 👀 Positive Outlook💎Paradisers, let's examine the latest market movements for #YFIUSDT, which have taken a fascinating turn.
💎Currently, #YearnFinance is approaching the resistance within a descending triangle. A breakout above this level will indicate a bullish trend reversal, leading to the capture of the significant liquidity present above.
💎However, if #YFI fails to break through and faces rejection at the resistance, it might signal a downward shift, potentially leading the price back to the weekly OB area for renewed bullish momentum.
💎The weekly OB area is a critical support zone for #YFI. If the price holds at this level, it could present an excellent buying opportunity with a possible bounce upward. If #YFI breaks below this support, it may find a rebound from the high-demand area below.
💎Yet, if #YFI breaks through this demand area, it could signal a deeper bearish trend. Stay vigilant and adaptable as we track the evolving dynamics in the #YFI market.

YFI: Igniting the Cryptoverse - Prepare for a Galactic Journey YFI's potential is sky-high! Recall when it surged from 0.10 BTC to 4 BTC in no time? That's just a taste of what's to come. Now's the prime moment to seize every opportunity for the next five years. The future holds endless possibilities, and YFI stands tall as a leading yield aggregator. Buckle up for an exhilarating ride to unprecedented heights!

Let's explore the mathematical possibilities -YFI- $120.000.000Imagine this: YFI blasting off to an unparalleled all-time high, launching from a mere 95K and skyrocketing by an astounding 1267%, reminiscent of its previous surge, ultimately reaching an astonishing total value of $120,000,000.
At present, it may seem entirely ludicrous, but who's to say it won't become reality one day? Predictions remain uncertain, yet the math often unveils unexpected outcomes.
Reflecting on Bitcoin's initial five years, the performance of YFI we've witnessed cannot be ignored. I'm certainly stacking up as much as I can—if the math proves right, this 8k YFI could be a golden opportunity!
"May your code be flawless, your projects revolutionary, and your gains astronomical! 🙌🔥 #CryptoGod"

Chill out with a deal on bear meat!It appears that the bear meat discount season has kicked off, and the market seems to be thriving. Despite a few minor resistances, YFI appears quite bullish. I've set the minimum target at $49,000 and the maximum for 2024 at $95,000. If Bitcoin reaches a new all-time high, we might anticipate some significant upward trends in the DeFi space though.

YFI when mOOn ?Send it .
No words , a miracle , if u missed 10k btc , here is ur chance ,It will bolster up.
Just wait.
10x leverage long will give u a 83x roi at previous ATHs , whilst the fib extension at -127 it will provide us a 136x ROI.
Not a financial advice.

$Yfi pretty straight forward
invalid back below yellow
activate beast mode like it does once in a while
flip blue to get its groove on

Alikze → YFI |Descending channel failureIn times H4 and H8, after the breakdown of the descending channel in the form of a pullback to the range of $7500 and confirmation of the continuation of the trend, it is possible to reach the specified supply area according to the important resistance range, as well as the neck line of the range of 7500, with the support of this range, the ability to reach The first demand range is specified and then it will be up to $10,000.
🟩Sup: 7500
⛳️Tp1: 8280 - 8440
⛳️ Tp2 :8440
⛳️ Tp3 : 10000
-----------------
Please support this idea with a LIKE and COMMENT if you find it useful and Click "Follow" on our profile if you'd like these trade ideas delivered straight to your email in the future.
Thanks for your continued support.
Sincerely.❤️

YFI/USDT Long Trading Opportunity!The weekly chart has breached a significant resistance level, propelling prices upwards. This surge signals a promising long trading prospect, with a potential target range between USD 70K to 74K.
#YFI/USDT SPOT LONG ENTRY
Leverage: 3x
Entries: $10559
Take profit 1: $13985
Take profit 2: $25266
Take profit 3: $74612
Stop Loss: $6325
Thanks
The sroced.

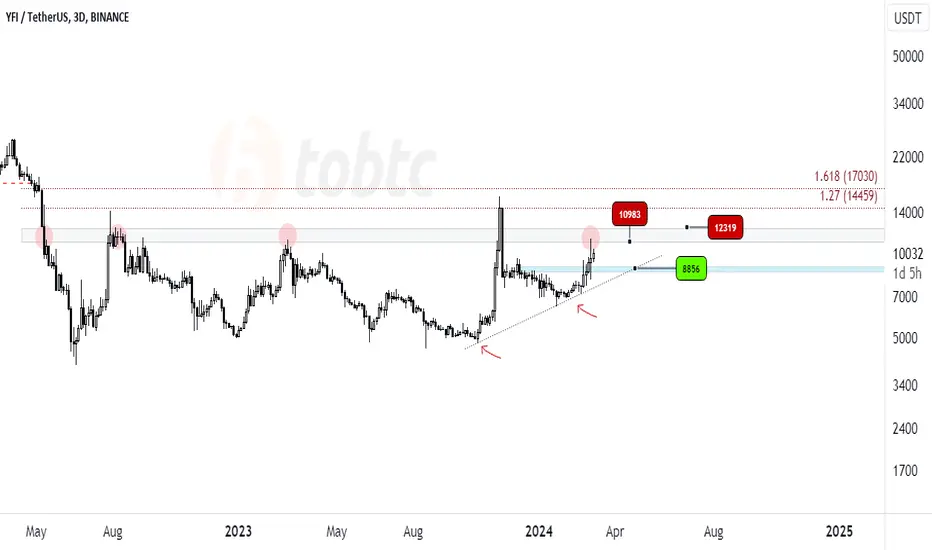
#LQR #TOBTC #YFI in 3Day Time Frame YFI got a Up Trend which is to important for next touch , for now these red Price Lable are resistance , which is important to break first
for new comer theres no place here , high risk level is green price lable
good luch
$YFI Locked and LoadedBINANCE:YFIUSDT
yfi is primed for a big move in this market.. ATH of close to 100k with a Daily and Weekly chart that have been building.
- We should run back to $11800-12k if we can break out of this $9800 level resistance
- Daily chart is tight and we’ve had some significant volatility the last few days which have shaken out the market and allowed some consolidation
- Weekly chart: currently testing the $9800 resistance with a long wick so far, with 3days left on the candle, if we can break out on the daily chart it will print a strong weekly candle
Entry: I'm long at $9540 for a swing, it has been bouncing in a channel for days
SL: if market pulls back I will watch the $9000 level
Yearn has a TVL of close to 400mil and remains a top 300 coin by market cap
I have used Yearn in the past and its a great aggregator
Tight on the 4h chart

yfiWe are in a very important area. The red box is a very hard resistance. If it is broken with strength, it can see the higher targets. Otherwise, I will wait on the lower lines.

YFI - Good time to enter for long term TradeBINANCE:YFIUSDT (1W CHART) Technical Analysis Update
YFI is currently trading at $9430 and showing overall bullish sentiment
YFI had a decent move in the recent weeks, if such trends continues then we can expect the price to breakout from the resistance line and head towards the next resistance.
Currently i'm seeing a good opportunity to enter for long term holding(preferably in spot market )
Entry level: $ 9952 (candle close above this)
Stop Loss Level: $ Below 8263
TakeProfit 1: $ 11523
TakeProfit 2: $ 14027
TakeProfit 3: $ 18407
TakeProfit 4: $ 24901
TakeProfit 5: 32500
TakeProfit 6: 3955
Max Leverage: 2x (or buy on Spot market)
Don't forget to keep stop loss.
Follow Our TradingView Account for More Technical Analysis Updates, | Like, Share and Comment Your thoughts.
Cheers
GreenCrypto

YFIUSDT IDEAUPDATE
Looking ready to break wedge.
Breakout can take on proceeding as we predict.
COIN DETAIL
yearn.finance price today is $ 8,426.90 with a 24-hour trading volume of $ 75.54M, market cap of $ 281.74M, and market dominance of 0.01%. The YFI price decreased -0.26% in the last 24 hours.

YFIUSDT 3DGolden Cross on #YFI 3-days timeframe. It is trying to break the trend line and the Ichimoku cloud. If it happens, price can be doubled easily. I'm bullish on it. Targets are:
$10768
$12083
$13398
$15271
$17656
$24544

YFIUSD 1WMake purchases gradually from here, the pump for YFI will start soon.
this is a bigger time with a pretty big target. You should be prepared for all the risks.
#Dyor & #NFA

YFIUSDTmy entry on this trade idea is taken from a point of interest BELOW an inducement (marked as xxxx).. I extended my stoploss area to cover for the whole swing as price can target the liquidity there before going as i anticipate.. same idea Ive always been using.. just a trade idea, not financial advise
SUBSTRUCTURE SO RISK IS HIGHER.. TRADE YOUR PLAN!
FWB:25K IS TARGETED (THIS MEANS THAT BASED ON HIGH FRAME STRUCTURE, PRICE CAN GET TO FWB:25K )

YFIUSDT (LONG) 4H Time Frame Analysis If price consolidate Above around $7500. we are going to long from there for recent high will be our target.
Don't jump in once price get there, your observation is required when price get there.

YFIU after the pullback will continue to go upYFIU after the pullback will continue to go up
🔵Entry Zone 8044 - 8340
🔴SL 7746
🟢TP1 9208
🟢TP2 10515
🟢TP3 12478
Risk Warning
Trading Forex, CFDs, Crypto, Futures, and Stocks involve a risk of loss. Please consider carefully if such trading is appropriate for you. Past performance is not indicative of future results.
If you liked our ideas, please support us with your likes 👍 and comments.

Yfiusdt ... Tecnicall analysis Yeren Finance is in a good support position, and it can grow well considering .. I specified the goals in the chart.

#YFI → Movement in the descending channelIn time H4, it is moving in a descending channel. If the red box does not break upwards, the demand range will be retested. If the red box is broken, it will have the ability to grow up to the green bar.
----------
Please support this idea with a LIKE and COMMENT if you find it useful and Click "Follow" on our profile if you'd like these trade ideas delivered straight to your email in the future.
Thanks for your continued support.
Sincerely.

YFI (LONG) Buy at 7,510 Take Profit at 8,165 (9%) . Support on 1HR and 4HR is broken with retest. Good correlation to bullish BTC. Folow me for more signals

✴️ YFI | Resistance Turned Support? Advanced Profit Taking TipsI understand that too much explanation is not needed because this right here is a classic, the chart is pretty clear, but let me add just one tidbit of thinking...
➖ YFIUSDT peaked mid-November 2023 while Bitcoin peaked mid-January 2024.
➖ YFIUSDT can move out of sync with Bitcoin, with the current market situation this can be good for this pair.
When Bitcoin drops, we can normally expect the ALTSUSDT pairs to follow suit but seeing this lack of synchronization between BTCUSD and YFIUSDT can increase the potential for a bullish wave here.
I mention this because we obviously have a lower support ("Main support") that can easily be tested, that is normally tested before a new higher high takes place but since a Bitcoin correction can push YearnFinance higher, this matches our view that Bitcoin can perform a sudden correction next.
Still, we ought to consider each chart individually and use the broader market only to reinforce our views for the bigger picture.
From a trading perspective, the pair is really good with a tight stop-loss.
➖ Closing below 6,500 means closed.
➖ Trading above this level keeps it strongly bullish, while strongly bullish we aim up.
➖ Mid- to long-term, any trading above 4,600 can be an easy hold in expectation of the next major bullish wave.
There is nice potential for growth.
We now know that it is easy to get a good entry with Alan Santana but, did you sell on the way up?
Did you secure profits for those hundreds of pairs that you buy and hold?
Yes or no, it doesn't really matter... You have another opportunity now and will have more opportunities in the future to practice, improve and reach your goals.
Accept your mistakes, setbacks are nothing more than training days.
Why didn't I sell in November when I was up more than 200%?
Most likely because you were expecting for it to go higher and this higher will happen but based on the long-term.
Getting out would mean losing the bigger wave if the pair continued to grow but holding/not selling meant missing out on all profits and now waiting for months.
We don't have to be 100% right... Next time you can sell a small portion on the way down as well as on the way up.
If you sell when prices are high, you can buy when prices are low.
If you buy when prices are low, you can sell when prices are high.
There are two ways to profit from a trade:
1) You can either sell on strength (while the rise is nice and strong);
2) Or you can sell on weakness (after the rise is over).
We are focusing now on profit taking because we already mastered the entry... The entry is so easy because we simply buy and hold... As soon as we clear one level, the next level shows up.
Let's continue on the next trade idea...
Your feedback is appreciated.
Your comments welcome.
Namaste.
