GBPZAR UPDATE Still on the way to R25.00 to the poundThe charts never lie!
I posted this trade alert in October 2022 with the massive Falling Wedge on the Weekly.
It broke above the R20.35 and it showed the next strong resistance at R25.00.
target will be R25.00.
I called it a long term analysis but changing it to a MEDIUM term analysis because of how quickly it's accelerated.
I guess we can only wait for the target to reach until the next trade alert is given.
Poor Sout Africa and those holding rands (Including myself).
ZARGBP trade ideas

W10-11 GBPZAR BEARISH IDEA (HARMONICS PATTERN)The price action has created a harmonic reversal pattern, and it is expected that the price will retrace from the potential reversal zone (PRZ).
Sellers will remain in control below the PRZ. Before forming the harmonic pattern, a bullish divergence was observed at the RSI indicator.
SL & TP Levels are defined.

W9.1-33 GBPZAR BEARISH IDEA(DOUBLE TOP)Potential Bearish Entry
Dow Theory In Place - Lower High and Lower Low Expected in Place
Formation of DOUBLE Top coupled with bearish divergence (Bearish reversal pattern)
SL & TP Levels are defined.

W9.1-17 GBPZAR BULLISH IDEA (HARMONICS BULLISH PATTERN)Potential Bullish Entry
Dow Theory In Place - Higher High and Higher Low Expected in Place
Formation of Harmonic Bullish reversal Pattern coupled with bullish divergence at potential reversal zone (PZR)
Entry at the new HH
SL & TP Levels are defined.

BRITISH POUND VS SOUTH AFRICAN RAND Posting because at the moment, being South African, one of my favourites technically. Given the sad current bad state of affairs with corruption within South Africa, being recently Grey listed, the current almost collapse of Energy (Electricity) with Eskom in almost collapse whereby the country is facing daily energy cuts of up to 6-8 hours a day. How will this Gartley play out? Supposedly a Bearish Garltley. Realistically, looking at a bounce at the 0.5 fib. And noticably the Trend line to the upside has not yet to be broken.

Perfect automated detection of Butterfly & DeepCrab PRZ - ShortA bearish-type Butterfly pattern occurred.
If the price rises to 22.862, a bearish-type DeepCrab pattern could occur.
Also on the daily chart, bearish-type BlackSwan pattern is occurring.
Short after seeing the rebound.
*Harmonic patterns are automatically detected using the indicators below.
- Harmonic auto-detect PRO

GBPZAR - Bearish Butterfly Pattern H4.The pair shows a beautiful Butterfly pattern forming. Its end point is the beginning of a historic weekly order block. This level hasn't been testes since August of 2020 and it is very likely that there's historically trapped volume at this level and institutional orders are likely to be sitting at this level. The last harmonic projection on this pair from my account was a super success. NB: well harmonic patterns do not always complete so entering into a but is not advised purely based on the projection of a harmonic. Failure of a pattern happens when the pattern fails to complete to D but rather gives a confirmed fail usually at Fib levels 70.7 and 113 respectively. Stay tuned for more updates

GBPZAR SHORTFinally the pair has mitigated a previous unmitigated zone. The larger trend is bearish, on the 4HR we have a CHOCH and BOS. For confirmation we have a CHOCH on the Daily timeframe. We are anticipating a bullish correction where we will place our sell orders. Our target is the 19-20 region sitting at the bottom.

GBPZAR SHORTThe XA leg of the Harmonic is a Double top in itself. The huge wicks on that leg suggests large institutional volumes trapped in that region. The CD leg just broke through the last order block and we see a confluence on the 1.272 Fib and 2.000 Fib where the CD leg completes. The H1 also gives a beautiful crab pattern competing around the same region. I would say this move may wait for the release oof Non-farm data for a violent take off in the Bearish side and if not enough volume is taken then we may see a retest and a gradual Bearish movement.

Perfect automated detection of BlackSwan & Butterfly PRZ - ShortA bearish-type big BlackSwan pattern occurred.
If the price rises to 22.300, a bearish-type Butterfly pattern could occur.
Short after seeing the rebound.
*Harmonic patterns are automatically detected using the indicators below.
- Harmonic auto-detect PRO

GBPZAR - Macro Its a beautiful thing. Need to draw fibs on a month time frame or a week at least. Most beautiful Gartley Harmonic ever. <3 It is what it is. Materialism means nothing. It's just a simple game of snakes and ladders. :) Mum :D

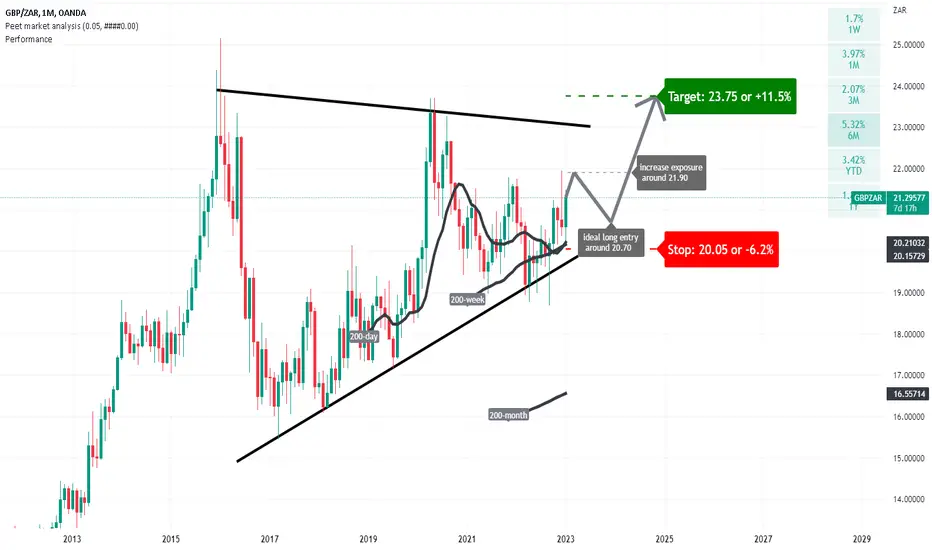
GBPZAR: some long-term rand weakness?A bullish trend (rand weakness) seems applicable.
Ideal long entry around 20.70
Increase exposure for a break above 21.90
Target is set at 23.75, which is just above the upper range of the wedge pattern.
Stop-loss at 20.05.
It is a long-term play, which might unfold over the next 6-12 months.
ZARGBP GOING UPThe lower trend linerejected the downside break of the the britain bears and supportedthe South Sfrican Bulls to rally up 0.04934 is a run worth taking

GBPZAR - Fibs and Pennant How are those for fibs? Amazing. Is it so that the pennant is an either or (up or downside)? Fibs say so no? I'm pro upside as I've posted before Gartley Harmonic. The top 0.616 as confluence a matter of fact.

Perfect automated detection of Butterfly & DeepCrab PRZ - LongA bullish-type Butterfly pattern occurred.
If the price drops to 20.226, a bullish-type DeepCrab pattern could occur.
Also on the daily chart, bullish-type BlackSwan pattern is occurring.
Long after seeing the rebound.
*Harmonic patterns are automatically detected using the indicators below.
- Harmonic auto-detect PRO

GBPZAR - Fume Indecision - Nice but Unexpected! South Africa BB!Fibs gartley dailies monthlies.. At the end of the day - have you seen South Africa? Beautiful Country!

GBPZAR - Fibs <3Frozen in time for the weekend of suspense :) Love it <3 I'd take profit and play it wisely especially after hitting resistance.. so much fun!


GBPZAR - Gartley Harmonic I dont believe in Bearish or Bullish Gartleys. Gartleys are interesting. My thought pattern. X to A pullback 0.618. 0.618 the "perfect" low before a swing up. Fib A to B near enough 0.786 and according to Gartley 0.888 high. Coincidentally has confluence with drawn TOP of ascending channel that can also be known as a "possible" and "probable" resistance. The pullback again Gartley level, would be an approximate to the decending channel (red) at 0.782. Interesting. : ) Be looking at a possible reversal at 0.382 approx 20.5 to break the pattern on the downtrend.

GBPZAR interesting take Double Tap - two trend line confirmation. Could this be a turning point for a stronger South African Rand over the next few months

GBPZARprice the ending diagonal created, the price went down for wave A and cleared the liquidity created below to show that it will reverse for wave B to the upside before going down at the QM level for the wave C

LONG GBPZAR 15 mingood evening for all as we see gbp/zar in correction zone also in resistece level i 4h timeframe just we need to wait to break this ressistence and im gonna look to buy final target to hit 21,74300

GBPZAR Massive Falling Wedge which is bad for the randMassive Falling Wedge has formed on the weekly...
We are near a breakout level, which we can only hope it doesn't breach.
If it breaks above R20.35, then the next target will be R25.00.
This most likely will only hit in around 2024 though so let's not be too worried just yet.
Long term analysis
