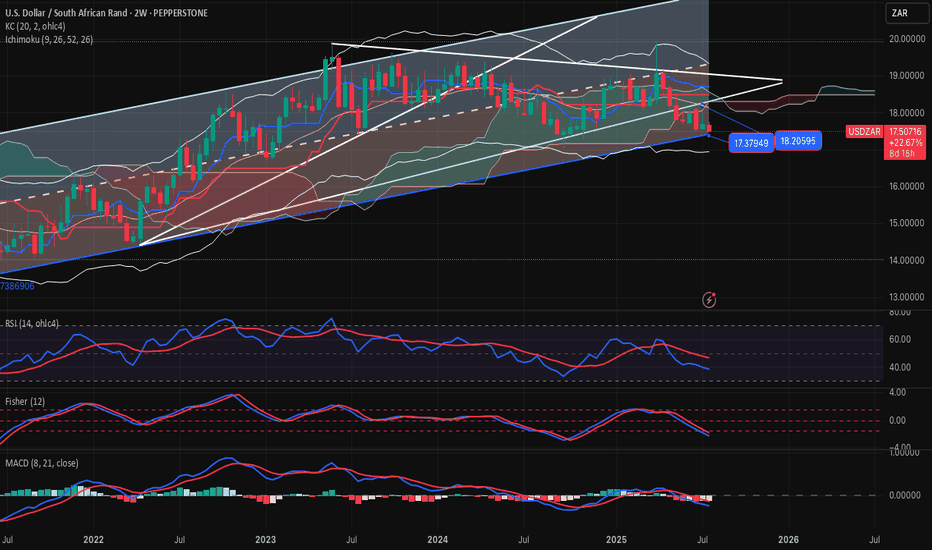
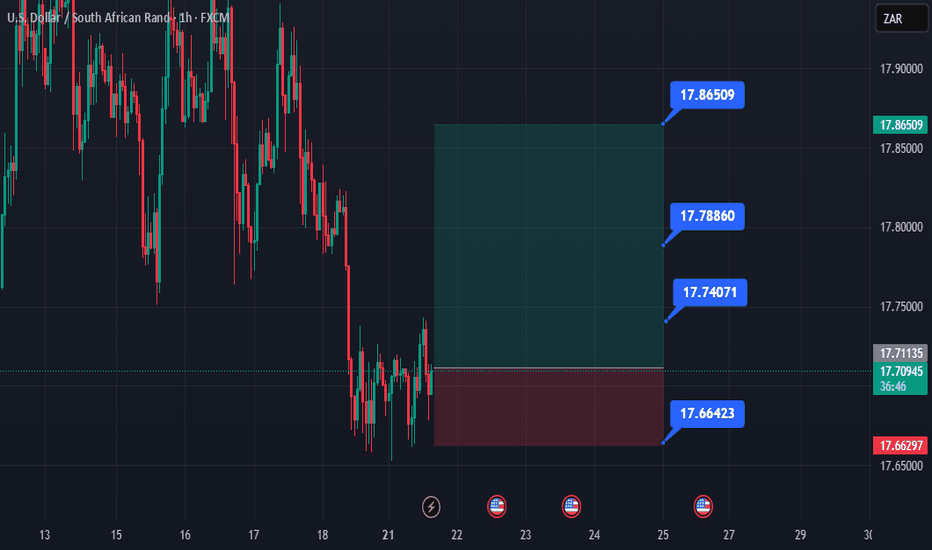
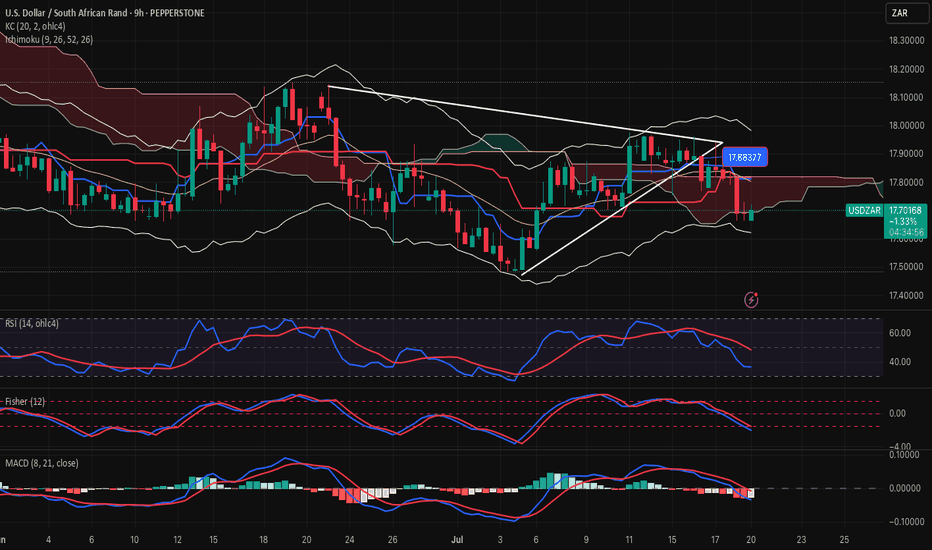
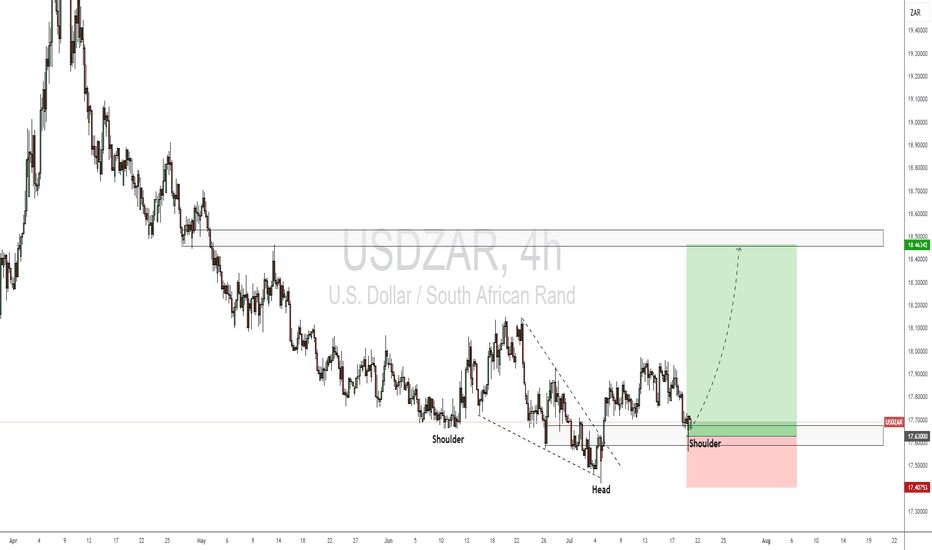
USDZAR Potentially BearishHello, USDZAR has the potential to drop on the H1 chart with one price target and a target zone towards a directional bias of 17.950. If the price goes above 18.76289, this will cancel the setup. It's a high-risk setup; monitoring will be required. Happy Trading, K.Shortby KhiweUpdated 444
USDZAR-SELL strategy 9 Hourly chartThe pair has seen lofty highs in conflict of GOLD price. It only focused on USDX, which now seems in the start of a likely correction lower. Strategy SEWLL @ 18.9750-19.1000 and take profit near 18.7875 for now. Shortby peterbokma332
USDZAR-SELL strategy 12 hourly chartThe pair is nearing short-term oversold status (likely near 18.6150-18.6300), and may recover a bit from there. Overall we are on the way towards 18.3150 is my personal view, based on the break of GANN suport moving towards or near the next support. Strategy SELL @ 18.7150 -18.7550 and take profit near 18.3875. Shortby peterbokma111
Potential bearish drop?USD/ZAR is rising towards the pivot which acts as a pullback resistance and could drop to the 1st support which is a pullback support. Pivot: 18.7436 1st Support: 18.4603 1st Resistance: 18.8586 Risk Warning: Trading Forex and CFDs carries a high level of risk to your capital and you should only trade with money you can afford to lose. Trading Forex and CFDs may not be suitable for all investors, so please ensure that you fully understand the risks involved and seek independent advice if necessary. Disclaimer: The above opinions given constitute general market commentary, and do not constitute the opinion or advice of IC Markets or any form of personal or investment advice. Any opinions, news, research, analyses, prices, other information, or links to third-party sites contained on this website are provided on an "as-is" basis, are intended only to be informative, is not an advice nor a recommendation, nor research, or a record of our trading prices, or an offer of, or solicitation for a transaction in any financial instrument and thus should not be treated as such. The information provided does not involve any specific investment objectives, financial situation and needs of any specific person who may receive it. Please be aware, that past performance is not a reliable indicator of future performance and/or results. Past Performance or Forward-looking scenarios based upon the reasonable beliefs of the third-party provider are not a guarantee of future performance. Actual results may differ materially from those anticipated in forward-looking or past performance statements. IC Markets makes no representation or warranty and assumes no liability as to the accuracy or completeness of the information provided, nor any loss arising from any investment based on a recommendation, forecast or any information supplied by any third-party.Shortby ICmarkets12
Bearish drop off pullback resistance?USD/ZAR has reacted off the pivot which is a pullback resistance and could drop to the 78.6% Fibonacci support. Pivot: 18.8560 1st Support: 18.5925 1st Resistance: 19.0351 Risk Warning: Trading Forex and CFDs carries a high level of risk to your capital and you should only trade with money you can afford to lose. Trading Forex and CFDs may not be suitable for all investors, so please ensure that you fully understand the risks involved and seek independent advice if necessary. Disclaimer: The above opinions given constitute general market commentary, and do not constitute the opinion or advice of IC Markets or any form of personal or investment advice. Any opinions, news, research, analyses, prices, other information, or links to third-party sites contained on this website are provided on an "as-is" basis, are intended only to be informative, is not an advice nor a recommendation, nor research, or a record of our trading prices, or an offer of, or solicitation for a transaction in any financial instrument and thus should not be treated as such. The information provided does not involve any specific investment objectives, financial situation and needs of any specific person who may receive it. Please be aware, that past performance is not a reliable indicator of future performance and/or results. Past Performance or Forward-looking scenarios based upon the reasonable beliefs of the third-party provider are not a guarantee of future performance. Actual results may differ materially from those anticipated in forward-looking or past performance statements. IC Markets makes no representation or warranty and assumes no liability as to the accuracy or completeness of the information provided, nor any loss arising from any investment based on a recommendation, forecast or any information supplied by any third-party.Shortby ICmarkets6
USD/ZAR Buy Setup Overview: The USD/ZAR pair is trading near a strong support zone around 18.50, a level that has consistently held over the past months. Price action suggests a potential bounce from this area. Key Points: Support Strength: The highlighted support zone has historically served as a launch point for reversals. Bullish Opportunity: The recent rejection of this level indicates buying pressure, increasing the likelihood of upward movement. Target Levels: 🎯 TP1: 18.79 – Immediate resistance. 🎯 TP2: 18.98 – Previous swing high. 🎯 TP3: 19.22 – Key resistance level. Stop Loss: Below 18.26, safeguarding against invalidation of the setup. Trade wisely and stick to your plan! Longby Charts_M7M6
USDZAR Bearish Setup: Break and RetestThe USDZAR pair has broken below the channel, signaling a shift in market sentiment toward bearish momentum. The price is currently retesting the trendline, which now serves as a potential resistance area. If the price confirms rejection at the retest of the trendline, I anticipate a bearish move targeting the 18.66384 level, which represents a logical target for this setup. This setup highlights the potential for a trendline break-and-retest continuation to the downside. Traders should look for bearish confirmation signals, such as bearish engulfing candles or rejection wicks, before considering short positions. Shortby DanieIMUpdated 117
USDZAR-BUY strategy 12 hourly chartThe pair has been going lower at a slow pace, and had to find the journey a bit. I feel we may see slightly lower, but not with a heavy conviction. Perhaps somewhere 18.6000 area starts becoming a buying entry. Strategy BUY @ 18.60-18.6250 and take profit near 18.8550.Longby peterbokma3
USD ZAR TRADE IDEA The USD/ZAR chart displays a clear upward trend since 2019, characterized by higher highs and higher lows. An ascending channel pattern has formed, with the price currently trading within its boundaries. Key resistance levels are observed at 19.8128, 19.6694, and 19.34313, forming potential supply zones where selling pressure has previously been observed. Key support levels are seen at 18.54398, 18.21901, and 17.74159, forming potential demand zones where buying support has previously been observed. Given the prevailing uptrend and the ascending channel, a long trade could be considered. A long entry could be triggered upon a break above the upper trendline of the channel or a retest of a demand zone. A stop-loss order could be placed below a recent swing low or the 18.00000 level. The profit target could be set at the 19.8128 resistance level or the upper boundary of a supply zone. It is crucial to conduct thorough research, consult with a financial advisor, and implement proper risk management strategies before entering any trade.Longby mpesiKarabo2
USDZAR - Potential Short from Key Resistance ZoneThe USDZAR pair is currently trading near a significant resistance zone around the 19.10300 level. Historically, this area has acted as a key turning point, where sellers have stepped in to push prices lower. The recent approach toward this resistance suggests a potential bearish scenario if price action confirms a rejection. A clear rejection pattern, such as bearish engulfing candles, long upper wicks, or other signs of selling pressure, could indicate the start of a downward move. If this scenario unfolds, the price may head toward the 18.62617 target level, aligning with a potential corrective phase in the market. This setup reflects the broader expectation of a pullback within the existing market structure. Traders should closely monitor price action at the resistance zone for confirmation signals before entering positions. Feel free to share your thoughts or any additional insights!Shortby TrendDivaUpdated 5
USDZAR-SELL strategy weekly chartIf we look at the decline in GOLD PRICE from the high to the recovery mode, i.e. $ 2,785 high to now current $ 2,680.. this is only a decline of 3.5%. the USDZAR is highly correlated with GOLD and the low 17.0300 area to the current price is an increase of around 12.5%. This obviosuly show misalignment, and adding a high USDX we should see the USDZAR back to around 18.50 atleast to correct the over statement. Strategy SELL @ 19.0500-19.2500 (its medium term) and take profit near 18.5000.Shortby peterbokma5
USDZAR :Market Analysis: Bearish Now, Potentially Bullish at DCurrent Market: Bearish (Downtrend) The market is currently moving downward from Point C towards Point D, indicating a bearish trend because: Price movement is consistently heading lower. A bearish market reflects that sellers are stronger than buyers at this stage. Point D is located at a critical level, the 127% Fibonacci extension of BC, which is where a potential market reversal (turnaround) is expected. If the Market Reaches Point D: Bullish (Uptrend) If the market reverses at Point D, it is expected to shift into a bullish trend: Reason: The 127% Fibonacci extension level often serves as a zone where sellers lose momentum, and buyers regain control. An upward move would indicate the market is attempting to reclaim higher levels, such as C or even beyond. Summary: Expectations for Both Directions Now: Bearish Trend: The market is moving downward towards Point D, with sellers currently in control. If Reversal Happens at Point D: Bullish Trend: If the price reverses at Point D, the market could shift upward (bullish). This would mean that buyers have regained control, potentially leading to a steady upward movement. Overall Insight: Point D is the key level that will determine the market's direction. If the price breaks below Point D and continues lower, the bearish trend will persist. If it reverses at Point D, we can expect the market to turn bullish and move higherby professionalgoldtraderUpdated 2
USDZAR Sell 18.94Looking to sell USDZAR tonight from the resistance area around 18.94, I have a few reasons for my sell bias. Firstly, Price is trading near a strong resistance and seems to have formed a head and shoulders pattern. We also observe a break of the trend line and now the price seems to be en route to retest this trend line structure. We can sell from 18.93 towards 18.70. When/If price reaches our intended target, we will look for another opportunity.Shortby Technical_AnalystZAR1
USDZAR-SELL strategy 3D chart regression channelThe pair has been moving up sharply due to USD strength overall. The USDX (see my other update) shows clearly we may see a downward move on the index, hence all pairs willo be affected, and so will the USDZAR. we are above regression channel, and this usually does not remain as it is, as it will correct likely lower to mid-channel levels. For now strategy SELL @ 18.8500-18.9500 or higher, and take profit near 18.4750 for now. Shortby peterbokma4
USDZAR-USDX SELL strategy 2D chart The USDZAR as well USDX (and USDCAD not shown) all have something in common. they are over extended (ZAR lesser), but the picture paints a thousand words (famous song). The overall direction feels we see lower USD, and even though on a day to day basis one observes tug of wars, the direction is likely lower for USD. Strategy SELL USDZAR between 18.7500-18.8750 and take profit near 18.4350 for now. Shortby peterbokma6
Bullish bounce?USD/ZAR is falling towards the pivot and could bounce to the 1st resistance. Pivot: 18.42844 1st Support: 18.21710 1st Resistance: 18.65470 Risk Warning: Trading Forex and CFDs carries a high level of risk to your capital and you should only trade with money you can afford to lose. Trading Forex and CFDs may not be suitable for all investors, so please ensure that you fully understand the risks involved and seek independent advice if necessary. Disclaimer: The above opinions given constitute general market commentary, and do not constitute the opinion or advice of IC Markets or any form of personal or investment advice. Any opinions, news, research, analyses, prices, other information, or links to third-party sites contained on this website are provided on an "as-is" basis, are intended only to be informative, is not an advice nor a recommendation, nor research, or a record of our trading prices, or an offer of, or solicitation for a transaction in any financial instrument and thus should not be treated as such. The information provided does not involve any specific investment objectives, financial situation and needs of any specific person who may receive it. Please be aware, that past performance is not a reliable indicator of future performance and/or results. Past Performance or Forward-looking scenarios based upon the reasonable beliefs of the third-party provider are not a guarantee of future performance. Actual results may differ materially from those anticipated in forward-looking or past performance statements. IC Markets makes no representation or warranty and assumes no liability as to the accuracy or completeness of the information provided, nor any loss arising from any investment based on a recommendation, forecast or any information supplied by any third-party.Longby ICmarkets2
usdzar sell tradeThe Relative Strength Index (RSI) is showing a downward trend, indicating weakening momentum. Additionally, the Moving Average Convergence Divergence (MACD) is showing a bearish crossover, further supporting the potential for a downward moveShortby Mansa_Musa_Capital0
USDZAR 1Q2025 outlookThe rand has been on the ropes since mid-December after it failed to pull the pair below the 50-day MA support. Since then the broad-based dollar strength has seen the rand give away all its post-election gains. Fundamentally there I only see two factors which are supportive for the rand as we head into 2025. The first is a strong SA trade surplus of R34.7 billion for November 2024 and the second is the SARB’s continued hawkish stance. The dollar has punished both developed and developing market currencies whose central banks opted to front run the Fed with their respective rate cuts last year and the SARB’s hawkish stance has limited the rand’s losses in 2024. Apart from these two factors, the overall risk-off sentiment stemming from the volatility in the US and other bond markets coupled with the fleeting post-election SA election optimism does not bode well for the rand. Technically, we have completed a five wave impulse for the pair which pushed the pair to a high of just shy of the psychological handle of 19.00. I believe we should see an ABC corrective pattern play out and a re-test of the levels around 18.40 and 18.50. A failed break below this support range will be the first sign for the predicted move higher towards the 2024 high of 19.35. A break below the 50-day MA will however invalidate the idea and allow the rand to re-test levels below the 18.00 handle. The 50- and 200-day MAs are currently sitting at 18.15 and we are seeing the infamous “golden cross” taking shape which is rand negative. Over the very short-term, the bearish divergence on the RSI could allow the rand to strengthen with today’s US non-farm payroll volatility. The USDZAR and the DXY both look overstretched and this week’s attempted move higher for the USDZAR does have the characteristics of a bull trap. Longby Goose960
USDZAR BUYOANDA:USDZAR BUY CONCULUSION. WEAKLY UPTRENT DAILY UPTRENT 4HR golden zone rejection but not close early entry or candle close entry Longby MONEYMACHINEEEEEUpdated 0
USDZAR BUYOANDA:USDZAR BUY CONCULUSION. WEAKLY UPTRENT DAILY UPTRENT 4HR golden zone rejection but not close early entry or candle close entry Longby MONEYMACHINEEEEE0
USDZARGood day traders as you see The rand is weak and the dollar is strong due to the investment spending the south African government did,as the price is being pull we can stay alert on the reversal wedge which was formed (A,B,C and D) below the supply zone and also kindly know that the supply the reason for it's strongest it's because of 20.000 price is also a NOTE 💸In south Africa and it has value While as we can see the A and C from The reversal wedge is close to each other which makes that a Double TOP partten.And as soon as the price is at 19.469 kindly note that you can make your entries at 19.9734 or 20.000 for a short position make sure you follow your risk management plan and also lookout fir a proper entry around the level and Hold Till TP1 and TP2Shortby pee_one_rsa2
USDZAR Good day traders as you see The rand is weak and the dollar is strong due to the investment spending the south African government did,as the price is being pull we can stay alert on the reversal wedge which was formed (A,B,C and D) below the supply zone and also kindly know that the supply the reason for it's strongest it's because of 20.000 price is also a NOTE 💸In south Africa and it has value While as we can see the A and C from The reversal wedge is close to each other which makes that a Double TOP partten.And as soon as the price is at 19.737 kindly note that you can make ur entries at 19.9700 till 20.000 for a short position make sure you follow ur risk management plan and also Lookout for a proper entry while we holding till TP1 and TP2 This is not a financial advice but an idea on how to swing USDZAR for the Upcoming Months 🙂🙏As you all know me as ur mentor @pee_one_rsa Open chats for Further explanation of the analysis Shortby pee_one_rsa1
usdzar shorusdzar short 💎Please don't be greedy ENTRY : yellow point TP : blue lines SL : below red line for LONG position above red line for SHORT position ⛔️INSTRUCTIONS 1: Please respect the yellow entry point, otherwise you risk entering too early before my strategy or too far, thus reducing gains and aggravating losses in the event of a stop loss ⛔️INSTRUCTIONS 2: For risk and money management: 5% of your wallet for LEV X ≤20 And 3% of your wallet for LEV X ≥ 20Shortby RODDYTRADINGUpdated 2