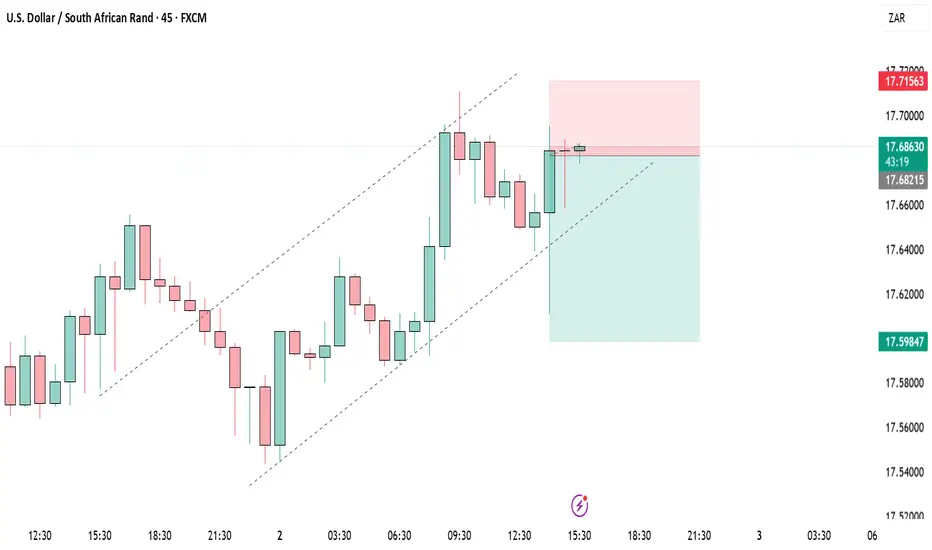
USDZAR-BUY strategy 3 hourly chart Reg., ChannelIt feels we are in a slight buying mode today. The indicators are somewhat positive, and we have made some ground before.
Strategy BY @ 17.5875-17.6350 and take profit near 17.7875
ZARUSD trade ideas

USDZAR-NEUTRAL SELL strategy 3 hourly chart Reg. ChannelI am cautiously SELL since the trend is not strong, but likely it feels seeing lower levels. We need to retest 17.60s - 17.55s before it may become oversold short-term. GOD is firmer and this helps to support this theory for now.
Strategy SELL @ 17.7500-17.7850 and take profit near 17.6000.

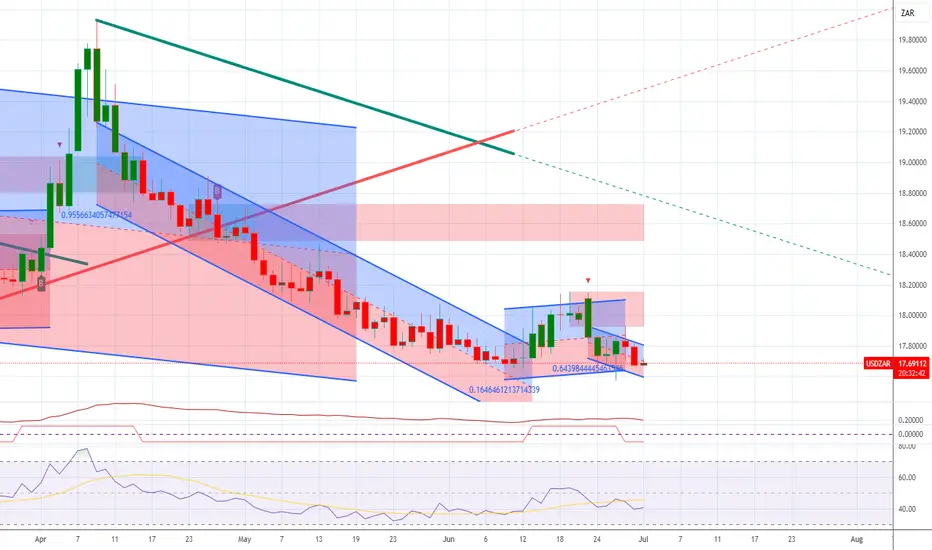
USDZAR Long trading opportunity(swing-trading) 4I expect a swing of about 50cents-75cents all the way up to R18.10+- per dollar, expecting the ZAR to weaken in the short term within a month to a few months(maybe more than a month not more than 3 months) to 18.10+-
I am risking money.

USDZAR-SELL strategy 6 hourly chartThere is selling pressure within a descending wedge, which means over-time we will see recovery. For now though short-term time frames are negative and likely we may see 17.4500 test.
Strategy SELL @ 17.5500-17.5975 and take profit near 17.4500.

SELL USDZARUSDZAR to short to nearest pivot just below the fresh low at 17,60. New York session closed negative and price will revisit that low. Enter now and when the channel breaks
USDZAR-BUY strategy 3 Hourly chart Reg. ChannelThe pair is still under pressure, and certainly not out of negative territory. I suspect we may test down side further, especially we have moved below 17.8750 area. The channel support is 17.60s and near that level would start considering BUY entry. The indicators are slightly positive, so if one is brave enough perhaps BUY even sooner, but I prefer to BUY lower end.
Strategy BUY @ 17.5975-17.6350 and take profit near 17.9000.
For those wishing to SELL ...SELL @ 17.7500-17.8000 area and take profit near 17.6350.

USDZARSince USD is bearish and ZAR is bullish,
The USD/ZAR pair has a downward bias.
Traders are betting against the U.S. Dollar and in favor of the South African Rand so USD/ZAR may move lower (ZAR appreciation).

USDZAR-SELL strategy 3 hourly chart Reg.ChannelThe pair does not show a clear direction at current levels, but considering Ichimoku cloud resistance, which is important for direction, we still have downside pressure short-term.
The key resistance lies around 17.9000-17.9300.
Strategy SELL @ 17.8250-17.8650 area and tak profit near 17.6350.

USDZARCOT Report: Shows net shorts on the USD, indicating a bearish bias for USD/ZAR as institutional traders expect the ZAR to strengthen. Bias: The bearish bias

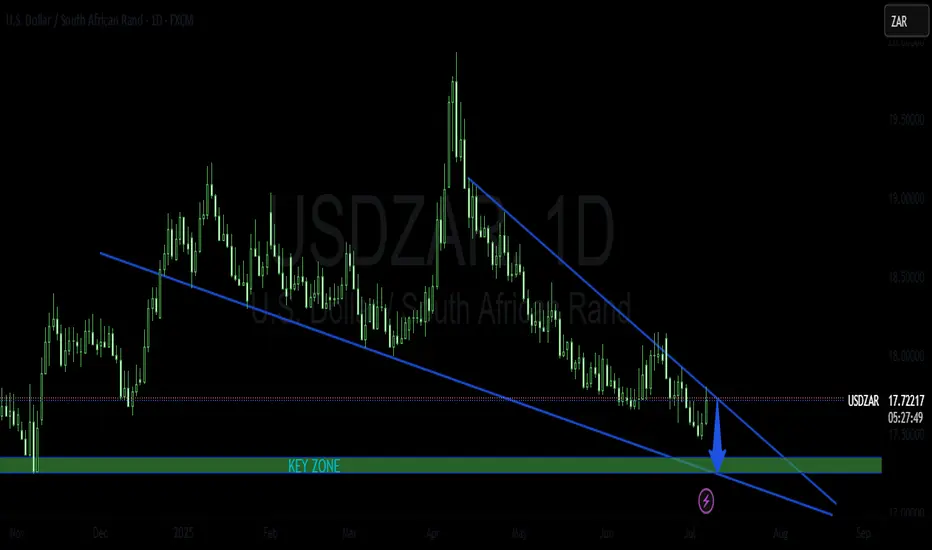
USD/ZAR accumulation zone approachingZAR strength on the back of a very weak Dollar. Potential accumulation zone approaching for those looking to take advantage of the situation.

USDZAR-SELL strategy 6 hourly chart Reg. ChannelThe pair has moved down sharply, and as always, any news can change direction quickly as we have witness again and again. Caution always is warranted.
The #D chart is still upwards, even though a pause, and down move do0es not negate the over all situation, however short-term, we are seeing weakness and we broke through support 17.8900 and signaling lower levels again. I feel we may see 17.6750, but remain alert I guess.
Strategy SELL @ 17.8650-17.8875 and take profit near 17.6750 area.

USDZAR-SELL strategy 3 Hourly chart GANNThe pair has some resistance near 17.8500 area, and we are little negative for some indicators. The move lower will be minor and should not carry high expectation of large decline. I think we are building towards sharper move higher in the medium0term.
Strategy sell @ 17.7850-17.8350 and take profit near 17.6750.

USDZAR SHORT TRADE PLANThe pair has been trading inside a bearish trend. It recently tested the boarder of the descending wedge pattern and from this point I will be looking for the reversal.
Please do your own analysis before placing any trades.
Cheers and Happy Trading !!!
USDZAR-BUY strategy 3 hourly chartThe pair was not able to move lower, and broke 17.6400 area instead. The issue was negative environment, and a descending wedge warning of move higher over-time. The move lower did not happen within the wedge. Gold also moved lower helping weakening of the ZAR.
Now the picture is near overbought state, but we should keep focus on BUY side lower. I feel maybe near 17.6750 -17.6900 is the buying zone for now.
Strategy BUY @ 17.6450-17.6900 and take profit near 17.8250 for now.

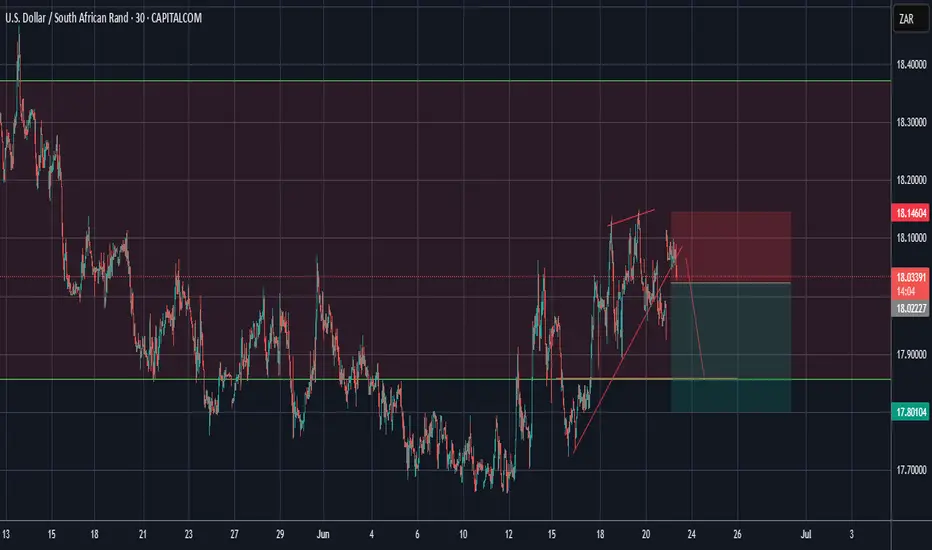
USDZAR: Sell Trigger on 4HGood morning and happy weekend everyone,
today I bring the chart of the UsdZar pair which shows a sell trigger via my LuBot Ultimate indicator which goes in favor of the short-term trend and the bearish market structure, both on the 4H and on the Daily, highlighted by the color of the candles in red.
The signal is also confirmed by the reversal signals shown above and a close below the previous 2 candles.
The indicator automatically shows exit levels that I will follow for my trade as the stop loss is far enough away to give the market room to breathe if it needs it and to avoid unnecessary stops. Stop which will subsequently be approached if the market moves in the direction of the trade.
The take profit is at the right distance given that we are close to a support zone indicated by the green area of the indicator.
Finally, the EVE indicator below has not shown any major excesses of volatility so we could still expect a strong movement before a possible reversal.
FX:USDZAR FOREXCOM:USDZAR SAXO:USDZAR FX_IDC:USDZAR OANDA:ZARJPY OANDA:EURZAR OANDA:GBPZAR OANDA:CHFZAR SAXO:AUDZAR SAXO:NZDZAR

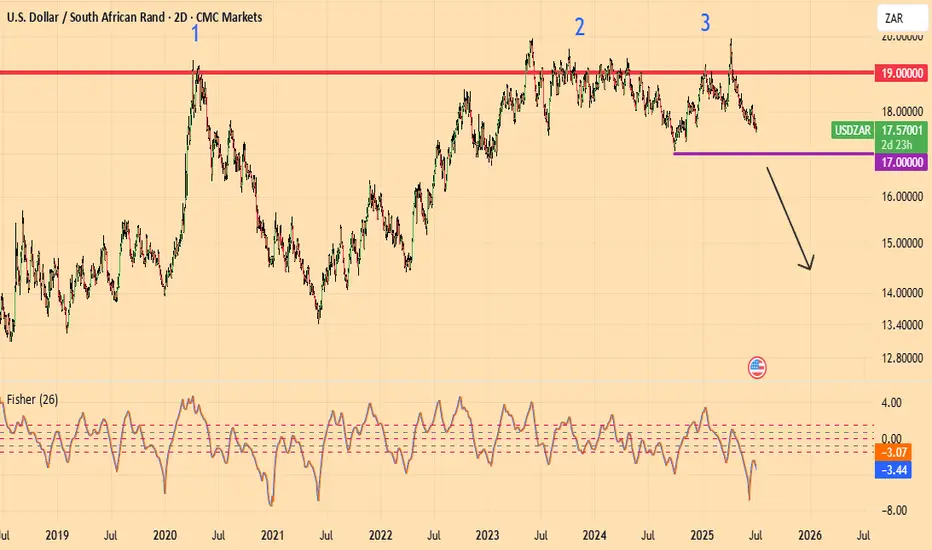
SOUTH AFRICAN RAND : bullishA triple top has formed at 19
When USDZAR falls below 17, ZAR is definitely bullish
Price actionUsdzar price has already broken above came back to sweep the low presented its self as a false breakout

USDZAR | 24.06.2025BUY 17.7400 | STOP 17.64000 | TAKE 17.8700 | Corrective upward price movement from stong support level.

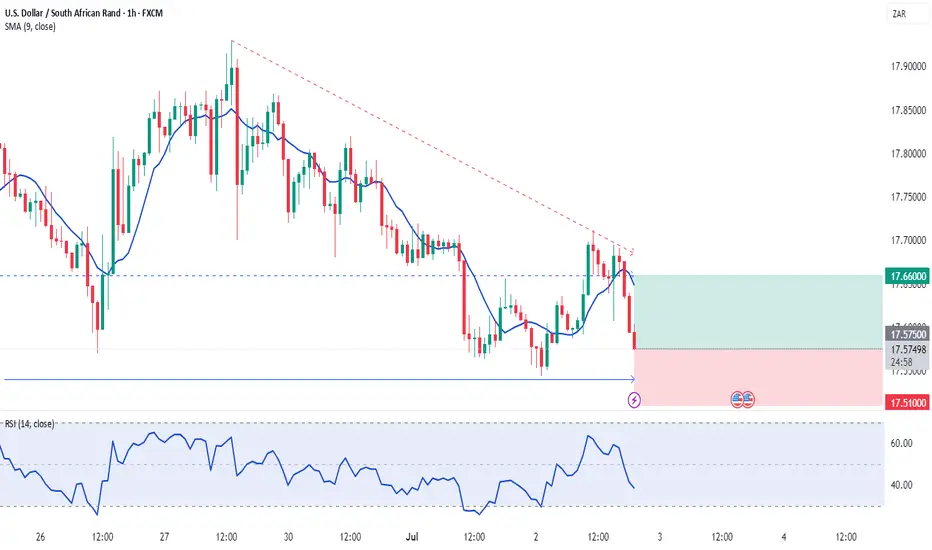
USDZAROn a shorter TF, here is the entry to sell the USDZAR, hopefully if this entry holds solid to the bigger view of this pair, we should be able to trail our SL until further notice as per the Daily TF Posted chart, alternatively we can just jump in and out at the green line (please note the green line also advises or indicates the S/R Flip Zone that's held the market quite significantly previously, so we really crossing our fingers as we hold this sell.
USDZARMy pov for USDZAR pair is that we should be expecting further gradual drops, not sure if this will be a sharp drop or consolidated one , however should we get a solid break off the support in red line, then we should be looking forth to more sellers dominating this market. Whats your view? What do you cav?

USDZAR-BY strategy 3 hourly chrt GANNW are observing a breakaway gap (possibility), and this means we will move higher over time, which is in line with 3D chart posted some days back. The market is uncertain, and any escelation or threath, should keep USD firm, and the chart merely reflect this situation. Crypto has come under pressure, meaning asset are shifting.
Strategy BUY @ 18.0150-18.0300 (or slightly higher) and take profit near 18.2450 for now.
