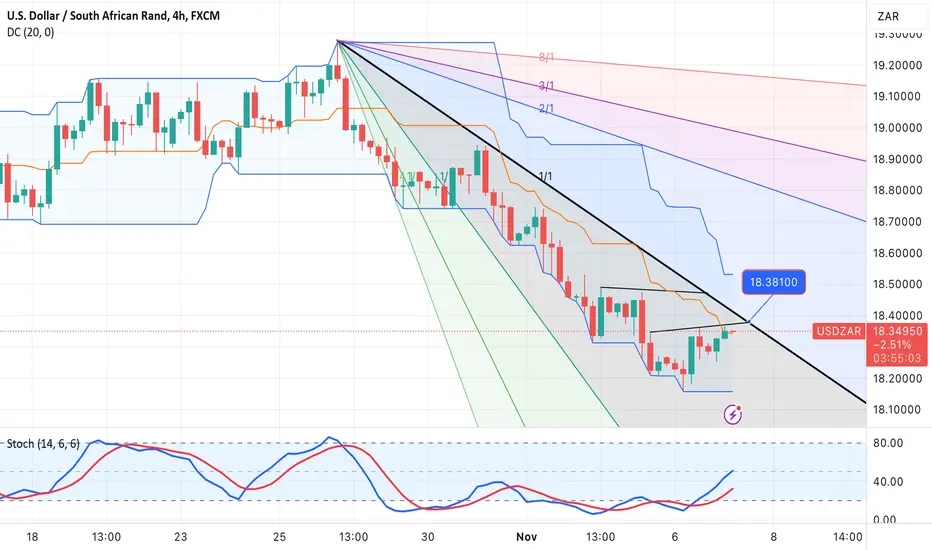
USDZAR tentative Inverse H&SHere price action is showing a higher low and creating an Inverse Head & Shoulder pattern. The down trendline is plotted on the H4 timeframe and still indicates a downtrend. However, we can see that there is enough room for the iH&S pattern target projection to be reached. The up trendline connecting the head and right shoulder creates a triangle pattern so I will consider all possible moves the price can make, read the candlesticks around area of importance, and look for momentum increase before price intersect lines to help me anticipate price direction. I use candlesticks to gauge bearish/bullish momentum.
ZARUSD trade ideas

ShortIt seems the pair has a short opportunity. 4h has hit a major OB and ATR. It seems it might fall back to the 20 day ema or may drop further.

USDZAR-SELL strategy 4-HourlyThe pair has moved higher more than wished for. GOLD has retreated further, and for that reason pair was affected.
I have not changed my view, as we are still in a continuation down trend channel, and we have resistance @ 18.6700 and support 18.4900 now (rounded). the stochastic is negative slightly.
Strategy SELL @ 18.5500-18.6150 and place SL above 18.6900. Profit order @ 18.2750.

USDZAR-SELL strategy 4 hourlyThe pair go little higher, and 18.4500 is possible. However, the pattern looks like a continuation pattern, and this suggest we should move back 18.1000 over time.
For now SELL @ 18.4300-18.4500 and place SL above 18.5200 and profit order @ 18.1350.


Ideas of set ups How's everybody's trading going ? take a quick look at this set up to see if this could help out your trading . Talk with you soon

USDZAR LONG COMING SOONHello. Looking for USDZAR to make a move upwards.
1. Ending structure
2. MACD divergence
3. Looking for price reaction at Price 16.86
Trade with care

USDZAR-BUY strategy 4-hourlyThe pair is starting to show signs of recovery, but we have GANN resistance at 18.3800.
Establishing above mid-DC will attract 18.5250 test again, and I feel it is possible.
Strategy BUY @ 18.2850-18.3500 and place SL @ 18.1550 for now. Profit order @ 18.4850.
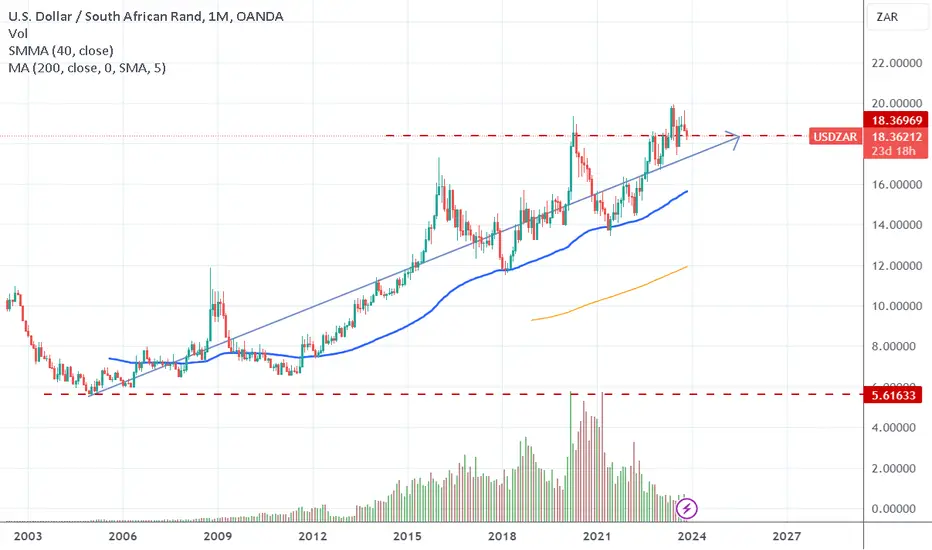
$USDZAR When local is not lekkerZAR depreciated from 5,60 to 1 USD to 18,36 to 1 USD in 17 years. The trend is clear. You're fighting a losing battle investing in local ZAR priced shares only.

I'm looking for possible buy setups.The down move in this pair is about to end. I'm looking for possible buy setups. I expect an upmove at least to be similar to the previous one Trade with care!

USDZAR-BUY strategy 4-hourly chartThe pair has been a bit oversold, but stochastic supports a bit more weakness. For that reason we should pick a lower level to buy,
Strategy BUY @ 18.1350-18.1750 and place SL below 18.0500. Profit order I suggest near 18.3850.

HeikenAshi Wavesi believe that price will will make bullish correction before continuing to the downside

USDZAR SHORT Hello everyone.
Looking forward to short USDZAR once it takes out the ORDER BLOCK.
1. Currently forming an expanding flat
2. MACD DIVERGENCE forming on 1 HR timeframe
3. A lot of liquidity at the bottom of the
4. The current move upwards (3 wave structure) will be complete once it hits the order block (19.28854)
ENTRY : 1928854
STOP LOSS: 19.47931
TAKE PROFIT 1 : 18.69111
TAKE PROFIT 2 : 18.36981
TRADE WITH CARE.
How much you're willing to loose is more important than what you think you'll gain.

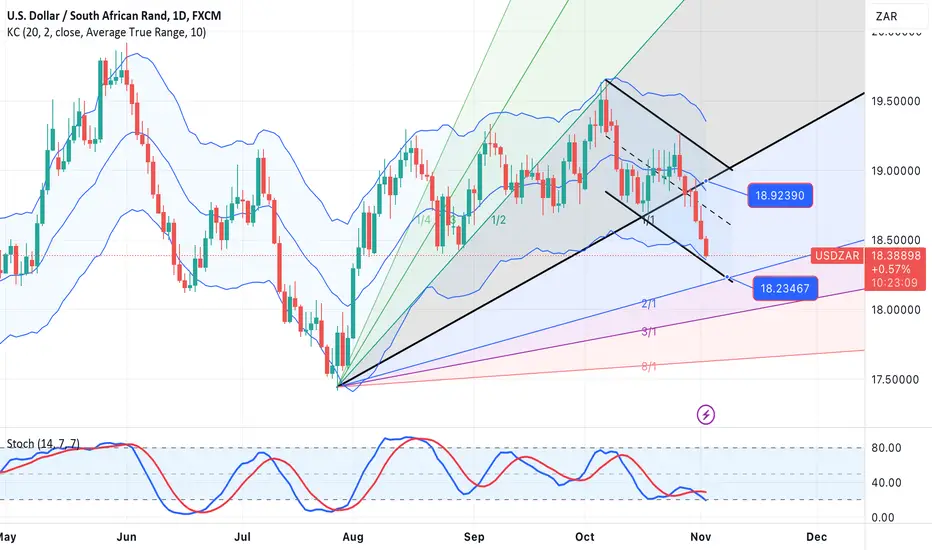
USDZAR-BUY strategy Daily chartThe pair is clearly en route 18.2300-18.2700, and it feels there is no stopping. Current levels, and also how severe we have moved from 19.0000 area, suggest caution, and even maybe a BUY try-out.
Strategy BUY @ 18.3500 and place SL @ 18.2400, and take profit @ 18. 4750.
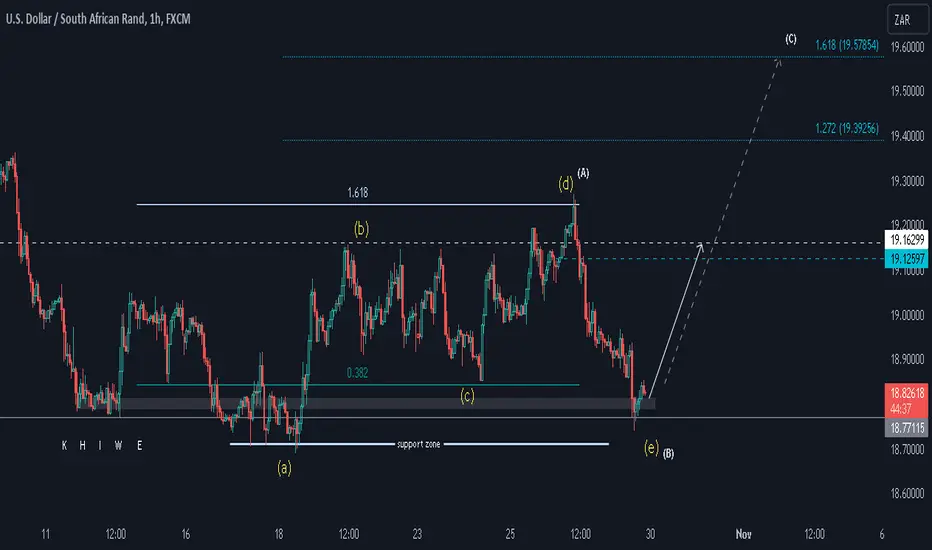
USDZAR Aiming HigherUSDZAR appears bullish on the H1, with the price acting above a support zone. The bias is 19.16299 as significant resistance but with the potential to go all the way up, up on up all the way to 19.6.
Happy Trading
K.
UsdzarLet's get ready to sell usdzar
The price broke the structure to the downside
Let's wait for the price to pull back to our oderblock
And sell this pair

USDZAR-SELL strategy 4-hourly chartThe pair did not manage to reach 19.01-19.05 area, and depending to your risk appetite, you might have sold around 18.9500. I sadly enough did not.
For now, we have downward pressure still and we violated 18.7600 as well. Stochastic is negative. Over all we have room to move until 18.2700.
Strategy SELL @ 18.8500-18.8800 area, and place SL above 18.9450. Profit order initially @ 18.4750. I suspect we will get pullback from that level.


Rand pre-budget speech and Fed rate decisionOur local unit currently remains in the range between 18.80 and 19.12. We need to see a breakout of this range to determine what direction the rand will take but for now the rand remains at the mercy of swings in investor sentiment. The dance with the 50-day MA at 18.95 will continue this week and a negative tone from the Treasury budget and continued global risk-off investor sentiment following the Fed rate announcement, will strengthen the 50-day MA support.
One positive factor which could allow the rand to test the 200-day MA at 18.53, is the recent strong performance of platinum but I don't see a major move below this support rate for the rand at the moment.

USDZAR-RANGE SELL strategy Daily chartThe pair is currently near 4-bottom area, which currently is around 18.7600. Lower we have GANN support @ 18.4500. Resistance is @ 19.1700 (trend line) and 19.40 GANN resistance. Gold is likely to move lower and this will help the pair to move back up a bit.
the case look like a range trade, and I feel preference to be SELL, even though for those willing could argue BUY near support level @ 18.7600.
Strategy SELL @ 19.0100-19.0700 and place SL @ 19.2200 for now. Profit order near support 18.7600.

USDZAR: Long term Channel Up preparing the final rally.USDZAR is trading around the 1D MA50 on neutral technicals (RSI = 45.374, MACD = -0.003, ADX = 21.007) but on a long term Channel Up for the past 2 years. This current consolidation has been the accumulation period in the two bullish legs prior before the final rally to a Higher High. This is our buy entry and we aim at the top of the Channel (TP = 21.000).
## If you like our free content follow our profile to get more daily ideas. ##
## Comments and likes are greatly appreciated. ##

Short term bullish biasReversal candlestick pattern at strong support zone, daily still within bullish channel and 4h RSI and stoch oversold
